Estimated zip code population in 2022: 14,527 Zip code population in 2010: 15,538 Zip code population in 2000: 15,399
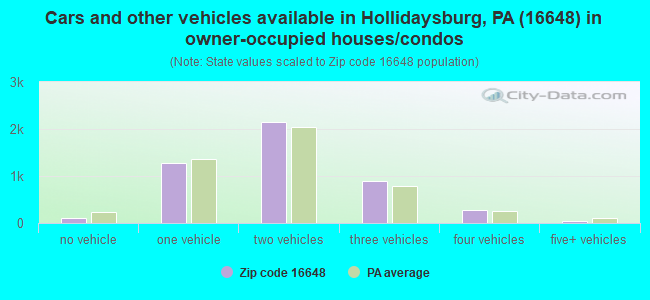
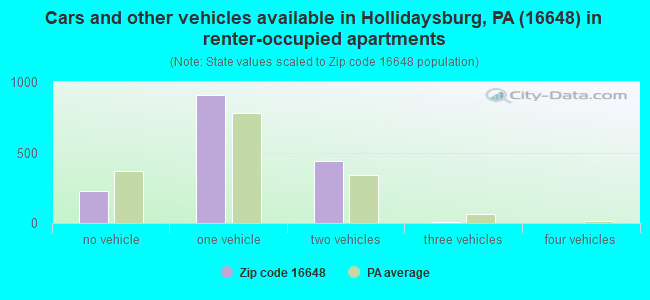
Houses and condos: 6,879 Renter-occupied apartments: 1,572
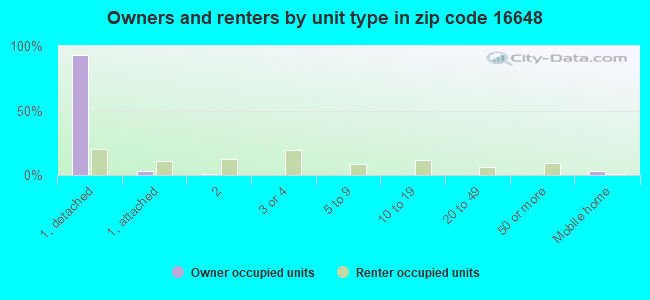
% of renters here:
25%
State:
31%
March 2022 cost of living index in zip code 16648: 92.0 (less than average, U.S. average is 100)
Land area: 57.6 sq. mi. Water area: 0.5 sq. mi.
Population density: 252 people per square mile
(very low).
OSM Map
General Map
Google Map
MSN Map
OSM Map
General Map
Google Map
MSN Map
OSM Map
General Map
Google Map
MSN Map
OSM Map
General Map
Google Map
MSN Map
Please wait while loading the map...
Real estate property taxes paid for housing units in 2022:
This zip code:
1.1% ($2,549)
Pennsylvania:
1.3% ($3,094)
Median real estate property taxes paid for housing units with mortgages in 2022: $2,787 (1.1%) Median real estate property taxes paid for housing units with no mortgage in 2022: $2,316 (1.1%)
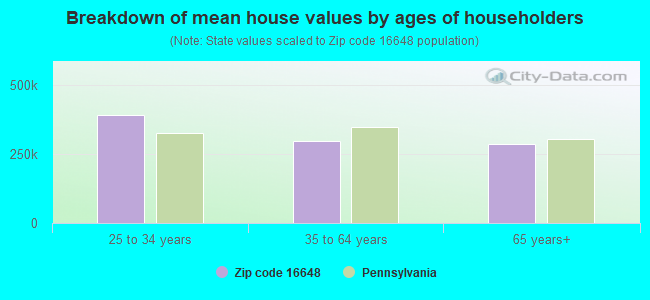
Estimated median house/condo value in 2022: $231,391
16648:
$231,391
Pennsylvania:
$245,500
According to our research of Pennsylvania and other state lists, there were 9 registered sex offenders living in 16648 zip code as of April 27, 2024. The ratio of all residents to sex offenders in zip code 16648 is 1,736 to 1. The ratio of registered sex offenders to all residents in this zip code is much lower than the state average.
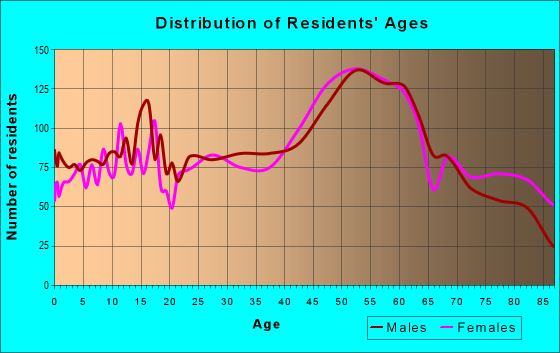
Median resident age:
This zip code:
49.5 years
Pennsylvania median age:
40.9 years
Average household size:
This zip code:
2.2 people
Pennsylvania:
2.4 people
Averages for the 2020 tax year for zip code 16648, filed in 2021:
Average Adjusted Gross Income (AGI) in 2020: $90,223 (Individual Income Tax Returns)
Here:
$90,223
State:
$75,707
Salary/wage: $65,843 (reported on 75.4% of returns)
Here:
$65,843
State:
$62,806
(% of AGI for various income ranges: 1028.9% for AGIs below $25k, 3112.6% for AGIs $25k-50k, 5688.2% for AGIs $50k-75k, 8518.5% for AGIs $75k-100k, 15941.7% for AGIs $100k-200k, 115927.3% for AGIs over 200k)
Taxable interest for individuals: $2,206 (reported on 39.6% of returns)
This zip code:
$2,206
Pennsylvania:
$1,633
(% of AGI for various income ranges: 24.3% for AGIs below $25k, 40.1% for AGIs $25k-50k, 63.5% for AGIs $50k-75k, 70.0% for AGIs $75k-100k, 177.4% for AGIs $100k-200k, 3432.7% for AGIs over 200k)
Ordinary dividends: $8,279 (reported on 28.3% of returns)
Here:
$8,279
State:
$7,382
(% of AGI for various income ranges: 47.1% for AGIs below $25k, 68.9% for AGIs $25k-50k, 136.5% for AGIs $50k-75k, 136.0% for AGIs $75k-100k, 562.1% for AGIs $100k-200k, 9865.5% for AGIs over 200k)
Net capital gain/loss in AGI: +$23,905 (reported on 23.8% of returns)
Here:
+$23,905
State:
+$23,522
(% of AGI for various income ranges: 18.6% for AGIs below $25k, 49.9% for AGIs $25k-50k, 117.7% for AGIs $50k-75k, 152.3% for AGIs $75k-100k, 696.1% for AGIs $100k-200k, 33332.7% for AGIs over 200k)
Profit/loss from business: +$23,184 (reported on 11.7% of returns)
Here:
+$23,184
State:
+$16,274
(% of AGI for various income ranges: 59.3% for AGIs below $25k, 127.4% for AGIs $25k-50k, 210.0% for AGIs $50k-75k, 264.0% for AGIs $75k-100k, 616.0% for AGIs $100k-200k, 10114.5% for AGIs over 200k)
Taxable individual retirement arrangement distribution: $17,695 (reported on 15.7% of returns)
16648:
$17,695
Pennsylvania:
$18,583
(% of AGI for various income ranges: 113.9% for AGIs below $25k, 170.8% for AGIs $25k-50k, 321.4% for AGIs $50k-75k, 422.5% for AGIs $75k-100k, 1070.6% for AGIs $100k-200k, 4839.1% for AGIs over 200k)
Self-employed (Keogh) retirement plans: $33,867 (reported on 0.8% of returns)
16648:
$33,867
Pennsylvania:
$25,407
(% of AGI for various income ranges: 52.4% for AGIs $100k-200k, 1513.6% for AGIs over 200k)
Total itemized deductions: $39,172 (reported on 5.5% of returns)
Here:
$39,172
State:
$34,850
(% of AGI for various income ranges: 115.4% for AGIs $25k-50k, 181.0% for AGIs $50k-75k, 199.1% for AGIs $75k-100k, 555.7% for AGIs $100k-200k, 8096.4% for AGIs over 200k)
Charity contributions: $16,571 (reported on 4.4% of returns)
Here:
$16,571
State:
$12,392
(% of AGI for various income ranges: 14.0% for AGIs $25k-50k, 44.4% for AGIs $50k-75k, 143.6% for AGIs $100k-200k, 3719.1% for AGIs over 200k)
Taxes paid: $7,624 (reported on 5.4% of returns)
16648:
$7,624
State:
$8,200
(% of AGI for various income ranges: 12.9% for AGIs $25k-50k, 27.3% for AGIs $50k-75k, 29.4% for AGIs $75k-100k, 122.6% for AGIs $100k-200k, 1634.5% for AGIs over 200k)
Earned income credit: $1,811 (reported on 8.5% of returns)
Here:
$1,811
State:
$2,100
(% of AGI for various income ranges: 44.8% for AGIs below $25k, 38.8% for AGIs $25k-50k)
Percentage of individuals using paid preparers for their 2020 taxes: 93.8%
Here:
94%
State:
92%
(% for various income ranges: 93.2% for AGIs below $25k, 94.3% for AGIs $25k-50k, 94.6% for AGIs $50k-75k, 92.4% for AGIs $75k-100k, 93.5% for AGIs $100k-200k, 96.2% for AGIs over 200k)
Averages for the 2012 tax year for zip code 16648, filed in 2013:
Average Adjusted Gross Income (AGI) in 2012: $72,345 (Individual Income Tax Returns)
Here:
$72,345
State:
$61,346
Salary/wage: $55,097 (reported on 77.9% of returns)
Here:
$55,097
State:
$51,902
(% of AGI for various income ranges: 65.4% for AGIs below $25k, 70.7% for AGIs $25k-50k, 69.9% for AGIs $50k-75k, 72.2% for AGIs $75k-100k, 71.0% for AGIs $100k-200k, 42.0% for AGIs over 200k)
Taxable interest for individuals: $2,183 (reported on 42.4% of returns)
This zip code:
$2,183
Pennsylvania:
$1,588
(% of AGI for various income ranges: 1.9% for AGIs below $25k, 1.1% for AGIs $25k-50k, 0.7% for AGIs $50k-75k, 0.7% for AGIs $75k-100k, 1.2% for AGIs $100k-200k, 1.6% for AGIs over 200k)
Ordinary dividends: $8,101 (reported on 29.3% of returns)
Here:
$8,101
State:
$5,827
(% of AGI for various income ranges: 2.7% for AGIs below $25k, 1.6% for AGIs $25k-50k, 1.8% for AGIs $50k-75k, 1.3% for AGIs $75k-100k, 2.3% for AGIs $100k-200k, 5.3% for AGIs over 200k)
Net capital gain/loss in AGI: +$18,670 (reported on 21.8% of returns)
Here:
+$18,670
State:
+$14,495
(% of AGI for various income ranges: 0.6% for AGIs $25k-50k, 0.9% for AGIs $50k-75k, 0.7% for AGIs $75k-100k, 2.4% for AGIs $100k-200k, 12.5% for AGIs over 200k)
Profit/loss from business: +$32,688 (reported on 12.0% of returns)
Here:
+$32,688
State:
+$16,268
(% of AGI for various income ranges: 3.5% for AGIs below $25k, 2.9% for AGIs $25k-50k, 3.1% for AGIs $50k-75k, 3.7% for AGIs $75k-100k, 4.6% for AGIs $100k-200k, 8.1% for AGIs over 200k)
Taxable individual retirement arrangement distribution: $16,362 (reported on 13.7% of returns)
16648:
$16,362
Pennsylvania:
$14,550
(% of AGI for various income ranges: 4.4% for AGIs below $25k, 3.8% for AGIs $25k-50k, 2.7% for AGIs $50k-75k, 3.1% for AGIs $75k-100k, 3.8% for AGIs $100k-200k, 2.4% for AGIs over 200k)
Self-employment retirement plans: $32,625 (reported on 1.0% of returns)
16648:
$32,625
Pennsylvania:
$20,922
Total itemized deductions: $26,069 (15% of AGI, reported on 27.3% of returns)
Here:
$26,069
State:
$23,538
Here:
15.1% of AGI
State:
18.4% of AGI
(% of AGI for various income ranges: 7.9% for AGIs below $25k, 7.9% for AGIs $25k-50k, 7.2% for AGIs $50k-75k, 9.3% for AGIs $75k-100k, 11.7% for AGIs $100k-200k, 10.6% for AGIs over 200k)
Charity contributions: $5,695 (reported on 22.4% of returns)
Here:
$5,695
State:
$4,025
(% of AGI for various income ranges: 0.6% for AGIs below $25k, 0.9% for AGIs $25k-50k, 1.0% for AGIs $50k-75k, 1.3% for AGIs $75k-100k, 2.0% for AGIs $100k-200k, 2.4% for AGIs over 200k)
Taxes paid: $10,397 (reported on 27.3% of returns)
16648:
$10,397
State:
$9,982
(% of AGI for various income ranges: 1.0% for AGIs below $25k, 1.7% for AGIs $25k-50k, 2.1% for AGIs $50k-75k, 3.2% for AGIs $75k-100k, 5.0% for AGIs $100k-200k, 5.1% for AGIs over 200k)
Earned income credit: $1,724 (reported on 10.9% of returns)
Here:
$1,724
State:
$2,106
(% of AGI for various income ranges: 3.1% for AGIs below $25k, 0.7% for AGIs $25k-50k)
Percentage of individuals using paid preparers for their 2012 taxes: 58.9%
Here:
59%
State:
53%
(% for various income ranges: 51.7% for AGIs below $25k, 56.3% for AGIs $25k-50k, 62.3% for AGIs $50k-75k, 62.9% for AGIs $75k-100k, 69.2% for AGIs $100k-200k, 85.0% for AGIs over 200k)
Averages for the 2004 tax year for zip code 16648, filed in 2005:
Average Adjusted Gross Income (AGI) in 2004: $53,369 (Individual Income Tax Returns)
Here:
$53,369
State:
$48,049
Salary/wage: $45,704 (reported on 79.4% of returns)
Here:
$45,704
State:
$42,646
(% of AGI for various income ranges: 159.0% for AGIs below $10k, 65.4% for AGIs $10k-25k, 74.0% for AGIs $25k-50k, 76.8% for AGIs $50k-75k, 78.8% for AGIs $75k-100k, 58.9% for AGIs over 100k)
Taxable interest for individuals: $1,973 (reported on 54.0% of returns)
This zip code:
$1,973
Pennsylvania:
$1,657
(% of AGI for various income ranges: 9.6% for AGIs below $10k, 3.5% for AGIs $10k-25k, 1.9% for AGIs $25k-50k, 1.5% for AGIs $50k-75k, 2.0% for AGIs $75k-100k, 1.8% for AGIs over 100k)
Taxable dividends: $3,551 (reported on 35.2% of returns)
Here:
$3,551
State:
$3,566
(% of AGI for various income ranges: 9.3% for AGIs below $10k, 2.9% for AGIs $10k-25k, 1.8% for AGIs $25k-50k, 1.4% for AGIs $50k-75k, 2.0% for AGIs $75k-100k, 2.7% for AGIs over 100k)
Net capital gain/loss: +$4,582 (reported on 26.6% of returns)
Here:
+$4,582
State:
+$9,716
(% of AGI for various income ranges: -4.1% for AGIs below $10k, 0.9% for AGIs $10k-25k, 0.9% for AGIs $25k-50k, 0.8% for AGIs $50k-75k, 1.5% for AGIs $75k-100k, 3.8% for AGIs over 100k)
Profit/loss from business: +$22,589 (reported on 13.4% of returns)
Here:
+$22,589
State:
+$14,267
(% of AGI for various income ranges: 2.5% for AGIs below $10k, 4.1% for AGIs $10k-25k, 2.6% for AGIs $25k-50k, 4.0% for AGIs $50k-75k, 3.3% for AGIs $75k-100k, 8.1% for AGIs over 100k)
IRA payment deduction: $3,125 (reported on 3.6% of returns)
16648:
$3,125
Pennsylvania:
$2,903
(% of AGI for various income ranges: 0.6% for AGIs below $10k, 0.2% for AGIs $10k-25k, 0.4% for AGIs $25k-50k, 0.3% for AGIs $50k-75k, 0.2% for AGIs $75k-100k, 0.1% for AGIs over 100k)
Self-employed pension: $20,424 (reported on 1.3% of returns)
Here:
$20,424
Pennsylvania:
$14,674
Total itemized deductions: $19,557 (16% of AGI, reported on 28.5% of returns)
Here:
$19,557
State:
$18,804
Here:
16.1% of AGI
State:
19.5% of AGI
(% of AGI for various income ranges: 10.8% for AGIs below $10k, 7.9% for AGIs $10k-25k, 9.3% for AGIs $25k-50k, 10.2% for AGIs $50k-75k, 12.3% for AGIs $75k-100k, 10.8% for AGIs over 100k)
Charity contributions deductions: $3,917 (3% of AGI, reported on 25.5% of returns)
Here:
$3,917
State:
$3,337
Here:
3.0% of AGI
State:
3.3% of AGI
(% of AGI for various income ranges: 0.5% for AGIs below $10k, 0.7% for AGIs $10k-25k, 1.1% for AGIs $25k-50k, 1.4% for AGIs $50k-75k, 1.9% for AGIs $75k-100k, 2.5% for AGIs over 100k)
Total tax: $10,525 (reported on 74.9% of returns)
16648:
$10,525
State:
$8,008
(% of AGI for various income ranges: 4.4% for AGIs below $10k, 4.3% for AGIs $10k-25k, 7.1% for AGIs $25k-50k, 9.1% for AGIs $50k-75k, 10.8% for AGIs $75k-100k, 21.8% for AGIs over 100k)
Earned income credit: $1,387 (reported on 9.2% of returns)
Here:
$1,387
State:
$1,643
Percentage of individuals using paid preparers for their 2004 taxes: 60.2%
Here:
60%
State:
56%
(% for various income ranges: 55.1% for AGIs below $10k, 57.2% for AGIs $10k-25k, 59.2% for AGIs $25k-50k, 62.4% for AGIs $50k-75k, 60.0% for AGIs $75k-100k, 76.7% for AGIs over 100k)
Household received Food Stamps/SNAP in the past 12 months: 537 Household did not receive Food Stamps/SNAP in the past 12 months: 5,785
Women who had a birth in the past 12 months: 198 (134 now married, 62 unmarried) Women who did not have a birth in the past 12 months: 2,328 (1,277 now married, 1,038 unmarried)
Housing units in zip code 16648 with a mortgage: 2,526 (412 second mortgage, 24 home equity loan, 367 both second mortgage and home equity loan) Houses without a mortgage: 140
Median monthly owner costs for units with a mortgage: $1,555 Median monthly owner costs for units without a mortgage: $517
Residents with income below the poverty level in 2022:
This zip code:
6.7%
Whole state:
11.8%
Residents with income below 50% of the poverty level in 2022:
This zip code:
4.2%
Whole state:
6.1%
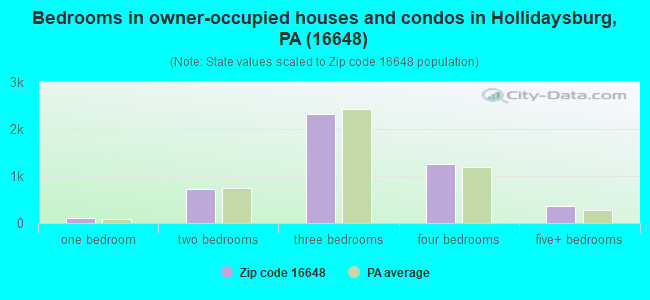
Median number of rooms in houses and condos:
Here:
7.0
State:
6.8
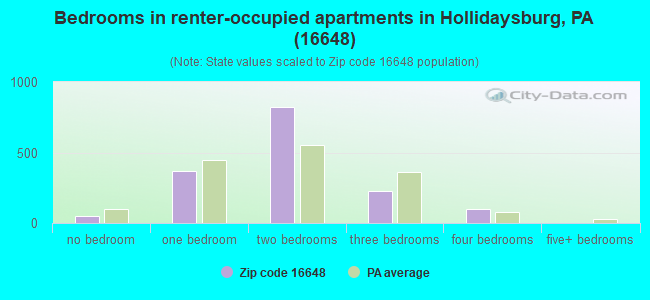
Median number of rooms in apartments:
Here:
4.7
State:
4.3
Notable locations in this zip code not listed on our city pages
Notable locations in zip code 16648: Blairmont Country Club (A), Kladder Station (B), Geeseytown Community Fire Company Station 30 (C), Phoenix Steam Fire Engine Company Station 10 (D). Display/hide their locations on the map
Churches in zip code 16648 include: West Loop Church (A), Frankstown Park Church (B), Saint Bernadines Monastery (C), Juniata Valley Church (D). Display/hide their locations on the map
Cemeteries: Lutheran Cemetery (1), Prebyterian Cemetery (2), Saint Marys Cemetery (3), Green Lawn Cemetery (4), Union Cemetery (5). Display/hide their locations on the map
Streams, rivers, and creeks: New Creek (A), Robinson Run (B), Brush Run (C), Brush Creek (D), Poplar Run (E), Beaverdam Branch (F), Oldtown Run (G). Display/hide their locations on the map
Parks in zip code 16648 include: Dell Delight Legion Park (1), Canoe Creek State Park (2), Dysart Park (3), State Game Lands Number 147 (4). Display/hide their locations on the map
In group quarters: 697 (-1 institutionalized population)
Size of family households: 2,212 2-persons, 910 3-persons, 607 4-persons, 222 5-persons, 42 6-persons, 24 7-or-more-persons
Size of nonfamily households: 1,985 1-person, 327 2-persons, 18 3-persons
1,870 married couples with children.
452 single-parent households (183 men, 269 women).
98.1% of residents of 16648 zip code speak English at home.
0.1% of residents speak Spanish at home (100% well).
0.9% of residents speak other Indo-European language at home (67% very well, 17% well, 16% not well).
0.8% of residents speak other language at home (40% very well, 60% well).
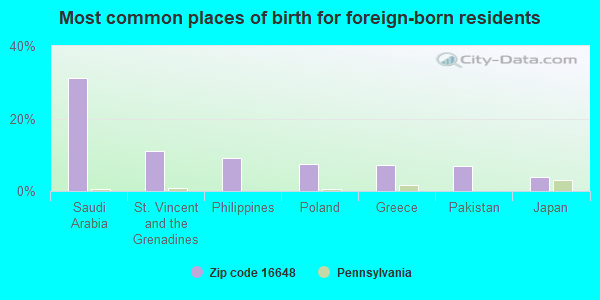
Foreign born population: 319 (2.2%) (43.4% of them are naturalized citizens)
This zip code:
2.2%
Whole state:
7.5%
31%Saudi Arabia
11%St. Vincent and the Grenadines
9%Philippines
8%Poland
7%Greece
7%Pakistan
4%Japan
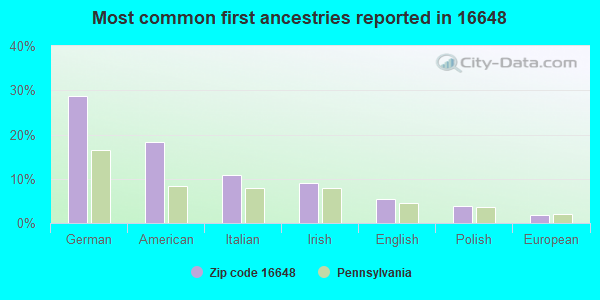
29%German
18%American
11%Italian
9%Irish
6%English
4%Polish
2%European
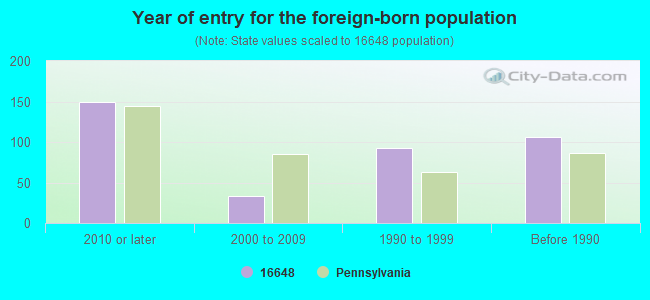
Year of entry for the foreign-born population
1492010 or later
332000 to 2009
921990 to 1999
106Before 1990
Facilities with environmental interests located in this zip code:
BLAIR CHALET (RR1 BOX 379 in HOLLIDAYSBURG, PA)
STATE MASTER (Pennsylvania database) - PCS-PA0081523, National Pollutant Discharge Elimination System Permit National Pollutant Discharge Elimination System NON-MAJOR (Tracking pollutant discharge elimination systems) - permit Business SIC classification: NURSING AND PERSONAL CARE FACILITIES
BAREFOOT DISPOSAL (CATFISH RIDGE in HOLLIDAYSBURG, PA)
SUPERFUND (Superfund database) (Integrated Compliance Information System) - ICIS-03-1996-0035, FORMAL ENFORCEMENT ACTION Alternative names: BAREFOOT LANDFILL *
ANDERSON ELECTRONICS INCORPORATED (310 PENN STREET in HOLLIDAYSBURG, PA)
(Resource Conservation and Recovery Act (tracking hazardous waste)) Organizations: OPERNAME (CONTACT/OPERATOR)
, W H ANDERSON PRESIDENT (CONTACT/OWNER)
ANDERSON ELECTRONICS INC (SCOTCH VALLEY RD BLDG #2 in HOLLIDAYSBURG, PA)
Small Quantity Generators, between 100 kg and 1000 kg of hazardous waste/month (Resource Conservation and Recovery Act (tracking hazardous waste)) - notification Organizations: OPERNAME (CONTACT/OPERATOR)
AUTO WHOLESALERS (RD 3 BOX 184A in HOLLIDAYSBURG, PA)
Small Quantity Generators, between 100 kg and 1000 kg of hazardous waste/month (Resource Conservation and Recovery Act (tracking hazardous waste)) - notification Organizations: KEVIN CANOLE (CONTACT/OWNER)
Housing units lacking complete plumbing facilities: 1.2% Housing units lacking complete kitchen facilities: 1.3%
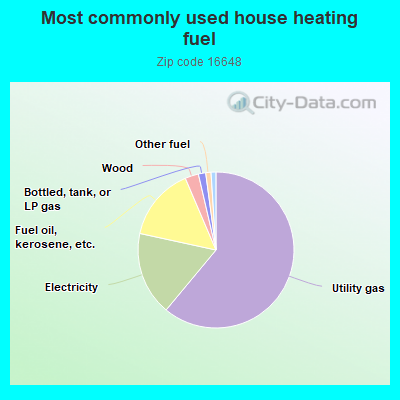
60.8%Utility gas
17.3%Electricity
15.1%Fuel oil, kerosene, etc.
2.8%Wood
1.5%Bottled, tank, or LP gas
1.1%Other fuel
1.0%Coal or coke
Population in 1990: 12,867. Population change in the 1990s: +2,532 (+19.7%).
Place of birth for U.S.-born residents:
This state: 11,695
Northeast: 829
Midwest: 628
South: 766
West: 167
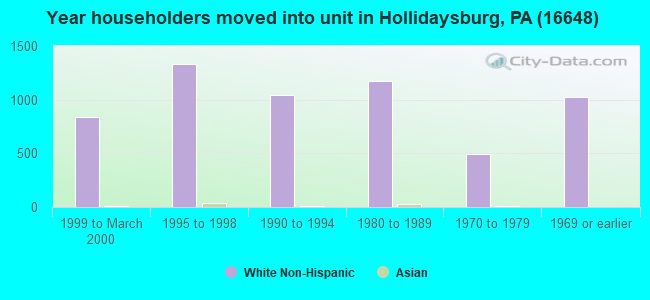
65% of the 16648 zip code residents lived in the same house 5 years ago. Out of people who lived in different houses, 71% lived in this county. Out of people who lived in different counties, 50% lived in Pennsylvania.
92% of the 16648 zip code residents lived in the same house 1 year ago. Out of people who lived in different houses, 62% moved from this county. Out of people who lived in different houses, 12% moved from different county within same state. Out of people who lived in different houses, 26% moved from different state. Out of people who lived in different houses, 0% moved from abroad.
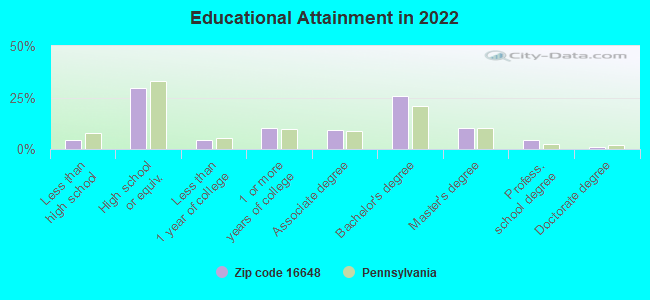
Private vs. public school enrollment:
Students in private schools in grades 1 to 8 (elementary and middle school): 91
Here:
7.4%
Pennsylvania:
15.7%
Students in private schools in grades 9 to 12 (high school): 22
Here:
3.4%
Pennsylvania:
13.4%
Students in private undergraduate colleges: 91
Here:
37.8%
Pennsylvania:
39.8%
Occupation by median earnings in the past 12 months ($)
128,432Life, physical, and social science occupations
110,799Computer and mathematical occupations
108,673Architecture and engineering occupations
81,506Business and financial operations occupations
77,602Management occupations
75,204Fire fighting and prevention, and other protective service workers including supervisors
Companies with federal contracts located in this zip code (HOLLIDAYSBURG, PA):
HOLLIDAYSBURG VETERANS HOME (OLD RTE 220 & MEADOWS INT) : $24,579,692 in 49 contractsfrom 2000 to 2003
Contracts for Nursing Home Care Contracts by Department of Veterans Affairs Signed by year:2000: $8,060,000; 2001: $6,006,000; 2002: $6,766,670; 2003: $3,747,022; 2004: $0; 2005: $0; 2006: $0.
Biggest contracts:
$4,838,000 with Department of Veterans Affairs for Nursing Home Care Contracts. Signed on 2000-09-15. Completion date: 2000-12-15.
$1,650,000, same as above.Signed on 2000-10-15. Completion date: 2001-09-15.
$1,192,000, same as above.Signed on 2001-09-15. Completion date: 2001-10-15.
$1,057,000, same as above.Signed on 2001-05-15. Completion date: 2001-05-15.
GRANNAS BROTHERS (SCOTCH VALLEY RD; small business) 75 employees, $11800000 revenue. : $180,995 in 4 contractsfrom 2000 to 2003
$139,715 with Department of Veterans Affairs for Maintenance, Repair or Alteration of Real Property -- Other Hospital Buildings. Signed on 2002-10-15. Completion date: 2002-11-15.
$21,000, same as above.Signed on 2002-09-15. Completion date: 2002-10-15.
$19,000, same as above.Signed on 2000-10-15. Completion date: 2000-12-15.
$1,280, same as above.Signed on 2003-04-15. Completion date: 2003-05-15.
MADDENS, INC (RESERVOIR RD; small business) 8 employees, $1600000 revenue. : $153,000 in 2 contractsin 2000
$143,000 with Department of Veterans Affairs for Maintenance, Repair or Alteration of Real Property -- Other Hospital Buildings. Signed on 2000-09-15. Completion date: 2001-03-15.
$10,000, same as above.Signed on 2000-11-15. Completion date: 2001-03-15.
ANDERSON ELECTRONICS, INC (SCOTCH VALLEY RD; small business)
$4,294 with Defense Logistics Agency for Oscillators and Piezoelectric Crystals. Signed on 2005-05-31. Completion date: 2005-10-29.
Top industries in this zip code by the number of employees in 2005:
Health Care and Social Assistance: Nursing Care Facilities (250-499 employees: 1 establishment, 100-249 employees: 1 establishment, 10-19 employees: 1 establishment)
2004 - 2018 National Fire Incident Reporting System (NFIRS) incidents
According to the data from the years 2004 - 2018 the average number of fires per year is 9. The highest number of fires - 46 took place in 2017, and the least - 0 in 2005. The data has a rising trend.
When looking into fire subcategories, the most incidents belonged to: Structure Fires (60.3%), and Other (15.4%).
Fire incident types reported to NFIRS in Zip Code 16648


 Nearest zip codes: 16602, 16665, 16693, 16662, 16601, 16673.
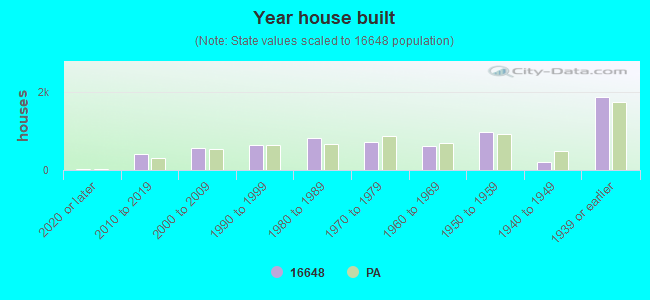


 According to the data from the years 2004 - 2018 the average number of fires per year is 9. The highest number of fires - 46 took place in 2017, and the least - 0 in 2005. The data has a rising trend.
 When looking into fire subcategories, the most incidents belonged to: Structure Fires (60.3%), and Other (15.4%).