Estimated zip code population in 2022: 4,106 Zip code population in 2010: 4,185 Zip code population in 2000: 4,368
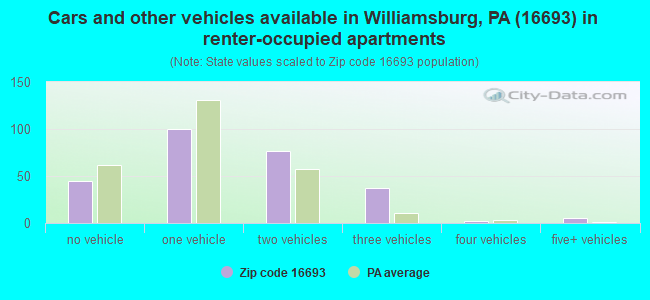
Houses and condos: 1,673 Renter-occupied apartments: 265
% of renters here:
17%
State:
31%
March 2022 cost of living index in zip code 16693: 90.9 (less than average, U.S. average is 100)
Land area: 74.9 sq. mi. Water area: 0.0 sq. mi.
Population density: 55 people per square mile
(very low).
OSM Map
General Map
Google Map
MSN Map
OSM Map
General Map
Google Map
MSN Map
OSM Map
General Map
Google Map
MSN Map
OSM Map
General Map
Google Map
MSN Map
Please wait while loading the map...
Real estate property taxes paid for housing units in 2022:
This zip code:
1.0% ($1,572)
Pennsylvania:
1.3% ($3,094)
Median real estate property taxes paid for housing units with mortgages in 2022: $1,600 (0.9%) Median real estate property taxes paid for housing units with no mortgage in 2022: $1,522 (1.1%)
Business Search- 14 Million verified businesses
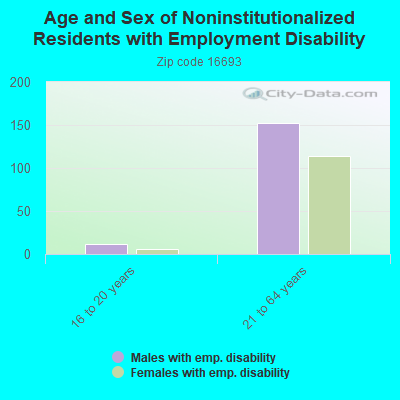
Males: 2,230
(54.3%)
Females: 1,876
(45.7%)
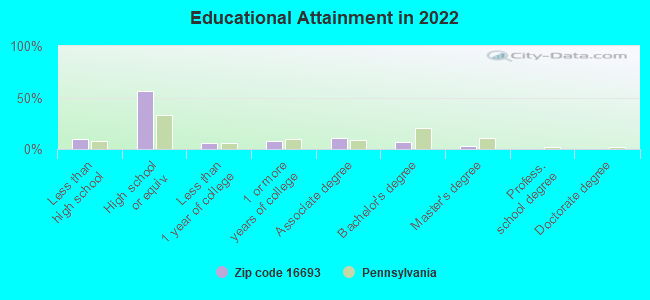
For population 25 years and over in 16693:
High school or higher: 88.7%
Bachelor's degree or higher: 10.5%
Graduate or professional degree: 3.8%
Unemployed: 2.9%
Mean travel time to work (commute): 27.0 minutes
For population 15 years and over in 16693:
Never married: 31.7%
Now married: 49.6%
Separated: 1.3%
Widowed: 6.1%
Divorced: 11.3%
Zip code 16693 compared to state average:
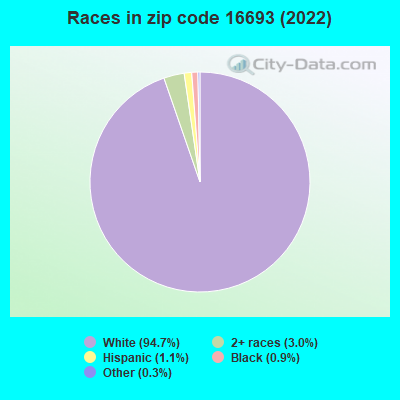
Black race population percentage significantly below state average.
Hispanic race population percentage significantly below state average.
Foreign-born population percentage significantly below state average.
Renting percentage below state average.
Length of stay since moving in significantly above state average.
Percentage of population with a bachelor's degree or higher significantly below state average.
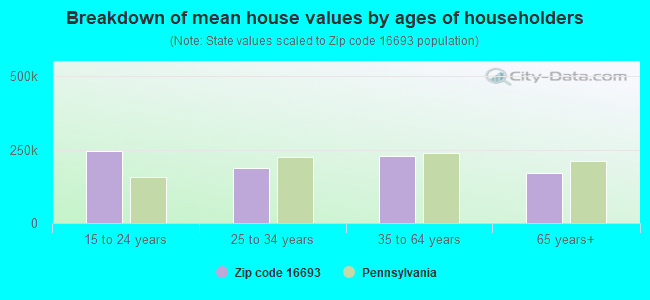
Estimated median house/condo value in 2022: $164,101
16693:
$164,101
Pennsylvania:
$245,500
According to our research of Pennsylvania and other state lists, there were 5 registered sex offenders living in 16693 zip code as of April 26, 2024. The ratio of all residents to sex offenders in zip code 16693 is 901 to 1. The ratio of registered sex offenders to all residents in this zip code is lower than the state average.
Median resident age:
This zip code:
39.8 years
Pennsylvania median age:
40.9 years
Average household size:
This zip code:
2.5 people
Pennsylvania:
2.4 people
Averages for the 2020 tax year for zip code 16693, filed in 2021:
Average Adjusted Gross Income (AGI) in 2020: $48,146 (Individual Income Tax Returns)
Here:
$48,146
State:
$75,707
Salary/wage: $44,238 (reported on 76.4% of returns)
Here:
$44,238
State:
$62,806
(% of AGI for various income ranges: 1097.4% for AGIs below $25k, 3548.3% for AGIs $25k-50k, 6145.7% for AGIs $50k-75k, 9132.1% for AGIs $75k-100k, 12716.9% for AGIs $100k-200k)
Taxable interest for individuals: $1,004 (reported on 27.2% of returns)
This zip code:
$1,004
Pennsylvania:
$1,633
(% of AGI for various income ranges: 24.0% for AGIs below $25k, 32.4% for AGIs $25k-50k, 73.0% for AGIs $50k-75k, 32.1% for AGIs $75k-100k, 63.8% for AGIs $100k-200k)
Ordinary dividends: $2,077 (reported on 15.4% of returns)
Here:
$2,077
State:
$7,382
(% of AGI for various income ranges: 31.2% for AGIs below $25k, 43.4% for AGIs $25k-50k, 48.3% for AGIs $50k-75k, 63.6% for AGIs $75k-100k, 85.4% for AGIs $100k-200k)
Net capital gain/loss in AGI: +$9,408 (reported on 13.3% of returns)
Here:
+$9,408
State:
+$23,522
(% of AGI for various income ranges: 19.5% for AGIs below $25k, 29.3% for AGIs $25k-50k, 120.9% for AGIs $50k-75k, 170.0% for AGIs $75k-100k, 1327.7% for AGIs $100k-200k)
Profit/loss from business: +$10,477 (reported on 11.3% of returns)
Here:
+$10,477
State:
+$16,274
(% of AGI for various income ranges: 90.0% for AGIs below $25k, 145.1% for AGIs $25k-50k, 160.4% for AGIs $50k-75k, 241.4% for AGIs $75k-100k, 473.8% for AGIs $100k-200k)
Taxable individual retirement arrangement distribution: $12,200 (reported on 9.7% of returns)
16693:
$12,200
Pennsylvania:
$18,583
(% of AGI for various income ranges: 97.9% for AGIs below $25k, 99.0% for AGIs $25k-50k, 159.1% for AGIs $50k-75k, 321.4% for AGIs $75k-100k, 519.2% for AGIs $100k-200k)
Total itemized deductions: $37,733 (reported on 1.5% of returns)
Here:
$37,733
State:
$34,850
(% of AGI for various income ranges: 492.2% for AGIs $50k-75k)
Taxes paid: $5,867 (reported on 1.5% of returns)
16693:
$5,867
State:
$8,200
(% of AGI for various income ranges: 76.5% for AGIs $50k-75k)
Earned income credit: $2,089 (reported on 14.4% of returns)
Here:
$2,089
State:
$2,100
(% of AGI for various income ranges: 79.1% for AGIs below $25k, 59.8% for AGIs $25k-50k)
Percentage of individuals using paid preparers for their 2020 taxes: 95.9%
Here:
96%
State:
92%
(% for various income ranges: 95.7% for AGIs below $25k, 96.3% for AGIs $25k-50k, 96.8% for AGIs $50k-75k, 95.0% for AGIs $75k-100k, 94.4% for AGIs $100k-200k, 100.0% for AGIs over 200k)
Averages for the 2012 tax year for zip code 16693, filed in 2013:
Average Adjusted Gross Income (AGI) in 2012: $38,748 (Individual Income Tax Returns)
Here:
$38,748
State:
$61,346
Salary/wage: $34,507 (reported on 82.4% of returns)
Here:
$34,507
State:
$51,902
(% of AGI for various income ranges: 68.4% for AGIs below $25k, 77.8% for AGIs $25k-50k, 77.8% for AGIs $50k-75k, 78.6% for AGIs $75k-100k, 59.1% for AGIs $100k-200k)
Taxable interest for individuals: $1,131 (reported on 30.6% of returns)
This zip code:
$1,131
Pennsylvania:
$1,588
(% of AGI for various income ranges: 1.6% for AGIs below $25k, 0.7% for AGIs $25k-50k, 0.6% for AGIs $50k-75k, 0.4% for AGIs $75k-100k, 1.6% for AGIs $100k-200k)
Ordinary dividends: $2,312 (reported on 17.1% of returns)
Here:
$2,312
State:
$5,827
(% of AGI for various income ranges: 1.3% for AGIs below $25k, 0.6% for AGIs $25k-50k, 0.5% for AGIs $50k-75k, 1.0% for AGIs $75k-100k, 2.3% for AGIs $100k-200k)
Net capital gain/loss in AGI: +$6,386 (reported on 10.9% of returns)
Here:
+$6,386
State:
+$14,495
(% of AGI for various income ranges: 0.5% for AGIs below $25k, 1.6% for AGIs $25k-50k, 1.2% for AGIs $50k-75k, 2.0% for AGIs $75k-100k, 3.7% for AGIs $100k-200k)
Profit/loss from business: +$10,923 (reported on 11.4% of returns)
Here:
+$10,923
State:
+$16,268
(% of AGI for various income ranges: 4.9% for AGIs below $25k, 2.6% for AGIs $25k-50k, 3.0% for AGIs $50k-75k, 6.2% for AGIs $75k-100k)
Taxable individual retirement arrangement distribution: $9,940 (reported on 7.8% of returns)
16693:
$9,940
Pennsylvania:
$14,550
(% of AGI for various income ranges: 2.7% for AGIs below $25k, 1.3% for AGIs $25k-50k, 1.6% for AGIs $50k-75k, 4.9% for AGIs $75k-100k)
Total itemized deductions: $15,492 (22% of AGI, reported on 13.0% of returns)
Here:
$15,492
State:
$23,538
Here:
22.0% of AGI
State:
18.4% of AGI
(% of AGI for various income ranges: 3.3% for AGIs below $25k, 3.4% for AGIs $25k-50k, 4.6% for AGIs $50k-75k, 6.6% for AGIs $75k-100k, 8.8% for AGIs $100k-200k)
Charity contributions: $4,324 (reported on 8.8% of returns)
Here:
$4,324
State:
$4,025
(% of AGI for various income ranges: 0.8% for AGIs $25k-50k, 0.8% for AGIs $50k-75k, 0.7% for AGIs $75k-100k, 2.6% for AGIs $100k-200k)
Taxes paid: $4,440 (reported on 13.0% of returns)
16693:
$4,440
State:
$9,982
(% of AGI for various income ranges: 0.4% for AGIs below $25k, 0.9% for AGIs $25k-50k, 1.3% for AGIs $50k-75k, 2.1% for AGIs $75k-100k, 2.9% for AGIs $100k-200k)
Earned income credit: $2,070 (reported on 17.1% of returns)
Here:
$2,070
State:
$2,106
(% of AGI for various income ranges: 4.5% for AGIs below $25k, 1.0% for AGIs $25k-50k)
Percentage of individuals using paid preparers for their 2012 taxes: 66.3%
Here:
66%
State:
53%
(% for various income ranges: 61.2% for AGIs below $25k, 68.5% for AGIs $25k-50k, 63.3% for AGIs $50k-75k, 86.7% for AGIs $75k-100k, 77.8% for AGIs $100k-200k)
Averages for the 2004 tax year for zip code 16693, filed in 2005:
Average Adjusted Gross Income (AGI) in 2004: $31,092 (Individual Income Tax Returns)
Here:
$31,092
State:
$48,049
Salary/wage: $30,241 (reported on 83.0% of returns)
Here:
$30,241
State:
$42,646
(% of AGI for various income ranges: 89.7% for AGIs below $10k, 68.5% for AGIs $10k-25k, 84.6% for AGIs $25k-50k, 85.1% for AGIs $50k-75k, 81.6% for AGIs $75k-100k, 61.9% for AGIs over 100k)
Taxable interest for individuals: $1,158 (reported on 42.5% of returns)
This zip code:
$1,158
Pennsylvania:
$1,657
(% of AGI for various income ranges: 5.4% for AGIs below $10k, 2.5% for AGIs $10k-25k, 1.0% for AGIs $25k-50k, 1.6% for AGIs $50k-75k, 1.8% for AGIs $75k-100k, 0.6% for AGIs over 100k)
Taxable dividends: $863 (reported on 21.5% of returns)
Here:
$863
State:
$3,566
(% of AGI for various income ranges: 2.2% for AGIs below $10k, 1.3% for AGIs $10k-25k, 0.4% for AGIs $25k-50k, 0.3% for AGIs $50k-75k, 0.6% for AGIs $75k-100k, 0.7% for AGIs over 100k)
Net capital gain/loss: +$4,278 (reported on 13.5% of returns)
Here:
+$4,278
State:
+$9,716
(% of AGI for various income ranges: 0.1% for AGIs below $10k, 0.4% for AGIs $10k-25k, 1.3% for AGIs $25k-50k, 1.0% for AGIs $50k-75k, 0.4% for AGIs $75k-100k, 15.4% for AGIs over 100k)
Profit/loss from business: +$5,660 (reported on 13.0% of returns)
Here:
+$5,660
State:
+$14,267
(% of AGI for various income ranges: 2.1% for AGIs below $10k, 6.7% for AGIs $10k-25k, 2.6% for AGIs $25k-50k, 1.3% for AGIs $50k-75k, 0.2% for AGIs $75k-100k)
Profit/loss from farming: +$2,149 (reported on 4.0% of returns)
Here:
+$2,149
State:
+$274
(% of AGI for various income ranges: -1.3% for AGIs below $10k, 0.7% for AGIs $10k-25k, 0.6% for AGIs $25k-50k, -0.0% for AGIs $50k-75k)
IRA payment deduction: $2,642 (reported on 2.9% of returns)
16693:
$2,642
Pennsylvania:
$2,903
Total itemized deductions: $13,329 (23% of AGI, reported on 13.6% of returns)
Here:
$13,329
State:
$18,804
Here:
23.1% of AGI
State:
19.5% of AGI
(% of AGI for various income ranges: 4.6% for AGIs $10k-25k, 4.8% for AGIs $25k-50k, 5.9% for AGIs $50k-75k, 9.2% for AGIs $75k-100k, 10.1% for AGIs over 100k)
Charity contributions deductions: $2,779 (5% of AGI, reported on 11.8% of returns)
Here:
$2,779
State:
$3,337
Here:
4.8% of AGI
State:
3.3% of AGI
(% of AGI for various income ranges: 0.6% for AGIs $10k-25k, 0.9% for AGIs $25k-50k, 1.0% for AGIs $50k-75k, 1.6% for AGIs $75k-100k, 2.5% for AGIs over 100k)
Total tax: $3,311 (reported on 71.7% of returns)
16693:
$3,311
State:
$8,008
(% of AGI for various income ranges: 2.9% for AGIs below $10k, 4.7% for AGIs $10k-25k, 6.4% for AGIs $25k-50k, 8.3% for AGIs $50k-75k, 10.3% for AGIs $75k-100k, 15.3% for AGIs over 100k)
Earned income credit: $1,495 (reported on 16.7% of returns)
Here:
$1,495
State:
$1,643
Percentage of individuals using paid preparers for their 2004 taxes: 67.9%
Here:
68%
State:
56%
(% for various income ranges: 60.3% for AGIs below $10k, 68.3% for AGIs $10k-25k, 71.4% for AGIs $25k-50k, 69.4% for AGIs $50k-75k, 72.3% for AGIs $75k-100k, 78.6% for AGIs over 100k)
Household received Food Stamps/SNAP in the past 12 months: 233 Household did not receive Food Stamps/SNAP in the past 12 months: 1,324
Women who had a birth in the past 12 months: 45 (29 now married, 15 unmarried) Women who did not have a birth in the past 12 months: 798 (416 now married, 379 unmarried)
Housing units in zip code 16693 with a mortgage: 726 (73 second mortgage, 64 both second mortgage and home equity loan) Houses without a mortgage: 47
Median monthly owner costs for units with a mortgage: $1,120 Median monthly owner costs for units without a mortgage: $492
Residents with income below the poverty level in 2022:
This zip code:
13.3%
Whole state:
11.8%
Residents with income below 50% of the poverty level in 2022:
This zip code:
7.7%
Whole state:
6.1%
Median number of rooms in houses and condos:
Here:
6.5
State:
6.8
Median number of rooms in apartments:
Here:
5.5
State:
4.3
Notable locations in this zip code not listed on our city pages
Notable locations in zip code 16693: Cove Forge (A), Sparr (B), Stacy Knob (C), Williamsburg Area Volunteer Fire Company 1 Station Suite B (D), Martinsburg Sportsmens Lodge (E). Display/hide their locations on the map
Churches in zip code 16693 include: Morrel Chapel (A), Saint Johns Church (B), Keller Chapel (C), Saint Marys Church (D), Fairview Church (E), Smithfield Church (F), Eight Square Chapel (G), Cove Forge Church (H). Display/hide their locations on the map
Cemeteries: Biddle Cemetery (1), Williams Cemetery (2), Bosler Cemetery (3), Snively Cemetery (4), Saint Josephs Cemetery (5), Schmucker Cemetery (6), David Beck Cemetery (7). Display/hide their locations on the map
Streams, rivers, and creeks: Township Run (A), Snare Run (B), Yellow Spring Run (C), Clover Creek (D), Schmucker Run (E), Canoe Creek (F), Roaring Run (G), Piney Creek (H). Display/hide their locations on the map
Parks in zip code 16693 include: Williamsburg Sportsmens Park (1), State Game Lands Number 118 (2), State Game Lands Number 166 (3). Display/hide their locations on the map
In group quarters: 200 (-1 institutionalized population)
Size of family households: 501 2-persons, 221 3-persons, 221 4-persons, 69 5-persons, 8 6-persons, 43 7-or-more-persons
Size of nonfamily households: 365 1-person, 125 2-persons
584 married couples with children.
193 single-parent households (76 men, 117 women).
93.5% of residents of 16693 zip code speak English at home.
0.4% of residents speak Spanish at home (88% very well, 12% well).
5.3% of residents speak other Indo-European language at home (76% very well, 21% well, 3% not well).
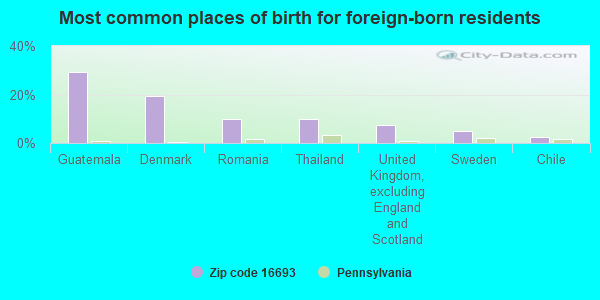
Foreign born population: 41 (1.0%) (75.8% of them are naturalized citizens)
This zip code:
1.0%
Whole state:
7.5%
29%Guatemala
20%Denmark
10%Romania
10%Thailand
7%United Kingdom, excluding England and Scotland
5%Sweden
2%Chile
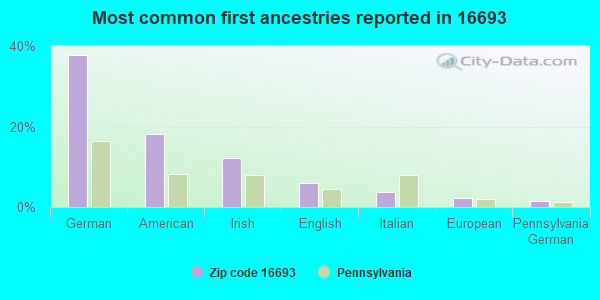
38%German
18%American
12%Irish
6%English
4%Italian
2%European
1%Pennsylvania German
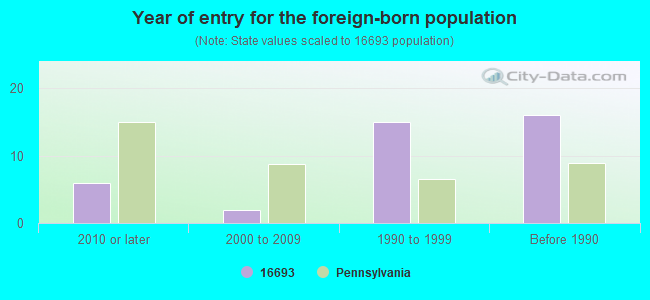
Year of entry for the foreign-born population
62010 or later
22000 to 2009
151990 to 1999
16Before 1990
Facilities with environmental interests located in this zip code:
BRUMBAUGH TRANSMISSION SVCS (BOX 62 FRANKSTOWN RD in WILLIAMSBURG, PA)
Small Quantity Generators, between 100 kg and 1000 kg of hazardous waste/month (Resource Conservation and Recovery Act (tracking hazardous waste)) - notification Organizations: BRUMBAUGH GARY (CONTACT/OWNER)
Housing units lacking complete plumbing facilities: 1.8% Housing units lacking complete kitchen facilities: 1.8%
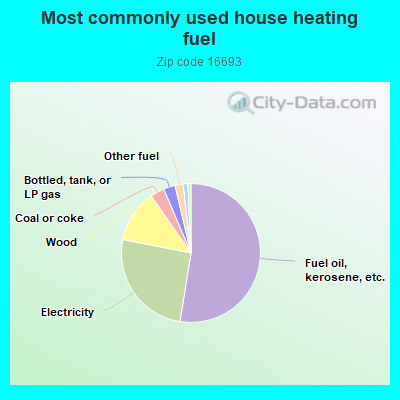
52.6%Fuel oil, kerosene, etc.
25.6%Electricity
12.2%Wood
3.3%Coal or coke
2.7%Bottled, tank, or LP gas
1.9%Other fuel
1.1%Utility gas
0.7%No fuel used
Population in 1990: 4,799.
Place of birth for U.S.-born residents:
This state: 3,729
Northeast: 66
Midwest: 92
South: 112
West: 28
74% of the 16693 zip code residents lived in the same house 5 years ago. Out of people who lived in different houses, 74% lived in this county. Out of people who lived in different counties, 50% lived in Pennsylvania.
88% of the 16693 zip code residents lived in the same house 1 year ago. Out of people who lived in different houses, 45% moved from this county. Out of people who lived in different houses, 42% moved from different county within same state. Out of people who lived in different houses, 10% moved from different state.
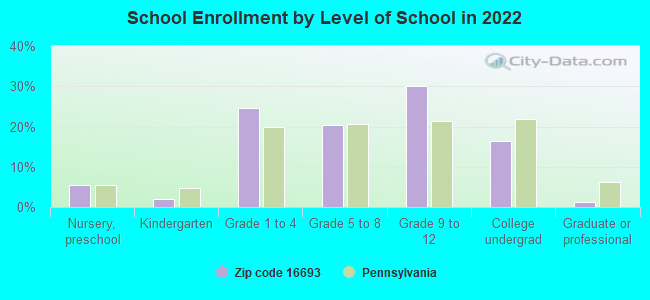
Private vs. public school enrollment:
Students in private schools in grades 1 to 8 (elementary and middle school): 68
Here:
20.8%
Pennsylvania:
15.7%
Students in private schools in grades 9 to 12 (high school): 9
Here:
4.5%
Pennsylvania:
13.4%
Students in private undergraduate colleges: 42
Here:
35.4%
Pennsylvania:
39.8%
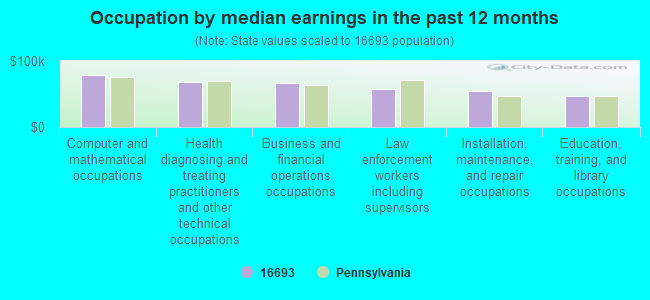
Occupation by median earnings in the past 12 months ($)
78,525Computer and mathematical occupations
67,907Health diagnosing and treating practitioners and other technical occupations
66,293Business and financial operations occupations
58,166Law enforcement workers including supervisors
54,502Installation, maintenance, and repair occupations
47,642Education, training, and library occupations
Companies with federal contracts located in this zip code:
WESTVACO CORPORATION (RR 866 in WILLIAMSBURG, PA)
$2,000 with U.S. Fish and Wildlife Service for Office Supplies. Taking place in MA. Signed on 1999-10-15. Completion date: 1999-11-15.
Top industries in this zip code by the number of employees in 2005:
Health Care and Social Assistance: Residential Mental Health and Substance Abuse Facilities (100-249 employees: 1 establishment)
Health Care and Social Assistance: Residential Mental Retardation Facilities (10-19: 1)
Accommodation and Food Services: Limited-Service Restaurants (10-19: 1)
Finance and Insurance: Commercial Banking (5-9: 2)
Other Services (except Public Administration): Religious Organizations (1-4: 6)
People in group quarters in 2010:
100 people in nursing facilities/skilled-nursing facilities
7 people in group homes intended for adults
3 people in workers' group living quarters and job corps centers
People in group quarters in 2000:
84 people in hospitals or wards for drug/alcohol abuse
16 people in other group homes
8 people in homes for the physically handicapped
3 people in homes for the mentally retarded
Fatal accident statistics in 2014:
Fatal accident count: 1
Vehicles involved in fatal accidents: 2
Fatal accidents caused by drunken drivers: 0
Fatalities: 1
Persons involved in fatal accidents: 2
Pedestrians involved in fatal accidents: 0
Fatal accident statistics in 2013:
Fatal accident count: 2
Vehicles involved in fatal accidents: 2
Fatal accidents caused by drunken drivers: 1
Fatalities: 2
Persons involved in fatal accidents: 2
Pedestrians involved in fatal accidents: 0
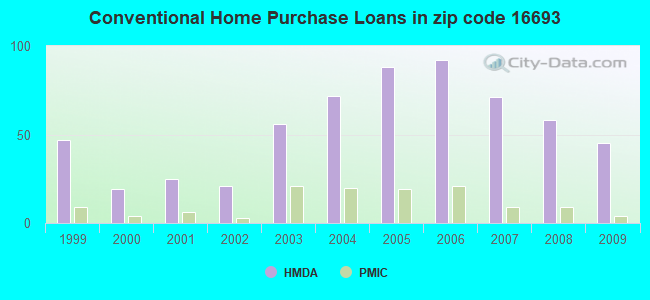
Home Mortgage Disclosure Act Aggregated Statistics For Year 2009 (Based on 2 full and 2 partial tracts)
A) FHA, FSA/RHS & VA Home Purchase Loans
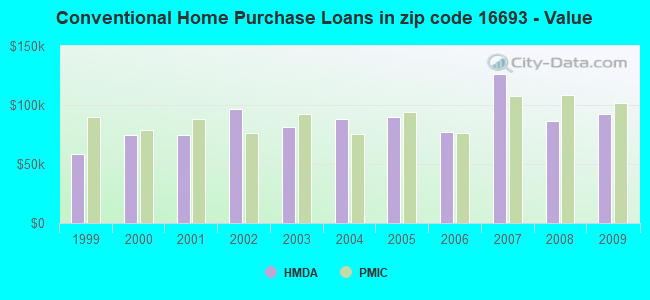
B) Conventional Home Purchase Loans
C) Refinancings
D) Home Improvement Loans
E) Loans on Dwellings For 5+ Families
F) Non-occupant Loans on < 5 Family Dwellings (A B C & D)
G) Loans On Manufactured Home Dwelling (A B C & D)
Number
Average Value
Number
Average Value
Number
Average Value
Number
Average Value
Number
Average Value
Number
Average Value
Number
Average Value
LOANS ORIGINATED
26
$116,580
45
$92,452
171
$106,726
86
$23,769
2
$106,425
14
$55,922
8
$83,912
APPLICATIONS APPROVED, NOT ACCEPTED
1
$74,300
1
$25,100
22
$77,370
2
$4,995
0
$0
0
$0
1
$25,100
APPLICATIONS DENIED
6
$87,187
14
$73,960
58
$99,015
25
$15,508
0
$0
4
$30,110
6
$78,603
APPLICATIONS WITHDRAWN
1
$54,220
6
$63,883
25
$123,272
4
$42,775
0
$0
0
$0
2
$39,960
FILES CLOSED FOR INCOMPLETENESS
0
$0
0
$0
5
$118,638
2
$93,905
0
$0
0
$0
0
$0
Aggregated Statistics For Year 2008 (Based on 2 full and 2 partial tracts)
A) FHA, FSA/RHS & VA Home Purchase Loans
B) Conventional Home Purchase Loans
C) Refinancings
D) Home Improvement Loans
F) Non-occupant Loans on < 5 Family Dwellings (A B C & D)
G) Loans On Manufactured Home Dwelling (A B C & D)
Number
Average Value
Number
Average Value
Number
Average Value
Number
Average Value
Number
Average Value
Number
Average Value
LOANS ORIGINATED
22
$88,425
58
$86,037
158
$77,368
96
$21,757
25
$99,528
30
$43,672
APPLICATIONS APPROVED, NOT ACCEPTED
3
$54,753
9
$74,348
11
$92,990
2
$4,995
1
$44,180
3
$65,657
APPLICATIONS DENIED
3
$66,683
22
$65,660
115
$92,816
54
$60,528
10
$80,719
34
$78,869
APPLICATIONS WITHDRAWN
0
$0
6
$49,718
15
$104,861
2
$25,100
1
$37,650
0
$0
FILES CLOSED FOR INCOMPLETENESS
1
$130,020
4
$116,882
6
$100,885
1
$37,150
0
$0
2
$93,905
Aggregated Statistics For Year 2007 (Based on 2 full and 2 partial tracts)
A) FHA, FSA/RHS & VA Home Purchase Loans
B) Conventional Home Purchase Loans
C) Refinancings
D) Home Improvement Loans
F) Non-occupant Loans on < 5 Family Dwellings (A B C & D)
G) Loans On Manufactured Home Dwelling (A B C & D)
Number
Average Value
Number
Average Value
Number
Average Value
Number
Average Value
Number
Average Value
Number
Average Value
LOANS ORIGINATED
4
$132,990
71
$126,341
150
$88,044
99
$34,170
10
$268,135
20
$59,796
APPLICATIONS APPROVED, NOT ACCEPTED
0
$0
13
$77,432
23
$116,719
9
$46,989
2
$67,930
6
$81,570
APPLICATIONS DENIED
3
$78,197
30
$78,614
135
$90,584
72
$47,487
2
$67,930
44
$77,553
APPLICATIONS WITHDRAWN
1
$96,380
6
$87,705
28
$90,219
8
$47,399
4
$74,080
1
$22,590
FILES CLOSED FOR INCOMPLETENESS
0
$0
3
$73,467
17
$127,277
0
$0
0
$0
0
$0
Aggregated Statistics For Year 2006 (Based on 2 full and 2 partial tracts)
A) FHA, FSA/RHS & VA Home Purchase Loans
B) Conventional Home Purchase Loans
C) Refinancings
D) Home Improvement Loans
E) Loans on Dwellings For 5+ Families
F) Non-occupant Loans on < 5 Family Dwellings (A B C & D)
G) Loans On Manufactured Home Dwelling (A B C & D)
Number
Average Value
Number
Average Value
Number
Average Value
Number
Average Value
Number
Average Value
Number
Average Value
Number
Average Value
LOANS ORIGINATED
8
$73,676
92
$77,121
181
$76,491
119
$30,024
1
$10,040
9
$82,202
20
$44,217
APPLICATIONS APPROVED, NOT ACCEPTED
0
$0
8
$73,894
16
$58,752
6
$20,850
0
$0
0
$0
6
$51,813
APPLICATIONS DENIED
2
$96,905
10
$54,811
157
$73,805
58
$25,312
0
$0
9
$65,047
24
$50,950
APPLICATIONS WITHDRAWN
2
$54,945
16
$105,878
48
$97,060
8
$39,268
0
$0
3
$45,097
1
$26,100
FILES CLOSED FOR INCOMPLETENESS
0
$0
3
$106,353
14
$89,886
0
$0
0
$0
0
$0
0
$0
Aggregated Statistics For Year 2005 (Based on 2 full and 2 partial tracts)
A) FHA, FSA/RHS & VA Home Purchase Loans
B) Conventional Home Purchase Loans
C) Refinancings
D) Home Improvement Loans
E) Loans on Dwellings For 5+ Families
F) Non-occupant Loans on < 5 Family Dwellings (A B C & D)
G) Loans On Manufactured Home Dwelling (A B C & D)
Number
Average Value
Number
Average Value
Number
Average Value
Number
Average Value
Number
Average Value
Number
Average Value
Number
Average Value
LOANS ORIGINATED
8
$98,241
88
$89,706
216
$66,926
84
$33,946
2
$104,895
16
$64,309
19
$58,274
APPLICATIONS APPROVED, NOT ACCEPTED
0
$0
6
$101,373
23
$84,455
6
$29,173
0
$0
0
$0
2
$35,390
APPLICATIONS DENIED
1
$39,160
26
$55,835
172
$76,937
66
$48,335
0
$0
6
$30,137
52
$66,255
APPLICATIONS WITHDRAWN
2
$70,930
5
$81,590
69
$77,938
10
$89,413
0
$0
1
$27,110
5
$80,194
FILES CLOSED FOR INCOMPLETENESS
0
$0
4
$85,415
15
$81,804
0
$0
0
$0
0
$0
0
$0
Aggregated Statistics For Year 2004 (Based on 2 full and 2 partial tracts)
A) FHA, FSA/RHS & VA Home Purchase Loans
B) Conventional Home Purchase Loans
C) Refinancings
D) Home Improvement Loans
E) Loans on Dwellings For 5+ Families
F) Non-occupant Loans on < 5 Family Dwellings (A B C & D)
G) Loans On Manufactured Home Dwelling (A B C & D)
Number
Average Value
Number
Average Value
Number
Average Value
Number
Average Value
Number
Average Value
Number
Average Value
Number
Average Value
LOANS ORIGINATED
11
$85,316
72
$88,119
161
$74,277
76
$39,893
2
$64,935
16
$120,616
21
$31,945
APPLICATIONS APPROVED, NOT ACCEPTED
0
$0
8
$64,539
45
$72,828
7
$22,783
0
$0
4
$34,742
4
$46,690
APPLICATIONS DENIED
3
$84,667
16
$117,406
148
$72,008
68
$33,815
0
$0
14
$32,426
22
$65,350
APPLICATIONS WITHDRAWN
0
$0
8
$75,464
69
$80,614
2
$80,320
0
$0
3
$69,283
6
$71,008
FILES CLOSED FOR INCOMPLETENESS
0
$0
2
$53,945
15
$81,469
0
$0
0
$0
4
$47,452
0
$0
Aggregated Statistics For Year 2003 (Based on 2 full and 2 partial tracts)
A) FHA, FSA/RHS & VA Home Purchase Loans
B) Conventional Home Purchase Loans
C) Refinancings
D) Home Improvement Loans
F) Non-occupant Loans on < 5 Family Dwellings (A B C & D)
Number
Average Value
Number
Average Value
Number
Average Value
Number
Average Value
Number
Average Value
LOANS ORIGINATED
14
$82,150
56
$80,941
321
$71,314
43
$28,761
11
$40,114
APPLICATIONS APPROVED, NOT ACCEPTED
0
$0
7
$82,183
46
$69,568
3
$20,080
1
$34,140
APPLICATIONS DENIED
2
$78,920
16
$49,357
134
$75,174
28
$17,668
4
$53,012
APPLICATIONS WITHDRAWN
0
$0
4
$62,688
92
$82,732
3
$10,843
2
$59,940
FILES CLOSED FOR INCOMPLETENESS
0
$0
4
$55,592
7
$75,671
1
$74,300
0
$0
Aggregated Statistics For Year 2002 (Based on 2 partial tracts)
A) FHA, FSA/RHS & VA Home Purchase Loans
B) Conventional Home Purchase Loans
C) Refinancings
D) Home Improvement Loans
F) Non-occupant Loans on < 5 Family Dwellings (A B C & D)
Number
Average Value
Number
Average Value
Number
Average Value
Number
Average Value
Number
Average Value
LOANS ORIGINATED
2
$59,235
21
$96,862
53
$178,977
8
$24,975
4
$55,095
APPLICATIONS APPROVED, NOT ACCEPTED
1
$39,660
7
$47,403
11
$57,136
1
$14,060
0
$0
APPLICATIONS DENIED
0
$0
5
$47,088
30
$233,296
3
$16,733
1
$29,120
APPLICATIONS WITHDRAWN
1
$35,640
3
$70,113
8
$5,555,446
0
$0
0
$0
FILES CLOSED FOR INCOMPLETENESS
0
$0
0
$0
4
$83,708
0
$0
0
$0
Aggregated Statistics For Year 2001 (Based on 2 partial tracts)
A) FHA, FSA/RHS & VA Home Purchase Loans
B) Conventional Home Purchase Loans
C) Refinancings
D) Home Improvement Loans
F) Non-occupant Loans on < 5 Family Dwellings (A B C & D)
Number
Average Value
Number
Average Value
Number
Average Value
Number
Average Value
Number
Average Value
LOANS ORIGINATED
2
$67,520
25
$74,938
38
$83,517
8
$17,632
3
$42,337
APPLICATIONS APPROVED, NOT ACCEPTED
1
$77,310
9
$52,208
7
$71,069
2
$14,560
0
$0
APPLICATIONS DENIED
0
$0
12
$46,352
21
$64,686
3
$6,190
1
$37,150
APPLICATIONS WITHDRAWN
0
$0
1
$25,100
10
$54,718
1
$3,510
0
$0
FILES CLOSED FOR INCOMPLETENESS
0
$0
1
$60,740
3
$73,293
1
$14,060
0
$0
Aggregated Statistics For Year 2000 (Based on 2 partial tracts)
A) FHA, FSA/RHS & VA Home Purchase Loans
B) Conventional Home Purchase Loans
C) Refinancings
D) Home Improvement Loans
F) Non-occupant Loans on < 5 Family Dwellings (A B C & D)
Number
Average Value
Number
Average Value
Number
Average Value
Number
Average Value
Number
Average Value
LOANS ORIGINATED
1
$53,210
19
$74,877
16
$62,781
13
$15,987
0
$0
APPLICATIONS APPROVED, NOT ACCEPTED
0
$0
7
$40,376
6
$50,702
1
$28,110
0
$0
APPLICATIONS DENIED
1
$61,240
13
$33,325
15
$56,927
8
$13,429
0
$0
APPLICATIONS WITHDRAWN
0
$0
4
$46,435
6
$56,642
1
$10,540
1
$25,100
FILES CLOSED FOR INCOMPLETENESS
0
$0
1
$37,650
2
$50,200
1
$7,530
0
$0
Aggregated Statistics For Year 1999 (Based on 1 full and 1 partial tracts)
A) FHA, FSA/RHS & VA Home Purchase Loans
B) Conventional Home Purchase Loans
C) Refinancings
D) Home Improvement Loans
F) Non-occupant Loans on < 5 Family Dwellings (A B C & D)

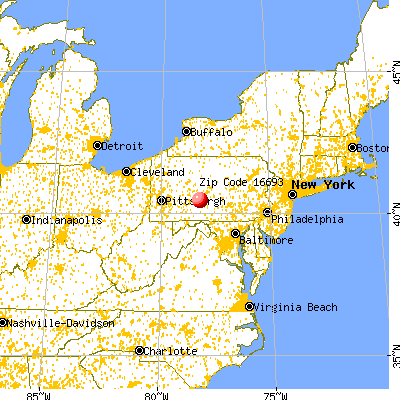


 Nearest zip codes: 16648, 16611, 16647, 16638, 16602, 16617.