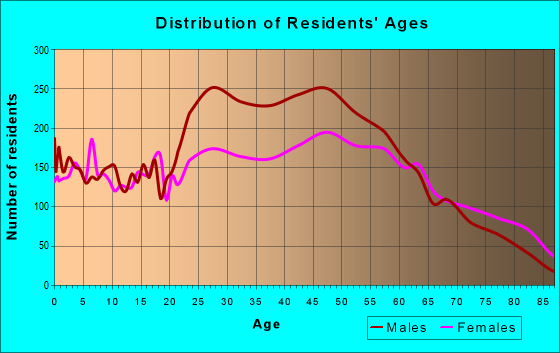
Estimated zip code population in 2022: 29,106 Zip code population in 2010: 26,617 Zip code population in 2000: 22,891
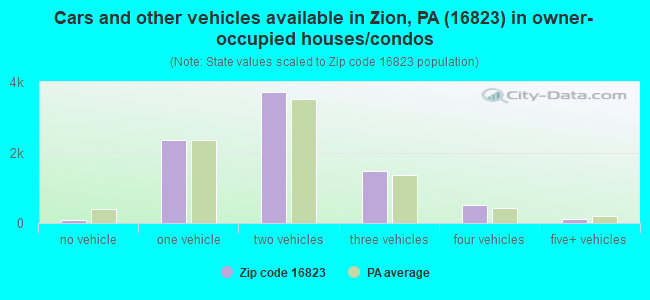
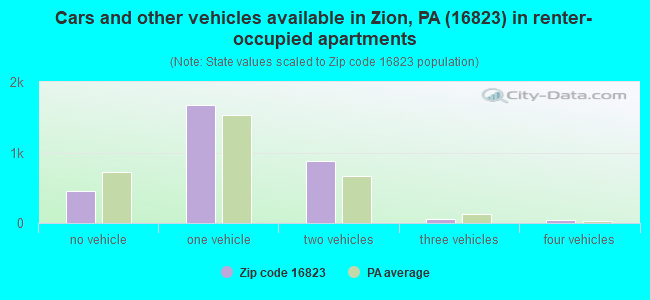
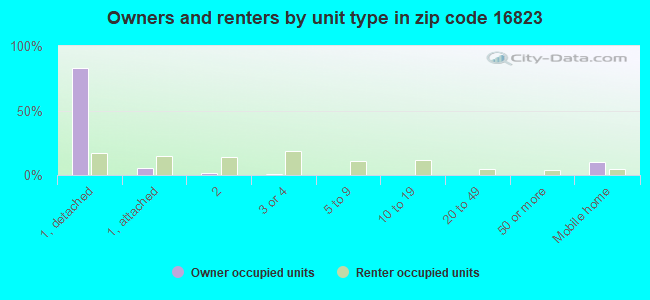
Houses and condos: 11,899 Renter-occupied apartments: 3,099
% of renters here:
27%
State:
31%
March 2022 cost of living index in zip code 16823: 97.4 (near average, U.S. average is 100)
Land area: 128.3 sq. mi. Water area: 0.1 sq. mi.
Population density: 227 people per square mile
(very low).
OSM Map
General Map
Google Map
MSN Map
OSM Map
General Map
Google Map
MSN Map
OSM Map
General Map
Google Map
MSN Map
OSM Map
General Map
Google Map
MSN Map
Please wait while loading the map...
Real estate property taxes paid for housing units in 2022:
This zip code:
1.1% ($2,789)
Pennsylvania:
1.3% ($3,094)
Median real estate property taxes paid for housing units with mortgages in 2022: $3,001 (1.1%) Median real estate property taxes paid for housing units with no mortgage in 2022: $2,514 (1.0%)
Averages for the 2020 tax year for zip code 16823, filed in 2021:
Average Adjusted Gross Income (AGI) in 2020: $62,002 (Individual Income Tax Returns)
Here:
$62,002
State:
$75,707
Salary/wage: $54,482 (reported on 79.4% of returns)
Here:
$54,482
State:
$62,806
(% of AGI for various income ranges: 1083.9% for AGIs below $25k, 3400.2% for AGIs $25k-50k, 5865.1% for AGIs $50k-75k, 8580.8% for AGIs $75k-100k, 15577.9% for AGIs $100k-200k, 49407.3% for AGIs over 200k)
Taxable interest for individuals: $912 (reported on 33.1% of returns)
This zip code:
$912
Pennsylvania:
$1,633
(% of AGI for various income ranges: 13.5% for AGIs below $25k, 18.0% for AGIs $25k-50k, 31.3% for AGIs $50k-75k, 63.9% for AGIs $75k-100k, 95.3% for AGIs $100k-200k, 613.6% for AGIs over 200k)
Ordinary dividends: $3,020 (reported on 21.0% of returns)
Here:
$3,020
State:
$7,382
(% of AGI for various income ranges: 27.8% for AGIs below $25k, 32.1% for AGIs $25k-50k, 81.1% for AGIs $50k-75k, 121.9% for AGIs $75k-100k, 195.3% for AGIs $100k-200k, 1391.8% for AGIs over 200k)
Net capital gain/loss in AGI: +$8,955 (reported on 17.4% of returns)
Here:
+$8,955
State:
+$23,522
(% of AGI for various income ranges: 11.6% for AGIs below $25k, 25.1% for AGIs $25k-50k, 60.8% for AGIs $50k-75k, 157.3% for AGIs $75k-100k, 397.7% for AGIs $100k-200k, 9990.9% for AGIs over 200k)
Profit/loss from business: +$12,129 (reported on 12.2% of returns)
Here:
+$12,129
State:
+$16,274
(% of AGI for various income ranges: 81.4% for AGIs below $25k, 105.5% for AGIs $25k-50k, 147.9% for AGIs $50k-75k, 238.6% for AGIs $75k-100k, 377.3% for AGIs $100k-200k, 4051.8% for AGIs over 200k)
Taxable individual retirement arrangement distribution: $14,653 (reported on 12.9% of returns)
16823:
$14,653
Pennsylvania:
$18,583
(% of AGI for various income ranges: 95.9% for AGIs below $25k, 125.8% for AGIs $25k-50k, 255.8% for AGIs $50k-75k, 326.9% for AGIs $75k-100k, 638.3% for AGIs $100k-200k, 2724.5% for AGIs over 200k)
Self-employed (Keogh) retirement plans: $16,400 (reported on 0.4% of returns)
16823:
$16,400
Pennsylvania:
$25,407
(% of AGI for various income ranges: 61.7% for AGIs $100k-200k)
Total itemized deductions: $27,463 (reported on 4.9% of returns)
Here:
$27,463
State:
$34,850
(% of AGI for various income ranges: 34.7% for AGIs below $25k, 67.1% for AGIs $25k-50k, 200.5% for AGIs $50k-75k, 276.4% for AGIs $75k-100k, 435.6% for AGIs $100k-200k, 2665.5% for AGIs over 200k)
Charity contributions: $9,184 (reported on 3.6% of returns)
Here:
$9,184
State:
$12,392
(% of AGI for various income ranges: 2.4% for AGIs below $25k, 13.8% for AGIs $25k-50k, 33.6% for AGIs $50k-75k, 36.6% for AGIs $75k-100k, 114.4% for AGIs $100k-200k, 1210.9% for AGIs over 200k)
Taxes paid: $7,319 (reported on 4.9% of returns)
16823:
$7,319
State:
$8,200
(% of AGI for various income ranges: 6.1% for AGIs below $25k, 12.0% for AGIs $25k-50k, 59.2% for AGIs $50k-75k, 80.1% for AGIs $75k-100k, 130.5% for AGIs $100k-200k, 603.6% for AGIs over 200k)
Earned income credit: $1,791 (reported on 9.4% of returns)
Here:
$1,791
State:
$2,100
(% of AGI for various income ranges: 49.3% for AGIs below $25k, 38.8% for AGIs $25k-50k)
Percentage of individuals using paid preparers for their 2020 taxes: 91.7%
Here:
92%
State:
92%
(% for various income ranges: 85.4% for AGIs below $25k, 95.3% for AGIs $25k-50k, 93.5% for AGIs $50k-75k, 94.4% for AGIs $75k-100k, 92.8% for AGIs $100k-200k, 97.0% for AGIs over 200k)
Averages for the 2012 tax year for zip code 16823, filed in 2013:
Average Adjusted Gross Income (AGI) in 2012: $48,986 (Individual Income Tax Returns)
Here:
$48,986
State:
$61,346
Salary/wage: $44,011 (reported on 84.7% of returns)
Here:
$44,011
State:
$51,902
(% of AGI for various income ranges: 72.1% for AGIs below $25k, 79.4% for AGIs $25k-50k, 78.9% for AGIs $50k-75k, 80.2% for AGIs $75k-100k, 77.7% for AGIs $100k-200k, 52.1% for AGIs over 200k)
Taxable interest for individuals: $821 (reported on 35.1% of returns)
This zip code:
$821
Pennsylvania:
$1,588
(% of AGI for various income ranges: 1.1% for AGIs below $25k, 0.4% for AGIs $25k-50k, 0.4% for AGIs $50k-75k, 0.5% for AGIs $75k-100k, 0.4% for AGIs $100k-200k, 1.6% for AGIs over 200k)
Ordinary dividends: $2,534 (reported on 20.2% of returns)
Here:
$2,534
State:
$5,827
(% of AGI for various income ranges: 1.3% for AGIs below $25k, 0.7% for AGIs $25k-50k, 0.6% for AGIs $50k-75k, 0.7% for AGIs $75k-100k, 1.1% for AGIs $100k-200k, 3.0% for AGIs over 200k)
Net capital gain/loss in AGI: +$5,466 (reported on 13.2% of returns)
Here:
+$5,466
State:
+$14,495
(% of AGI for various income ranges: 0.1% for AGIs below $25k, 0.2% for AGIs $25k-50k, 0.5% for AGIs $50k-75k, 0.9% for AGIs $75k-100k, 1.6% for AGIs $100k-200k, 9.0% for AGIs over 200k)
Profit/loss from business: +$9,878 (reported on 12.8% of returns)
Here:
+$9,878
State:
+$16,268
(% of AGI for various income ranges: 5.1% for AGIs below $25k, 2.3% for AGIs $25k-50k, 2.7% for AGIs $50k-75k, 1.6% for AGIs $75k-100k, 2.7% for AGIs $100k-200k, 2.2% for AGIs over 200k)
Taxable individual retirement arrangement distribution: $10,828 (reported on 11.6% of returns)
16823:
$10,828
Pennsylvania:
$14,550
(% of AGI for various income ranges: 4.2% for AGIs below $25k, 2.4% for AGIs $25k-50k, 2.3% for AGIs $50k-75k, 2.2% for AGIs $75k-100k, 3.3% for AGIs $100k-200k)
Self-employment retirement plans: $9,900 (reported on 0.3% of returns)
16823:
$9,900
Pennsylvania:
$20,922
(% of AGI for various income ranges: 0.1% for AGIs $25k-50k, 0.2% for AGIs $100k-200k)
Total itemized deductions: $18,686 (21% of AGI, reported on 28.9% of returns)
Here:
$18,686
State:
$23,538
Here:
20.8% of AGI
State:
18.4% of AGI
(% of AGI for various income ranges: 6.3% for AGIs below $25k, 7.5% for AGIs $25k-50k, 10.1% for AGIs $50k-75k, 12.3% for AGIs $75k-100k, 13.6% for AGIs $100k-200k, 15.7% for AGIs over 200k)
Charity contributions: $2,903 (reported on 21.7% of returns)
Here:
$2,903
State:
$4,025
(% of AGI for various income ranges: 0.5% for AGIs below $25k, 0.8% for AGIs $25k-50k, 1.0% for AGIs $50k-75k, 1.2% for AGIs $75k-100k, 1.7% for AGIs $100k-200k, 2.8% for AGIs over 200k)
Taxes paid: $7,534 (reported on 28.8% of returns)
16823:
$7,534
State:
$9,982
(% of AGI for various income ranges: 1.4% for AGIs below $25k, 2.4% for AGIs $25k-50k, 3.7% for AGIs $50k-75k, 5.1% for AGIs $75k-100k, 6.5% for AGIs $100k-200k, 6.0% for AGIs over 200k)
Earned income credit: $1,809 (reported on 12.6% of returns)
Here:
$1,809
State:
$2,106
(% of AGI for various income ranges: 3.6% for AGIs below $25k, 0.7% for AGIs $25k-50k)
Percentage of individuals using paid preparers for their 2012 taxes: 46.9%
Here:
47%
State:
53%
(% for various income ranges: 41.4% for AGIs below $25k, 45.3% for AGIs $25k-50k, 50.8% for AGIs $50k-75k, 52.3% for AGIs $75k-100k, 54.9% for AGIs $100k-200k, 85.7% for AGIs over 200k)
Averages for the 2004 tax year for zip code 16823, filed in 2005:
Average Adjusted Gross Income (AGI) in 2004: $38,262 (Individual Income Tax Returns)
Here:
$38,262
State:
$48,049
Salary/wage: $35,059 (reported on 85.9% of returns)
Here:
$35,059
State:
$42,646
(% of AGI for various income ranges: 138.1% for AGIs below $10k, 74.2% for AGIs $10k-25k, 81.0% for AGIs $25k-50k, 83.5% for AGIs $50k-75k, 83.1% for AGIs $75k-100k, 62.7% for AGIs over 100k)
Taxable interest for individuals: $1,013 (reported on 49.1% of returns)
This zip code:
$1,013
Pennsylvania:
$1,657
(% of AGI for various income ranges: 6.6% for AGIs below $10k, 2.2% for AGIs $10k-25k, 1.0% for AGIs $25k-50k, 0.8% for AGIs $50k-75k, 1.0% for AGIs $75k-100k, 1.7% for AGIs over 100k)
Taxable dividends: $1,817 (reported on 22.4% of returns)
Here:
$1,817
State:
$3,566
(% of AGI for various income ranges: 5.8% for AGIs below $10k, 1.2% for AGIs $10k-25k, 0.6% for AGIs $25k-50k, 0.6% for AGIs $50k-75k, 1.0% for AGIs $75k-100k, 2.0% for AGIs over 100k)
Net capital gain/loss: +$6,446 (reported on 16.7% of returns)
Here:
+$6,446
State:
+$9,716
(% of AGI for various income ranges: -1.8% for AGIs below $10k, 0.4% for AGIs $10k-25k, 0.7% for AGIs $25k-50k, 0.7% for AGIs $50k-75k, 1.2% for AGIs $75k-100k, 12.4% for AGIs over 100k)
Profit/loss from business: +$8,935 (reported on 14.0% of returns)
Here:
+$8,935
State:
+$14,267
(% of AGI for various income ranges: 7.4% for AGIs below $10k, 5.2% for AGIs $10k-25k, 2.7% for AGIs $25k-50k, 2.5% for AGIs $50k-75k, 2.5% for AGIs $75k-100k, 4.4% for AGIs over 100k)
IRA payment deduction: $2,621 (reported on 2.7% of returns)
16823:
$2,621
Pennsylvania:
$2,903
(% of AGI for various income ranges: 0.5% for AGIs below $10k, 0.3% for AGIs $10k-25k, 0.2% for AGIs $25k-50k, 0.2% for AGIs $50k-75k, 0.2% for AGIs $75k-100k, 0.1% for AGIs over 100k)
Self-employed pension: $7,702 (reported on 0.5% of returns)
Here:
$7,702
Pennsylvania:
$14,674
(% of AGI for various income ranges: 0.1% for AGIs $50k-75k, 0.1% for AGIs $75k-100k, 0.2% for AGIs over 100k)
Total itemized deductions: $15,169 (22% of AGI, reported on 28.3% of returns)
Here:
$15,169
State:
$18,804
Here:
21.9% of AGI
State:
19.5% of AGI
(% of AGI for various income ranges: 7.4% for AGIs below $10k, 6.0% for AGIs $10k-25k, 9.3% for AGIs $25k-50k, 11.8% for AGIs $50k-75k, 14.2% for AGIs $75k-100k, 13.7% for AGIs over 100k)
Charity contributions deductions: $2,077 (3% of AGI, reported on 23.3% of returns)
Here:
$2,077
State:
$3,337
Here:
2.9% of AGI
State:
3.3% of AGI
(% of AGI for various income ranges: 0.3% for AGIs below $10k, 0.6% for AGIs $10k-25k, 0.9% for AGIs $25k-50k, 1.1% for AGIs $50k-75k, 1.8% for AGIs $75k-100k, 2.0% for AGIs over 100k)
Total tax: $4,733 (reported on 76.9% of returns)
16823:
$4,733
State:
$8,008
(% of AGI for various income ranges: 3.1% for AGIs below $10k, 4.6% for AGIs $10k-25k, 7.2% for AGIs $25k-50k, 8.5% for AGIs $50k-75k, 10.3% for AGIs $75k-100k, 17.1% for AGIs over 100k)
Earned income credit: $1,524 (reported on 11.9% of returns)
Here:
$1,524
State:
$1,643
Percentage of individuals using paid preparers for their 2004 taxes: 53.1%
Here:
53%
State:
56%
(% for various income ranges: 44.5% for AGIs below $10k, 52.8% for AGIs $10k-25k, 55.2% for AGIs $25k-50k, 56.9% for AGIs $50k-75k, 56.4% for AGIs $75k-100k, 59.7% for AGIs over 100k)
Likely homosexual households (counted as self-reported same-sex unmarried-partner households)
Lesbian couples: 0.0% of all households
Gay men: 0.1% of all households
Household received Food Stamps/SNAP in the past 12 months: 1,039 Household did not receive Food Stamps/SNAP in the past 12 months: 10,292
Women who had a birth in the past 12 months: 289 (188 now married, 96 unmarried) Women who did not have a birth in the past 12 months: 4,774 (2,277 now married, 2,483 unmarried)
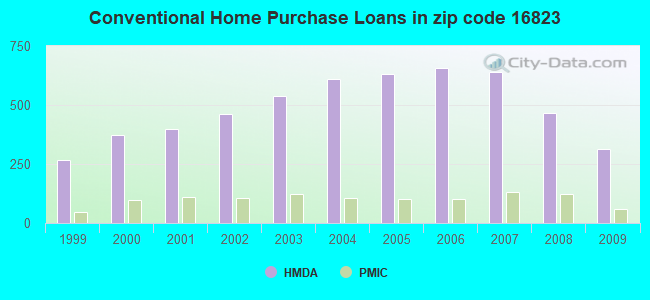
Housing units in zip code 16823 with a mortgage: 4,663 (865 second mortgage, 18 home equity loan, 647 both second mortgage and home equity loan) Houses without a mortgage: 325
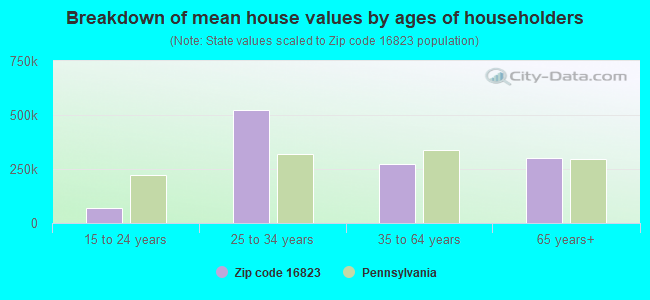
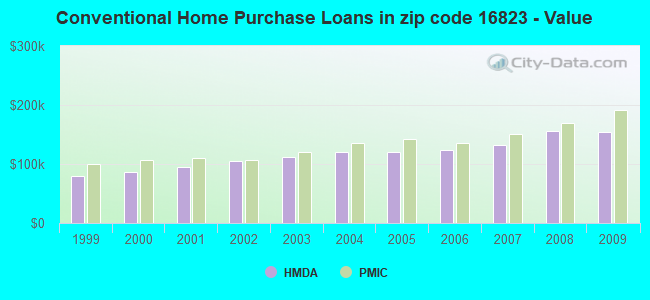
Median monthly owner costs for units with a mortgage: $1,521 Median monthly owner costs for units without a mortgage: $543
Residents with income below the poverty level in 2022:
This zip code:
6.4%
Whole state:
11.8%
Residents with income below 50% of the poverty level in 2022:
This zip code:
4.0%
Whole state:
6.1%
Median number of rooms in houses and condos:
Here:
6.4
State:
6.8
Median number of rooms in apartments:
Here:
4.5
State:
4.3
Notable locations in this zip code not listed on our city pages
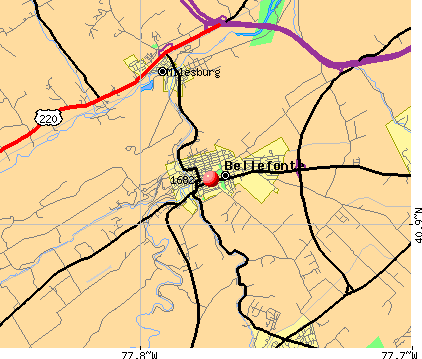
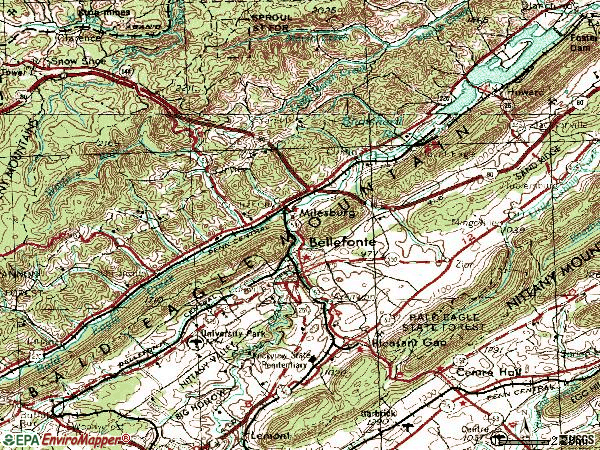
Notable locations in zip code 16823: Fish Research Station (A), Bellefonte Station (B), Chemical Station (C), Nittany Country Club (D), Rockview State Correctional Institution (E), Swanset Camp (F), Pleasant Gap State Fish Hatchery (G), HealthSouth Nittany Valley Rehabilitation Hospital (H), Logan Fire Company 1 (I), Undine Fire Company 2 (J), Pleasant Gap Fire Company 1 (K), Nittany Wildland Firefighters (L), Walker Township Volunteer Fire Company Station 2 (M), Citizens Hook and Ladder Company 1 (N). Display/hide their locations on the map
Churches in zip code 16823 include: Advent Church (A), Trinity Church (B), Forge Union Church (C), Buffalo Run Church (D). Display/hide their locations on the map
Cemeteries: Union Cemetery (1), Trcziyulny Cemetery (2), Benner Cemetery (3), Meyer Cemetery (4), Saint Johns Cemetery (5). Display/hide their locations on the map
Streams, rivers, and creeks: Brower Hollow Run (A), Holt Run (B), Wallace Run (C), Nittany Creek (D), Jonathan Run (E), North Fork Beech Creek (F), Logan Branch (G), Moose Run (H), Gap Run (I). Display/hide their locations on the map
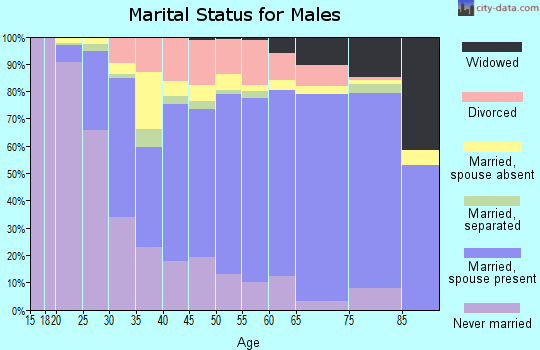
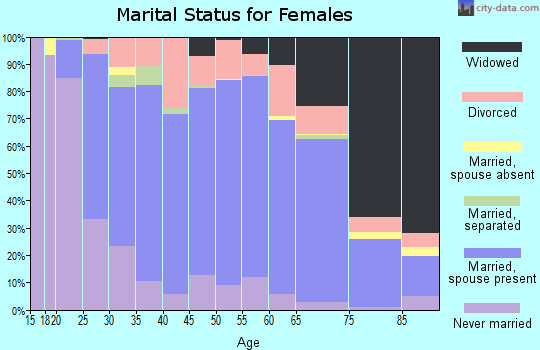
2,913 married couples with children.
843 single-parent households (81 men, 762 women).
94.4% of residents of 16823 zip code speak English at home.
2.2% of residents speak Spanish at home (63% very well, 12% well, 25% not well).
1.3% of residents speak other Indo-European language at home (68% very well, 25% well, 8% not well).
0.9% of residents speak Asian or Pacific Island language at home (8% very well, 87% well, 6% not well).
0.8% of residents speak other language at home (77% very well, 23% well).
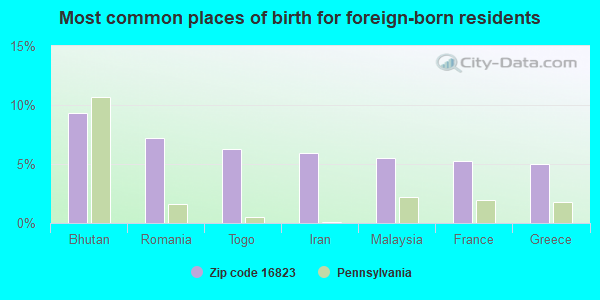
Foreign born population: 785 (2.7%) (71.6% of them are naturalized citizens)
This zip code:
2.7%
Whole state:
7.5%
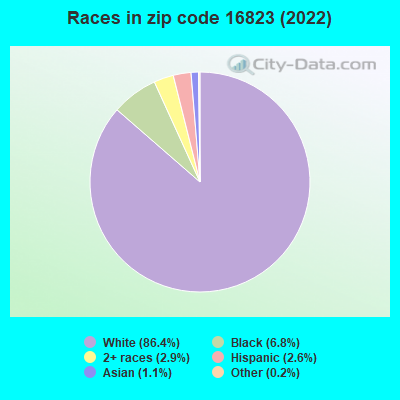
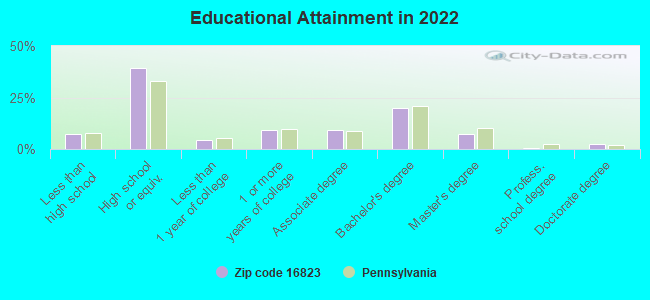
9%Bhutan
7%Romania
6%Togo
6%Iran
6%Malaysia
5%France
5%Greece
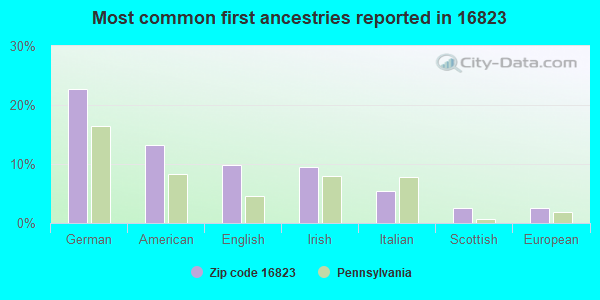
23%German
13%American
10%English
9%Irish
5%Italian
3%Scottish
3%European
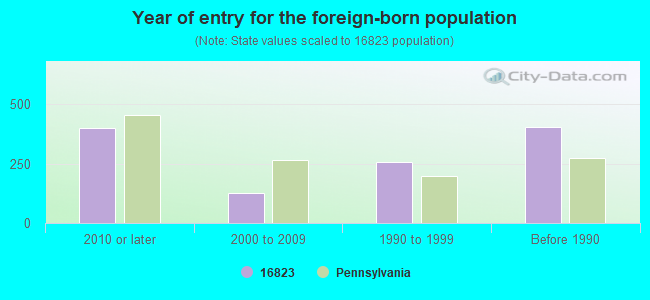
Year of entry for the foreign-born population
4012010 or later
1262000 to 2009
2581990 to 1999
403Before 1990
Major facilities with environmental interests located in this zip code:
BELLEFONTE BORO WATER SYS (236 W LAMB ST in BELLEFONTE, PA)
STATE MASTER (Pennsylvania database) - PWSID-4140075, DRINKING WATER PROGRAM, PWSID-4140100, STATE MASTER (Pennsylvania database) - PCS-PA0020486, National Pollutant Discharge Elimination System Permit National Pollutant Discharge Elimination System MAJOR (Tracking pollutant discharge elimination systems) - permit National Pollutant Discharge Elimination System NON-MAJOR (Tracking pollutant discharge elimination systems) - permit COMMUNITY WATER SYSTEM (SDWIS) - SDWIS-PA4140075 300, WATER TREATMENT PLANT, SDWIS-PA4140075 301, Business SIC classification: WATER SUPPLY; SEWERAGE SYSTEMS Organizations: BOROUGH OF BELLEFONTE (CONTACT/OWNER)
Alternative names: BELLEFONTE BORO SEW SYS
BLACK WALNUT BODY WORKS (228 NORTH WATER STREET in BELLEFONTE, PA)
STATE MASTER (Pennsylvania database) - RCRIS-528659, HAZARDOUS WASTE PROGRAM (Resource Conservation and Recovery Act (tracking hazardous waste)) Conditionally Exempt Small Quantity Generators, less than 100 kg/month of hazardous waste (Resource Conservation and Recovery Act (tracking hazardous waste)) - notification Organizations: OPERNAME (CONTACT/OPERATOR)
, DASH, ERIC (CONTACT/OWNER)
, DASH ERIC (CONTACT/OWNER)
BELLEFONTE KOA CAMPGROUND (2481 JACKSONVILLE ROAD in BELLEFONTE, PA)
STATE MASTER (Pennsylvania database) - PCS-PA0035815, National Pollutant Discharge Elimination System Permit, PWSID-4140808, DRINKING WATER PROGRAM National Pollutant Discharge Elimination System NON-MAJOR (Tracking pollutant discharge elimination systems) - permit Business SIC classification: SEWERAGE SYSTEMS; RECREATIONAL VEHICLE PARKS AND CAMPSITES Alternative names: DILLON, JOHN R & BARBARA L SAU
BALD EAGLE AREA JSHS ( in WINGATE, PA)
(National Center for Education Statistics) - STATE ID-1335 Organizations: BALD EAGLE AREA SD (SCHOOL DISTRICT)
BELLEFONTE AREA HS (830 E BISHOP ST in BELLEFONTE, PA)
(National Center for Education Statistics) - STATE ID-1343 Organizations: BELLEFONTE AREA SD (SCHOOL DISTRICT)
BELLEFONTE AREA MS ( in BELLEFONTE, PA)
(National Center for Education Statistics) - STATE ID-1342 Organizations: BELLEFONTE AREA SD (SCHOOL DISTRICT)
BELLEFONTE EL SCH ( in BELLEFONTE, PA)
(National Center for Education Statistics) - STATE ID-1341 Organizations: BELLEFONTE AREA SD (SCHOOL DISTRICT)
BENNER EL SCH ( in BELLEFONTE, PA)
(National Center for Education Statistics) - STATE ID-1339 Organizations: BELLEFONTE AREA SD (SCHOOL DISTRICT)
AGWAY INC PLEASANT GAP BLEND P (TOWNSHIP RD PO BOX 208 in PLEASANT GAP, PA)
(Integrated Compliance Information System) - ICIS-03-1987-0667, FORMAL ENFORCEMENT ACTION
BELLEFONTE, BORO OF (PLEASANT VIEW in BELLEFONTE, PA)
(Integrated Compliance Information System) - ICIS-03-1985-0831, FORMAL ENFORCEMENT ACTION, ICIS-03-1985-0719, ICIS-03-1984-0674, ICIS-03-1988-0433, Business SIC classification: SEWERAGE SYSTEMS
Housing units lacking complete plumbing facilities: 1.4% Housing units lacking complete kitchen facilities: 1.6%
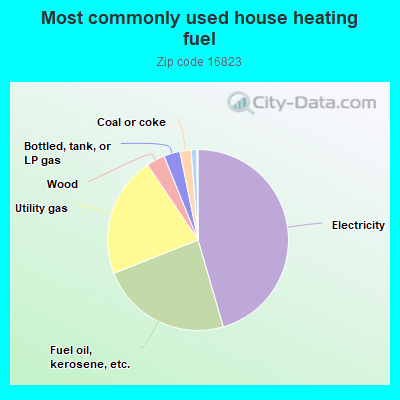
45.5%Electricity
23.5%Fuel oil, kerosene, etc.
21.6%Utility gas
3.3%Wood
2.9%Bottled, tank, or LP gas
2.0%Coal or coke
1.0%Other fuel
Population in 1990: 23,418.
Place of birth for U.S.-born residents:
This state: 22,295
Northeast: 1,880
Midwest: 1,039
South: 1,924
West: 697
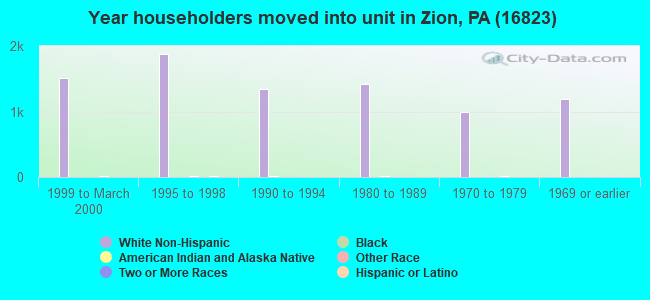
64% of the 16823 zip code residents lived in the same house 5 years ago. Out of people who lived in different houses, 63% lived in this county. Out of people who lived in different counties, 50% lived in Pennsylvania.
90% of the 16823 zip code residents lived in the same house 1 year ago. Out of people who lived in different houses, 52% moved from this county. Out of people who lived in different houses, 31% moved from different county within same state. Out of people who lived in different houses, 16% moved from different state.
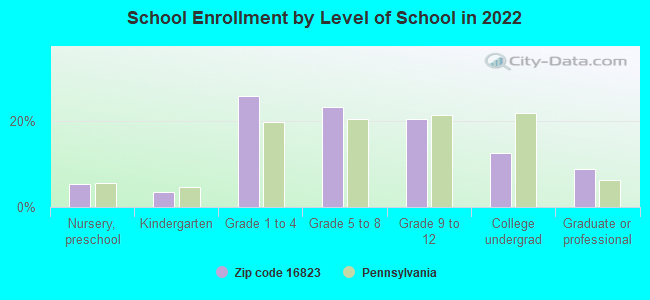
Private vs. public school enrollment:
Students in private schools in grades 1 to 8 (elementary and middle school): 272
Here:
13.2%
Pennsylvania:
15.7%
Students in private schools in grades 9 to 12 (high school): 132
Here:
15.5%
Pennsylvania:
13.4%
Students in private undergraduate colleges: 150
Here:
28.1%
Pennsylvania:
39.8%
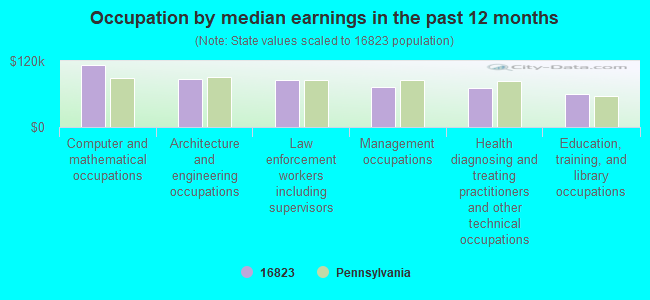
Occupation by median earnings in the past 12 months ($)
113,541Computer and mathematical occupations
86,712Architecture and engineering occupations
85,939Law enforcement workers including supervisors
72,777Management occupations
70,943Health diagnosing and treating practitioners and other technical occupations
59,692Education, training, and library occupations
Companies with federal contracts located in this zip code (BELLEFONTE, PA):
G M MCCROSSIN (886 BENNER PIKE) 400 employees, $24000000 revenue: $12,431,667 in 26 contractsfrom 1999 to 2004
Contracts for Maintenance, Repair or Alteration of Real Property -- Miscellaneous Buildings, Maintenance, Repair or Alteration of Real Property -- Penal Facilities by Bureau of Prisoners/Federal Prison System Signed by year:2000: $6,470,000; 2001: $45,000; 2002: $5,459,000; 2003: $373,343; 2004: $9,324; 2005: $0; 2006: $0.
Biggest contracts:
$6,320,000 with Bureau of Prisoners/Federal Prison System for Maintenance, Repair or Alteration of Real Property -- Miscellaneous Buildings. Signed on 2000-04-15. Completion date: 2001-04-15.
$5,459,000 with Bureau of Prisoners/Federal Prison System for Maintenance, Repair or Alteration of Real Property -- Penal Facilities. Signed on 2002-09-15. Completion date: 2003-09-15.
$318,356, same as above.Signed on 2003-06-15. Effective on 2003-06-25. Completion date: 2003-11-15.
$53,000 with Bureau of Prisoners/Federal Prison System for Maintenance, Repair or Alteration of Real Property -- Miscellaneous Buildings. Signed on 2000-04-15. Completion date: 2000-06-15.
PA WINDOW TINT, INC (1960 E COLLEGE AVE; small business)
$26,905 with Army for Installation of Equipment -- Miscellaneous. Signed on 2002-08-15. Completion date: 2002-10-15.
PENN BIO-ORGANICS (4079 AXEMAN RD; small business)
$26,000 with Animal and Plant Health Inspection Service (disused code) for Drugs and Biologicals. Taking place in TX. Signed on 2002-02-15. Completion date: 2002-03-15.
COLONY LODGE (3482 BENNER PIKE; small business)
$4,950 with Army for Lodging - Hotel/Motel. Signed on 2003-09-12. Completion date: 2003-09-14.
BOROUGH OF BELLEFONTE (236 W LAMB ST; small business) : $1,989 in 5 contractsfrom 2002 to 2005
Contracts for Trash/Garbage Collection Services - Including Portable Sanitation Services, Landscaping/Groundskeeping Services by Army Signed by year:2000: $0; 2001: $0; 2002: $435; 2003: $465; 2004: $495; 2005: $594; 2006: $0.
Biggest contracts:
$594 with Army for Trash/Garbage Collection Services - Including Portable Sanitation Services. Signed on 2005-12-07. Completion date: 2006-09-30.
$495 with Army for Landscaping/Groundskeeping Services. Signed on 2004-10-01. Completion date: 2005-09-30.
$465, same as above.Signed on 2003-10-01. Completion date: 2004-09-30.
$435, same as above.Signed on 2002-10-01. Completion date: 2003-09-30.
PLEASANT VALLEY AVIATION, INC (225 SNOWBIRD LN; small business) : $150 in 2 contractsin 2005
$3,969 with Navy for Other Education and Training Services. Signed on 2005-02-16. Completion date: 2005-08-31.
-$3,819, same as above.Signed on 2005-08-03. Completion date: 2005-08-31.
CENTRAL PENNSYVANIA INSTITUTE (540 N HARRISON RD; small business) : $29 in 2 contractsin 2003
$29 with Army for Education Services. Signed on 2003-06-20. Completion date: 2003-06-30.
$0, same as above.Signed on 2003-06-20. Completion date: 2003-06-30.
Top industries in this zip code by the number of employees in 2005:
2004 - 2018 National Fire Incident Reporting System (NFIRS) incidents
According to the data from the years 2004 - 2018 the average number of fire incidents per year is 73. The highest number of reported fires - 112 took place in 2016, and the least - 40 in 2014. The data has a dropping trend.
When looking into fire subcategories, the most reports belonged to: Structure Fires (52.2%), and Outside Fires (22.2%).
Fire incident types reported to NFIRS in Zip Code 16823


 Nearest zip codes: 16853, 16835, 16851, 16841, 16828, 16844.


 According to the data from the years 2004 - 2018 the average number of fire incidents per year is 73. The highest number of reported fires - 112 took place in 2016, and the least - 40 in 2014. The data has a dropping trend.
 When looking into fire subcategories, the most reports belonged to: Structure Fires (52.2%), and Outside Fires (22.2%).