Estimated zip code population in 2022: 11,120 Zip code population in 2010: 11,853 Zip code population in 2000: 11,507
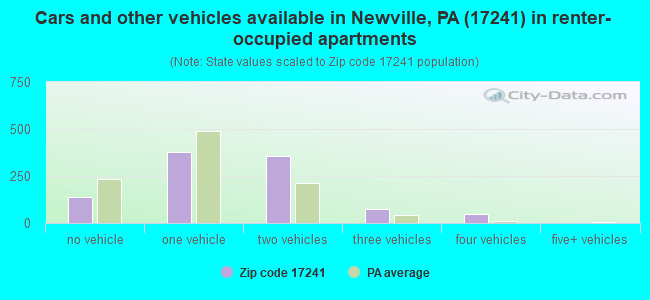
Houses and condos: 4,655 Renter-occupied apartments: 995
% of renters here:
23%
State:
31%
March 2022 cost of living index in zip code 17241: 92.6 (less than average, U.S. average is 100)
Land area: 112.2 sq. mi. Water area: 0.8 sq. mi.
Population density: 99 people per square mile
(very low).
OSM Map
General Map
Google Map
MSN Map
OSM Map
General Map
Google Map
MSN Map
OSM Map
General Map
Google Map
MSN Map
OSM Map
General Map
Google Map
MSN Map
Please wait while loading the map...
Real estate property taxes paid for housing units in 2022:
This zip code:
1.2% ($2,686)
Pennsylvania:
1.3% ($3,094)
Median real estate property taxes paid for housing units with mortgages in 2022: $2,882 (1.2%) Median real estate property taxes paid for housing units with no mortgage in 2022: $2,417 (1.3%)
Business Search- 14 Million verified businesses
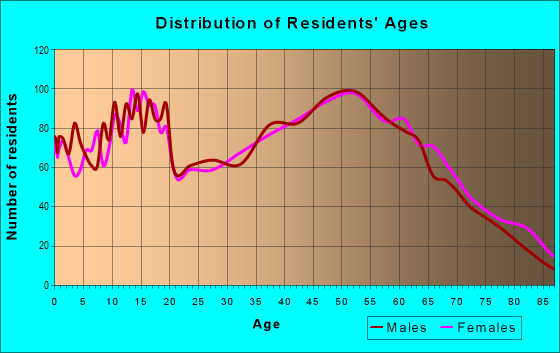
Males: 5,604
(50.4%)
Females: 5,515
(49.6%)
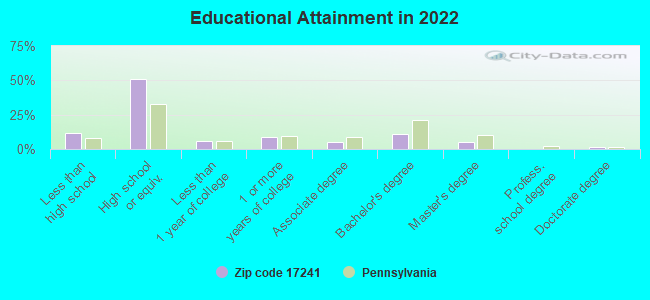
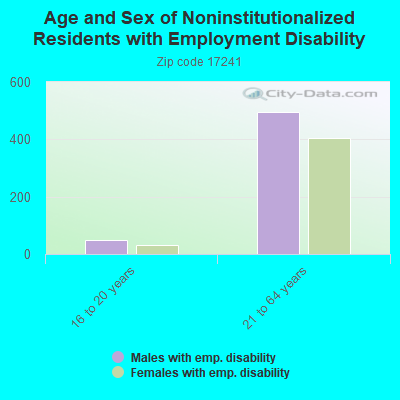
For population 25 years and over in 17241:
High school or higher: 87.0%
Bachelor's degree or higher: 17.2%
Graduate or professional degree: 6.6%
Unemployed: 2.4%
Mean travel time to work (commute): 28.3 minutes
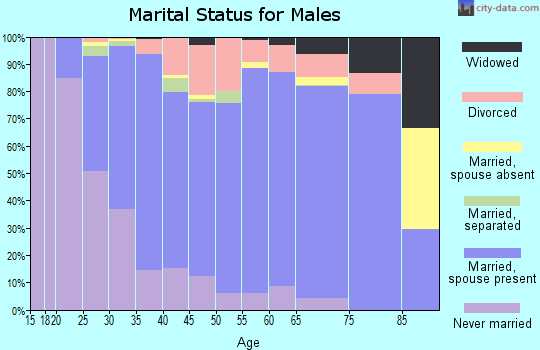
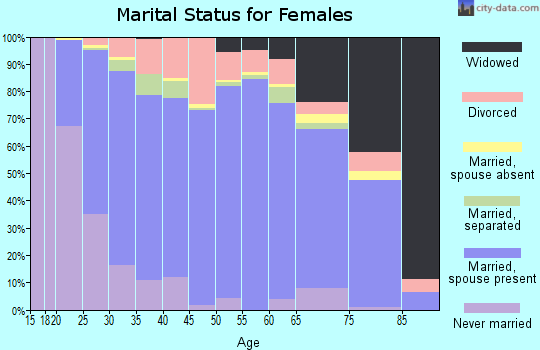
For population 15 years and over in 17241:
Never married: 25.2%
Now married: 58.3%
Separated: 1.6%
Widowed: 6.7%
Divorced: 8.3%
Zip code 17241 compared to state average:
Unemployed percentage below state average.
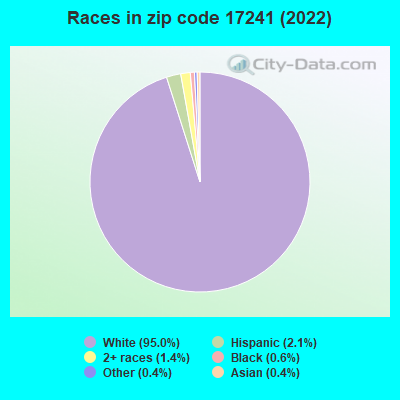
Black race population percentage significantly below state average.
Hispanic race population percentage significantly below state average.
Foreign-born population percentage significantly below state average.
Length of stay since moving in above state average.
Number of college students below state average.
Percentage of population with a bachelor's degree or higher below state average.
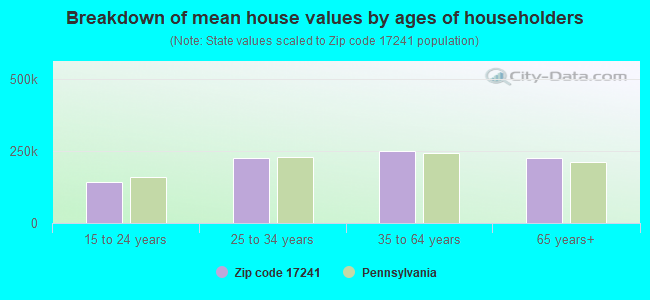
Estimated median house/condo value in 2022: $217,173
17241:
$217,173
Pennsylvania:
$245,500
According to our research of Pennsylvania and other state lists, there were 22 registered sex offenders living in 17241 zip code as of April 27, 2024. The ratio of all residents to sex offenders in zip code 17241 is 524 to 1. The ratio of registered sex offenders to all residents in this zip code is near the state average.
Median resident age:
This zip code:
42.0 years
Pennsylvania median age:
40.9 years
Average household size:
This zip code:
2.5 people
Pennsylvania:
2.4 people
Averages for the 2020 tax year for zip code 17241, filed in 2021:
Average Adjusted Gross Income (AGI) in 2020: $57,121 (Individual Income Tax Returns)
Here:
$57,121
State:
$75,707
Salary/wage: $48,512 (reported on 78.5% of returns)
Here:
$48,512
State:
$62,806
(% of AGI for various income ranges: 1148.0% for AGIs below $25k, 3606.3% for AGIs $25k-50k, 6582.0% for AGIs $50k-75k, 8804.4% for AGIs $75k-100k, 14990.4% for AGIs $100k-200k, 59200.0% for AGIs over 200k)
Taxable interest for individuals: $1,083 (reported on 31.4% of returns)
This zip code:
$1,083
Pennsylvania:
$1,633
(% of AGI for various income ranges: 25.4% for AGIs below $25k, 25.7% for AGIs $25k-50k, 48.5% for AGIs $50k-75k, 89.8% for AGIs $75k-100k, 88.5% for AGIs $100k-200k, 1250.0% for AGIs over 200k)
Ordinary dividends: $3,911 (reported on 16.5% of returns)
Here:
$3,911
State:
$7,382
(% of AGI for various income ranges: 25.6% for AGIs below $25k, 24.9% for AGIs $25k-50k, 89.4% for AGIs $50k-75k, 83.5% for AGIs $75k-100k, 181.7% for AGIs $100k-200k, 6920.0% for AGIs over 200k)
Net capital gain/loss in AGI: +$10,854 (reported on 13.8% of returns)
Here:
+$10,854
State:
+$23,522
(% of AGI for various income ranges: 11.9% for AGIs below $25k, 35.9% for AGIs $25k-50k, 80.0% for AGIs $50k-75k, 164.4% for AGIs $75k-100k, 516.2% for AGIs $100k-200k, 23235.0% for AGIs over 200k)
Profit/loss from business: +$15,810 (reported on 13.8% of returns)
Here:
+$15,810
State:
+$16,274
(% of AGI for various income ranges: 90.6% for AGIs below $25k, 148.0% for AGIs $25k-50k, 301.0% for AGIs $50k-75k, 384.2% for AGIs $75k-100k, 762.8% for AGIs $100k-200k, 13485.0% for AGIs over 200k)
Taxable individual retirement arrangement distribution: $14,745 (reported on 11.5% of returns)
17241:
$14,745
Pennsylvania:
$18,583
(% of AGI for various income ranges: 107.4% for AGIs below $25k, 105.6% for AGIs $25k-50k, 181.8% for AGIs $50k-75k, 357.1% for AGIs $75k-100k, 688.1% for AGIs $100k-200k, 7055.0% for AGIs over 200k)
Total itemized deductions: $32,592 (reported on 4.3% of returns)
Here:
$32,592
State:
$34,850
(% of AGI for various income ranges: 160.8% for AGIs $25k-50k, 126.3% for AGIs $50k-75k, 250.0% for AGIs $75k-100k, 641.1% for AGIs $100k-200k, 6850.0% for AGIs over 200k)
Charity contributions: $10,605 (reported on 3.2% of returns)
Here:
$10,605
State:
$12,392
(% of AGI for various income ranges: 13.5% for AGIs $25k-50k, 20.6% for AGIs $50k-75k, 52.9% for AGIs $75k-100k, 140.4% for AGIs $100k-200k, 3940.0% for AGIs over 200k)
Taxes paid: $6,908 (reported on 4.3% of returns)
17241:
$6,908
State:
$8,200
(% of AGI for various income ranges: 21.3% for AGIs $25k-50k, 37.0% for AGIs $50k-75k, 64.2% for AGIs $75k-100k, 141.1% for AGIs $100k-200k, 1490.0% for AGIs over 200k)
Earned income credit: $2,089 (reported on 12.0% of returns)
Here:
$2,089
State:
$2,100
(% of AGI for various income ranges: 71.9% for AGIs below $25k, 54.4% for AGIs $25k-50k, 2.5% for AGIs $50k-75k)
Percentage of individuals using paid preparers for their 2020 taxes: 93.3%
Here:
93%
State:
92%
(% for various income ranges: 91.0% for AGIs below $25k, 95.0% for AGIs $25k-50k, 93.3% for AGIs $50k-75k, 94.2% for AGIs $75k-100k, 93.7% for AGIs $100k-200k, 100.0% for AGIs over 200k)
Averages for the 2012 tax year for zip code 17241, filed in 2013:
Average Adjusted Gross Income (AGI) in 2012: $46,230 (Individual Income Tax Returns)
Here:
$46,230
State:
$61,346
Salary/wage: $40,186 (reported on 81.0% of returns)
Here:
$40,186
State:
$51,902
(% of AGI for various income ranges: 67.4% for AGIs below $25k, 76.6% for AGIs $25k-50k, 75.2% for AGIs $50k-75k, 73.4% for AGIs $75k-100k, 69.3% for AGIs $100k-200k, 33.1% for AGIs over 200k)
Taxable interest for individuals: $1,118 (reported on 36.2% of returns)
This zip code:
$1,118
Pennsylvania:
$1,588
(% of AGI for various income ranges: 1.6% for AGIs below $25k, 0.9% for AGIs $25k-50k, 0.7% for AGIs $50k-75k, 0.9% for AGIs $75k-100k, 0.6% for AGIs $100k-200k, 1.5% for AGIs over 200k)
Ordinary dividends: $3,089 (reported on 17.3% of returns)
Here:
$3,089
State:
$5,827
(% of AGI for various income ranges: 1.1% for AGIs below $25k, 0.6% for AGIs $25k-50k, 0.7% for AGIs $50k-75k, 0.8% for AGIs $75k-100k, 1.3% for AGIs $100k-200k, 5.0% for AGIs over 200k)
Net capital gain/loss in AGI: +$8,627 (reported on 13.1% of returns)
Here:
+$8,627
State:
+$14,495
(% of AGI for various income ranges: 0.4% for AGIs $25k-50k, 0.4% for AGIs $50k-75k, 1.8% for AGIs $75k-100k, 3.7% for AGIs $100k-200k, 17.1% for AGIs over 200k)
Profit/loss from business: +$12,564 (reported on 14.6% of returns)
Here:
+$12,564
State:
+$16,268
(% of AGI for various income ranges: 5.9% for AGIs below $25k, 3.3% for AGIs $25k-50k, 3.7% for AGIs $50k-75k, 2.1% for AGIs $75k-100k, 2.7% for AGIs $100k-200k, 13.8% for AGIs over 200k)
Taxable individual retirement arrangement distribution: $10,642 (reported on 12.2% of returns)
17241:
$10,642
Pennsylvania:
$14,550
(% of AGI for various income ranges: 4.9% for AGIs below $25k, 2.2% for AGIs $25k-50k, 2.6% for AGIs $50k-75k, 3.2% for AGIs $75k-100k, 3.2% for AGIs $100k-200k)
Total itemized deductions: $17,793 (22% of AGI, reported on 27.9% of returns)
Here:
$17,793
State:
$23,538
Here:
22.2% of AGI
State:
18.4% of AGI
(% of AGI for various income ranges: 7.8% for AGIs below $25k, 8.1% for AGIs $25k-50k, 10.9% for AGIs $50k-75k, 12.3% for AGIs $75k-100k, 12.9% for AGIs $100k-200k, 11.2% for AGIs over 200k)
Charity contributions: $3,627 (reported on 19.7% of returns)
Here:
$3,627
State:
$4,025
(% of AGI for various income ranges: 0.5% for AGIs below $25k, 0.8% for AGIs $25k-50k, 1.2% for AGIs $50k-75k, 1.9% for AGIs $75k-100k, 2.0% for AGIs $100k-200k, 4.1% for AGIs over 200k)
Taxes paid: $6,265 (reported on 27.7% of returns)
17241:
$6,265
State:
$9,982
(% of AGI for various income ranges: 1.7% for AGIs below $25k, 2.4% for AGIs $25k-50k, 3.5% for AGIs $50k-75k, 4.5% for AGIs $75k-100k, 5.3% for AGIs $100k-200k, 4.9% for AGIs over 200k)
Earned income credit: $1,972 (reported on 13.3% of returns)
Here:
$1,972
State:
$2,106
(% of AGI for various income ranges: 4.2% for AGIs below $25k, 0.8% for AGIs $25k-50k)
Percentage of individuals using paid preparers for their 2012 taxes: 54.3%
Here:
54%
State:
53%
(% for various income ranges: 48.2% for AGIs below $25k, 53.2% for AGIs $25k-50k, 59.4% for AGIs $50k-75k, 62.3% for AGIs $75k-100k, 60.9% for AGIs $100k-200k, 83.3% for AGIs over 200k)
Averages for the 2004 tax year for zip code 17241, filed in 2005:
Average Adjusted Gross Income (AGI) in 2004: $38,774 (Individual Income Tax Returns)
Here:
$38,774
State:
$48,049
Salary/wage: $35,498 (reported on 84.2% of returns)
Here:
$35,498
State:
$42,646
(% of AGI for various income ranges: 123.2% for AGIs below $10k, 74.5% for AGIs $10k-25k, 81.6% for AGIs $25k-50k, 84.2% for AGIs $50k-75k, 77.6% for AGIs $75k-100k, 51.8% for AGIs over 100k)
Taxable interest for individuals: $1,196 (reported on 49.4% of returns)
This zip code:
$1,196
Pennsylvania:
$1,657
(% of AGI for various income ranges: 7.9% for AGIs below $10k, 2.3% for AGIs $10k-25k, 1.4% for AGIs $25k-50k, 0.9% for AGIs $50k-75k, 1.7% for AGIs $75k-100k, 1.6% for AGIs over 100k)
Taxable dividends: $1,991 (reported on 20.1% of returns)
Here:
$1,991
State:
$3,566
(% of AGI for various income ranges: 4.2% for AGIs below $10k, 1.1% for AGIs $10k-25k, 0.8% for AGIs $25k-50k, 0.7% for AGIs $50k-75k, 1.4% for AGIs $75k-100k, 1.4% for AGIs over 100k)
Net capital gain/loss: +$10,291 (reported on 14.9% of returns)
Here:
+$10,291
State:
+$9,716
(% of AGI for various income ranges: 0.7% for AGIs below $10k, 0.9% for AGIs $10k-25k, 0.6% for AGIs $25k-50k, 0.8% for AGIs $50k-75k, 3.1% for AGIs $75k-100k, 19.4% for AGIs over 100k)
Profit/loss from business: +$8,422 (reported on 14.7% of returns)
Here:
+$8,422
State:
+$14,267
(% of AGI for various income ranges: 9.6% for AGIs below $10k, 5.2% for AGIs $10k-25k, 3.1% for AGIs $25k-50k, 2.3% for AGIs $50k-75k, 1.9% for AGIs $75k-100k, 4.5% for AGIs over 100k)
Profit/loss from farming: +$4,135 (reported on 4.0% of returns)
Here:
+$4,135
State:
+$274
(% of AGI for various income ranges: -2.0% for AGIs below $10k, 0.6% for AGIs $10k-25k, 0.7% for AGIs $25k-50k, 0.8% for AGIs $50k-75k, -0.3% for AGIs $75k-100k)
IRA payment deduction: $2,836 (reported on 2.4% of returns)
17241:
$2,836
Pennsylvania:
$2,903
(% of AGI for various income ranges: 0.2% for AGIs $10k-25k, 0.2% for AGIs $25k-50k, 0.2% for AGIs $50k-75k, 0.2% for AGIs $75k-100k)
Self-employed pension: $7,389 (reported on 0.3% of returns)
Here:
$7,389
Pennsylvania:
$14,674
Total itemized deductions: $14,846 (23% of AGI, reported on 28.0% of returns)
Here:
$14,846
State:
$18,804
Here:
22.9% of AGI
State:
19.5% of AGI
(% of AGI for various income ranges: 11.4% for AGIs below $10k, 7.3% for AGIs $10k-25k, 9.4% for AGIs $25k-50k, 11.5% for AGIs $50k-75k, 13.6% for AGIs $75k-100k, 10.8% for AGIs over 100k)
Charity contributions deductions: $2,677 (4% of AGI, reported on 22.0% of returns)
Here:
$2,677
State:
$3,337
Here:
3.9% of AGI
State:
3.3% of AGI
(% of AGI for various income ranges: 0.9% for AGIs below $10k, 0.7% for AGIs $10k-25k, 1.1% for AGIs $25k-50k, 1.5% for AGIs $50k-75k, 2.3% for AGIs $75k-100k, 2.1% for AGIs over 100k)
Total tax: $4,442 (reported on 77.2% of returns)
17241:
$4,442
State:
$8,008
(% of AGI for various income ranges: 4.5% for AGIs below $10k, 4.6% for AGIs $10k-25k, 7.0% for AGIs $25k-50k, 8.3% for AGIs $50k-75k, 10.0% for AGIs $75k-100k, 15.4% for AGIs over 100k)
Earned income credit: $1,571 (reported on 10.7% of returns)
Here:
$1,571
State:
$1,643
Percentage of individuals using paid preparers for their 2004 taxes: 58.7%
Here:
59%
State:
56%
(% for various income ranges: 52.7% for AGIs below $10k, 60.3% for AGIs $10k-25k, 58.6% for AGIs $25k-50k, 59.7% for AGIs $50k-75k, 63.0% for AGIs $75k-100k, 66.8% for AGIs over 100k)
Household received Food Stamps/SNAP in the past 12 months: 359 Household did not receive Food Stamps/SNAP in the past 12 months: 4,000
Women who had a birth in the past 12 months: 185 (173 now married, 20 unmarried) Women who did not have a birth in the past 12 months: 2,132 (1,020 now married, 1,106 unmarried)
Housing units in zip code 17241 with a mortgage: 1,944 (314 second mortgage, 18 home equity loan, 280 both second mortgage and home equity loan) Houses without a mortgage: 153
Median monthly owner costs for units with a mortgage: $1,472 Median monthly owner costs for units without a mortgage: $552
Residents with income below the poverty level in 2022:
This zip code:
8.7%
Whole state:
11.8%
Residents with income below 50% of the poverty level in 2022:
This zip code:
2.8%
Whole state:
6.1%
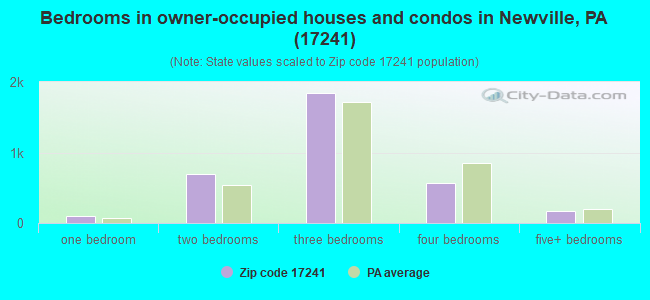
Median number of rooms in houses and condos:
Here:
6.4
State:
6.8
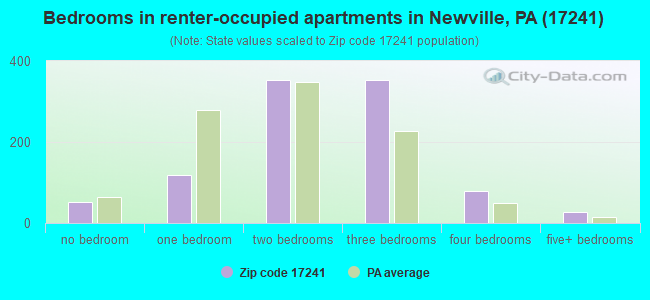
Median number of rooms in apartments:
Here:
5.3
State:
4.3
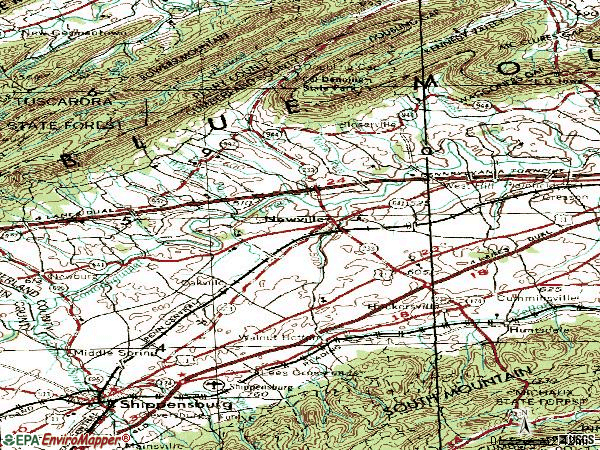
Notable locations in this zip code not listed on our city pages
Notable locations in zip code 17241: Doners Station (A), Camp Michaux (B), Center (C), Penn Township Volunteer Fire Department Station 50 (D), Friendship Hose Company 1 Station 47 (E), Upper Frankford Township Volunteer Fire Company Station 48 (F). Display/hide their locations on the map
Churches in zip code 17241 include: McClures Gap Church (A), Doubling Gap Church (B), Saint Eleanor Regina (C), Saint Peters Upper Frankford Church (D), South Fairview Church (E), Zion Church (F), Pentecostal Church (G), Bethany Church (H). Display/hide their locations on the map
Cemeteries: Prospect Cemetery (1), Longsdorfs Cemetery (2), Newville Cemetery (3), McClures Gap Cemetery (4), John Graham Memorial Cemetery (5). Display/hide their locations on the map
Streams, rivers, and creeks: Rock Run (A), Three Square Hollow Run (B), Green Spring Creek (C), Doubling Gap Creek (D), Center Creek (E), Bulls Head Branch (F), Whisky Run (G), Brandy Run (H), Big Spring Creek (I). Display/hide their locations on the map
1,699 married couples with children.
605 single-parent households (191 men, 414 women).
93.0% of residents of 17241 zip code speak English at home.
1.0% of residents speak Spanish at home (62% very well, 11% well, 27% not well).
5.1% of residents speak other Indo-European language at home (89% very well, 10% well, 1% not well).
0.1% of residents speak Asian or Pacific Island language at home (21% very well, 79% not at all).
0.1% of residents speak other language at home (100% very well).
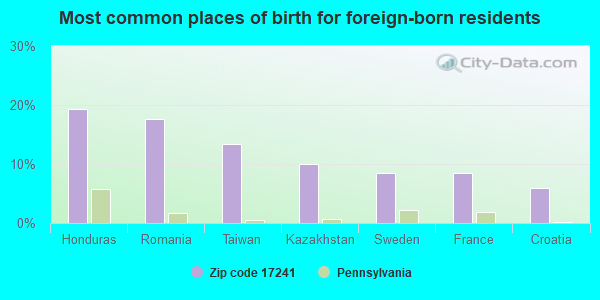
Foreign born population: 119 (1.1%) (48.0% of them are naturalized citizens)
This zip code:
1.1%
Whole state:
7.5%
19%Honduras
18%Romania
13%Taiwan
10%Kazakhstan
8%Sweden
8%France
6%Croatia
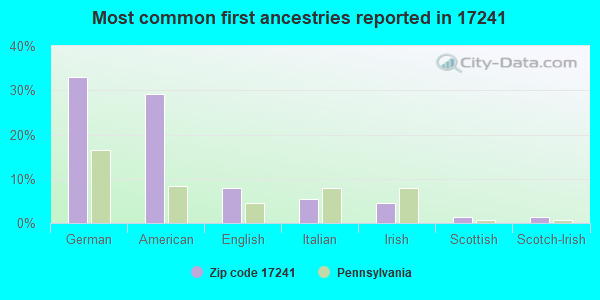
33%German
29%American
8%English
5%Italian
4%Irish
1%Scottish
1%Scotch-Irish
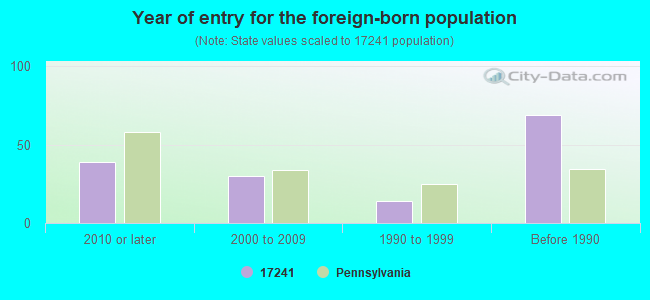
Year of entry for the foreign-born population
392010 or later
302000 to 2009
141990 to 1999
69Before 1990
Facilities with environmental interests located in this zip code:
BIG SPRINGS HIGH SCHOOL (RR 2 BOX 98 in NEWVILLE, PA)
(Integrated Compliance Information System) - ICIS-03-2005-0033, FORMAL ENFORCEMENT ACTION, ENFORCEMENT/COMPLIANCE ACTIVITY (Integrated Compliance Information System) - ICIS-03-2005-0033, FORMAL ENFORCEMENT ACTION, ENFORCEMENT/COMPLIANCE ACTIVITY COMPLIANCE ACTIVITY (Tracking inspections of insecticide, fungicide, and rodenticide, and toxic substances) Business SIC classification: HEAVY CONSTRUCTION; ELEMENTARY AND SECONDARY SCHOOLS Business NAICS classification: ALL OTHER MISCELLANEOUS SCHOOLS AND INSTRUCTION.
B & W NEWVILLE WATERCRESS FARM (NEWVILLE FACILITY in NEWVILLE, PA)
STATE MASTER (Pennsylvania database) - PCS-PA0080641, National Pollutant Discharge Elimination System Permit National Pollutant Discharge Elimination System NON-MAJOR (Tracking pollutant discharge elimination systems) - permit Business SIC classification: VEGETABLES AND MELONS; PACKING AND CRATING Alternative names: B & W QUALITY GROWERS INC, B & W QUALITY GROWERS INC - NE, B & W QUALTIY GROWERS INC
BARRICK TIRE SALES (455 CENTER ROAD in NEWVILLE, PA)
AIR MINOR (AIRS/AFS) (Integrated Compliance Information System) - ICIS-03-1997-0329, FORMAL ENFORCEMENT ACTION Business SIC classification: GENERAL FARMS, PRIMARILY CROP; TIRES AND TUBES; AUTO AND HOME SUPPLY STORES; AUTOMOTIVE REPAIR SHOPS
BEASTON RES (1042 GRAHAMS WOODS RD in NEWVILLE, PA)
STATE MASTER (Pennsylvania database) - PCS-PAG043596, National Pollutant Discharge Elimination System Permit National Pollutant Discharge Elimination System NON-MAJOR (Tracking pollutant discharge elimination systems) - permit Business SIC classification: OPERATORS OF DWELLINGS OTHER THAN APARTMENT BUILDINGS Alternative names: BEASTON, KENNETH, BEASTON RESIDENCE, KENNETH BEASTON
BIG SPRING HIGH SCHOOL (45 MOUNT ROCK RD in NEWVILLE, PA)
COMPLIANCE ACTIVITY (Tracking inspections of insecticide, fungicide, and rodenticide, and toxic substances) (National Center for Education Statistics) - STATE ID-1677 Business SIC classification: ELEMENTARY AND SECONDARY SCHOOLS Organizations: BIG SPRING SD (SCHOOL DISTRICT)
Alternative names: BIG SPRING HS, BIG SPRINGS HIGH SCHOOL
BIG SPRING MS (47 MOUNT ROCK RD in NEWVILLE, PA)
(National Center for Education Statistics) - STATE ID-6326 Organizations: BIG SPRING SD (SCHOOL DISTRICT)
B & W QUALITY GROWERS INC (BULLHEAD RD in NEWVILLE, PA)
National Pollutant Discharge Elimination System NON-MAJOR (Tracking pollutant discharge elimination systems) - permit Business SIC classification: VEGETABLES AND MELONS Alternative names: B & W QUALITY GROWERS INC - NE
BIG SPRING FISH & GAME (STEELSTOWN RD in NEWVILLE, PA)
National Pollutant Discharge Elimination System NON-MAJOR (Tracking pollutant discharge elimination systems) - permit Business SIC classification: AMUSEMENT AND RECREATION SERVICES
BIG SPRING S.D. (MOUNT ROCK RD in NEWVILLE, PA)
ENFORCEMENT/COMPLIANCE ACTIVITY (Integrated Compliance Information System) COMPLIANCE ACTIVITY (Tracking inspections of insecticide, fungicide, and rodenticide, and toxic substances)
Housing units lacking complete plumbing facilities: 0.4% Housing units lacking complete kitchen facilities: 1.2%
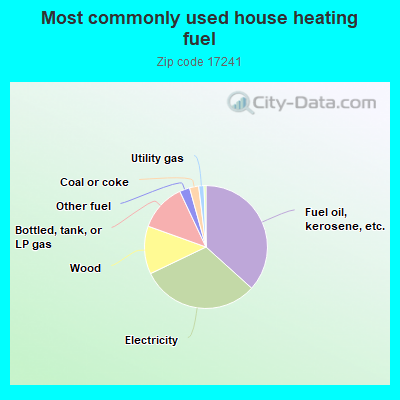
36.7%Fuel oil, kerosene, etc.
31.2%Electricity
12.6%Wood
12.5%Bottled, tank, or LP gas
2.7%Other fuel
2.4%Coal or coke
1.4%Utility gas
0.5%No fuel used
Population in 1990: 9,740. Population change in the 1990s: +1,767 (+18.1%).
Place of birth for U.S.-born residents:
This state: 9,305
Northeast: 515
Midwest: 277
South: 652
West: 151
68% of the 17241 zip code residents lived in the same house 5 years ago. Out of people who lived in different houses, 65% lived in this county. Out of people who lived in different counties, 50% lived in Pennsylvania.
92% of the 17241 zip code residents lived in the same house 1 year ago. Out of people who lived in different houses, 82% moved from this county. Out of people who lived in different houses, 6% moved from different county within same state. Out of people who lived in different houses, 11% moved from different state.
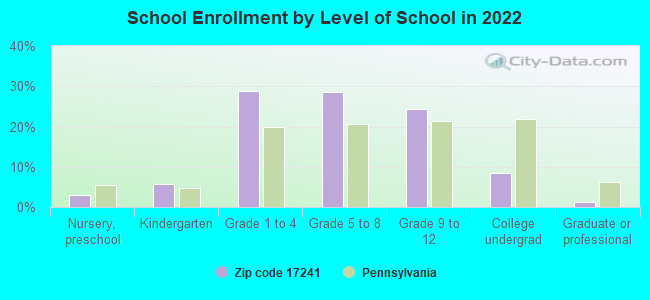
Private vs. public school enrollment:
Students in private schools in grades 1 to 8 (elementary and middle school): 239
Here:
22.1%
Pennsylvania:
15.7%
Students in private schools in grades 9 to 12 (high school): 63
Here:
14.0%
Pennsylvania:
13.4%
Students in private undergraduate colleges: 26
Here:
16.2%
Pennsylvania:
39.8%
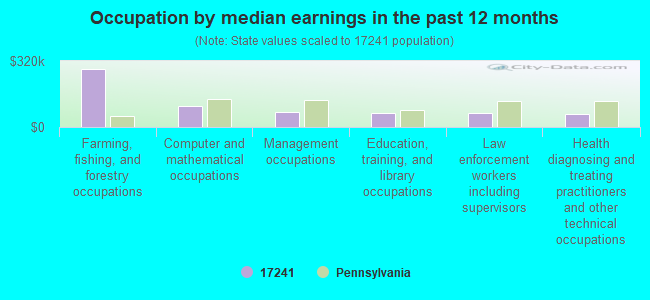
Occupation by median earnings in the past 12 months ($)
283,109Farming, fishing, and forestry occupations
101,959Computer and mathematical occupations
73,120Management occupations
66,644Education, training, and library occupations
65,477Law enforcement workers including supervisors
62,222Health diagnosing and treating practitioners and other technical occupations
Companies with federal contracts located in this zip code:
A & B FIRE PROTECTION, INC (1370 CENTERVILLE RD in NEWVILLE, PA; small business) : $651,116 in 18 contractsfrom 2001 to 2006
Contracts for Maintenance, Repair and Rebuilding of Equipment -- Fire Control Equipment, Maintenance, Repair and Rebuilding of Equipment -- Maintenance and Repair Shop Equipment by Army Signed by year:2000: $0; 2001: $96,992; 2002: $201,059; 2003: $99,632; 2004: $99,351; 2005: $141,622; 2006: $12,460.
Biggest contracts:
$111,142 with Army for Maintenance, Repair and Rebuilding of Equipment -- Fire Control Equipment. Signed on 2005-06-06. Completion date: 2006-08-06.
$105,949, same as above.Signed on 2004-07-28. Completion date: 2006-08-06.
$104,739, same as above.Signed on 2003-02-07. Completion date: 2006-08-06.
$100,530, same as above.Signed on 2002-07-15. Completion date: 2003-08-06.
ZANE R HIGHLANDS INC (344 GREENSPRING RD in NEWVILLE, PA; small business) : $69,017 in 7 contractsfrom 2003 to 2005
Contracts for Maintenance, Repair and Rebuilding of Equipment -- Ground Effect Vehicles, Motor Vehicles, Trailers, and Cycles, Maintenance, Repair and Rebuilding of Equipment -- Tires and Tubes, Engine Electrical System Components, Nonaircraft, Miscellaneous Items by Army, Defense Logistics Agency Signed by year:2000: $0; 2001: $0; 2002: $0; 2003: $43,200; 2004: $28,400; 2005: -$2,583; 2006: $0.
Biggest contracts:
$43,200 with Army for Maintenance, Repair and Rebuilding of Equipment -- Ground Effect Vehicles, Motor Vehicles, Trailers, and Cycles. Signed on 2003-07-31. Completion date: 2004-05-31.
$28,400 with Army for Maintenance, Repair and Rebuilding of Equipment -- Tires and Tubes. Signed on 2004-04-14. Completion date: 2005-04-15.
$5,758 with Defense Logistics Agency for Engine Electrical System Components, Nonaircraft. Signed on 2005-11-21. Completion date: 2005-12-02.
$2,725 with Defense Logistics Agency for Miscellaneous Items. Signed on 2005-06-14. Completion date: 2005-06-23.
SHEARS, DARRELL & ANGELA (52-A S HIGH ST in NEWVILLE, PA; small business) : $9,566 in 4 contractsin 2005
$3,885 with Army for Arts/Graphics Services. Signed on 2005-04-05. Completion date: 2005-08-15.
$2,892, same as above.Signed on 2005-07-15. Completion date: 2005-08-15.
$2,445, same as above.Signed on 2005-07-27. Completion date: 2005-08-15.
$344, same as above.Signed on 2005-09-28. Completion date: 2005-08-15.
Top industries in this zip code by the number of employees in 2005:
Health Care and Social Assistance: Continuing Care Retirement Communities (100-249 employees: 1 establishment)
Other Services (except Public Administration): Religious Organizations (10-19: 1, 5-9: 3, 1-4: 14)
Construction: Site Preparation Contractors (20-49: 1, 1-4: 2)
Health Care and Social Assistance: Offices of Physicians (except Mental Health Specialists) (20-49: 1)
Other Services (except Public Administration): Civic and Social Organizations (10-19: 2, 1-4: 1)
People in group quarters in 2010:
73 people in nursing facilities/skilled-nursing facilities
8 people in workers' group living quarters and job corps centers
People in group quarters in 2000:
164 people in nursing homes
Fatal accident statistics in 2014:
Fatal accident count: 3
Vehicles involved in fatal accidents: 6
Fatal accidents caused by drunken drivers: 0
Fatalities: 3
Persons involved in fatal accidents: 11
Pedestrians involved in fatal accidents: 0
Fatal accident statistics in 2013:
Fatal accident count: 1
Vehicles involved in fatal accidents: 2
Fatal accidents caused by drunken drivers: 2
Fatalities: 1
Persons involved in fatal accidents: 2
Pedestrians involved in fatal accidents: 0
Home Mortgage Disclosure Act Aggregated Statistics For Year 2009 (Based on 1 full and 6 partial tracts)
A) FHA, FSA/RHS & VA Home Purchase Loans
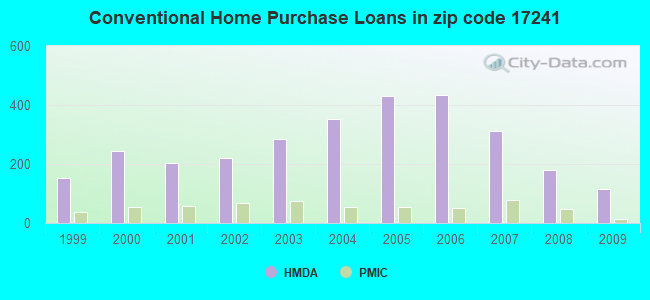
B) Conventional Home Purchase Loans
C) Refinancings
D) Home Improvement Loans
F) Non-occupant Loans on < 5 Family Dwellings (A B C & D)
G) Loans On Manufactured Home Dwelling (A B C & D)
Number
Average Value
Number
Average Value
Number
Average Value
Number
Average Value
Number
Average Value
Number
Average Value
LOANS ORIGINATED
69
$174,020
115
$164,488
701
$151,841
103
$48,540
26
$154,519
27
$79,541
APPLICATIONS APPROVED, NOT ACCEPTED
2
$78,105
12
$97,040
44
$144,535
6
$33,275
1
$96,130
6
$63,948
APPLICATIONS DENIED
6
$178,453
37
$83,901
228
$164,343
43
$43,122
3
$93,487
41
$54,886
APPLICATIONS WITHDRAWN
6
$123,327
12
$128,213
153
$157,576
5
$83,670
1
$96,130
8
$79,092
FILES CLOSED FOR INCOMPLETENESS
2
$131,105
2
$30,485
17
$128,944
2
$62,145
0
$0
2
$14,545
Aggregated Statistics For Year 2008 (Based on 1 full and 6 partial tracts)
A) FHA, FSA/RHS & VA Home Purchase Loans
B) Conventional Home Purchase Loans
C) Refinancings
D) Home Improvement Loans
E) Loans on Dwellings For 5+ Families
F) Non-occupant Loans on < 5 Family Dwellings (A B C & D)
G) Loans On Manufactured Home Dwelling (A B C & D)
Number
Average Value
Number
Average Value
Number
Average Value
Number
Average Value
Number
Average Value
Number
Average Value
Number
Average Value
LOANS ORIGINATED
47
$165,270
179
$165,485
534
$122,964
167
$46,189
1
$27,310
42
$170,806
48
$70,012
APPLICATIONS APPROVED, NOT ACCEPTED
4
$146,382
26
$140,379
53
$137,297
18
$47,417
0
$0
6
$214,752
19
$66,872
APPLICATIONS DENIED
5
$118,622
58
$79,595
328
$151,711
108
$57,540
0
$0
12
$119,545
63
$53,231
APPLICATIONS WITHDRAWN
6
$163,497
21
$160,945
113
$165,346
6
$79,818
0
$0
3
$77,793
3
$83,000
FILES CLOSED FOR INCOMPLETENESS
0
$0
4
$138,918
20
$171,260
4
$46,278
0
$0
0
$0
2
$153,110
Aggregated Statistics For Year 2007 (Based on 1 full and 6 partial tracts)
A) FHA, FSA/RHS & VA Home Purchase Loans
B) Conventional Home Purchase Loans
C) Refinancings
D) Home Improvement Loans
F) Non-occupant Loans on < 5 Family Dwellings (A B C & D)
G) Loans On Manufactured Home Dwelling (A B C & D)
Number
Average Value
Number
Average Value
Number
Average Value
Number
Average Value
Number
Average Value
Number
Average Value
LOANS ORIGINATED
18
$187,302
311
$142,060
505
$113,959
241
$36,631
47
$135,850
68
$52,307
APPLICATIONS APPROVED, NOT ACCEPTED
2
$243,935
60
$120,761
82
$116,663
26
$39,290
4
$69,042
34
$55,746
APPLICATIONS DENIED
3
$176,970
69
$102,480
322
$137,205
125
$56,008
9
$125,090
52
$49,417
APPLICATIONS WITHDRAWN
7
$157,994
22
$119,405
130
$147,098
10
$76,984
3
$100,587
6
$73,878
FILES CLOSED FOR INCOMPLETENESS
0
$0
7
$92,164
41
$146,733
3
$93,487
2
$109,040
2
$132,980
Aggregated Statistics For Year 2006 (Based on 1 full and 6 partial tracts)
A) FHA, FSA/RHS & VA Home Purchase Loans
B) Conventional Home Purchase Loans
C) Refinancings
D) Home Improvement Loans
E) Loans on Dwellings For 5+ Families
F) Non-occupant Loans on < 5 Family Dwellings (A B C & D)
G) Loans On Manufactured Home Dwelling (A B C & D)
Number
Average Value
Number
Average Value
Number
Average Value
Number
Average Value
Number
Average Value
Number
Average Value
Number
Average Value
LOANS ORIGINATED
26
$141,309
435
$124,347
556
$102,713
223
$40,563
3
$130,333
39
$110,718
94
$61,610
APPLICATIONS APPROVED, NOT ACCEPTED
2
$125,830
38
$109,680
95
$100,382
25
$53,070
0
$0
3
$81,563
24
$44,547
APPLICATIONS DENIED
1
$223,150
71
$92,941
359
$125,691
115
$61,123
1
$55,000
9
$143,518
44
$54,325
APPLICATIONS WITHDRAWN
7
$109,476
33
$135,942
175
$129,028
13
$24,591
0
$0
3
$84,643
7
$120,544
FILES CLOSED FOR INCOMPLETENESS
0
$0
9
$125,350
49
$140,858
2
$84,315
0
$0
1
$196,630
0
$0
Aggregated Statistics For Year 2005 (Based on 1 full and 6 partial tracts)
A) FHA, FSA/RHS & VA Home Purchase Loans
B) Conventional Home Purchase Loans
C) Refinancings
D) Home Improvement Loans
E) Loans on Dwellings For 5+ Families
F) Non-occupant Loans on < 5 Family Dwellings (A B C & D)
G) Loans On Manufactured Home Dwelling (A B C & D)
Number
Average Value
Number
Average Value
Number
Average Value
Number
Average Value
Number
Average Value
Number
Average Value
Number
Average Value
LOANS ORIGINATED
26
$139,930
430
$120,459
625
$102,190
194
$40,096
3
$142,957
40
$102,256
51
$63,926
APPLICATIONS APPROVED, NOT ACCEPTED
3
$134,250
54
$101,755
114
$102,982
27
$38,097
0
$0
7
$73,437
20
$54,753
APPLICATIONS DENIED
0
$0
119
$74,862
423
$116,992
115
$49,148
0
$0
8
$79,648
95
$48,643
APPLICATIONS WITHDRAWN
2
$93,470
24
$146,043
301
$122,819
27
$95,171
0
$0
7
$140,746
7
$94,607
FILES CLOSED FOR INCOMPLETENESS
0
$0
16
$118,111
45
$136,609
3
$45,880
0
$0
1
$136,550
0
$0
Aggregated Statistics For Year 2004 (Based on 1 full and 6 partial tracts)
A) FHA, FSA/RHS & VA Home Purchase Loans
B) Conventional Home Purchase Loans
C) Refinancings
D) Home Improvement Loans
F) Non-occupant Loans on < 5 Family Dwellings (A B C & D)
G) Loans On Manufactured Home Dwelling (A B C & D)
Number
Average Value
Number
Average Value
Number
Average Value
Number
Average Value
Number
Average Value
Number
Average Value
LOANS ORIGINATED
22
$140,490
352
$125,306
697
$105,025
242
$39,219
43
$115,909
83
$58,976
APPLICATIONS APPROVED, NOT ACCEPTED
0
$0
32
$95,284
141
$103,849
34
$34,170
10
$100,192
28
$48,566
APPLICATIONS DENIED
5
$121,064
76
$90,011
361
$108,272
81
$40,530
16
$85,562
48
$47,248
APPLICATIONS WITHDRAWN
7
$123,649
45
$112,675
276
$115,162
20
$50,439
6
$129,018
5
$93,932
FILES CLOSED FOR INCOMPLETENESS
0
$0
6
$123,732
73
$128,377
4
$48,240
1
$5,460
1
$8,740
Aggregated Statistics For Year 2003 (Based on 1 full and 6 partial tracts)
A) FHA, FSA/RHS & VA Home Purchase Loans
B) Conventional Home Purchase Loans
C) Refinancings
D) Home Improvement Loans
E) Loans on Dwellings For 5+ Families
F) Non-occupant Loans on < 5 Family Dwellings (A B C & D)
Number
Average Value
Number
Average Value
Number
Average Value
Number
Average Value
Number
Average Value
Number
Average Value
LOANS ORIGINATED
38
$125,852
286
$114,327
1,290
$95,783
185
$35,931
2
$434,665
37
$82,414
APPLICATIONS APPROVED, NOT ACCEPTED
4
$77,408
32
$69,761
159
$95,058
31
$37,496
0
$0
3
$166,803
APPLICATIONS DENIED
2
$90,000
71
$59,274
423
$97,880
56
$29,553
0
$0
31
$85,386
APPLICATIONS WITHDRAWN
4
$116,725
22
$101,180
272
$112,731
20
$16,724
0
$0
6
$87,667
FILES CLOSED FOR INCOMPLETENESS
0
$0
7
$164,196
37
$118,503
8
$39,090
0
$0
0
$0
Aggregated Statistics For Year 2002 (Based on 1 full and 4 partial tracts)
A) FHA, FSA/RHS & VA Home Purchase Loans
B) Conventional Home Purchase Loans
C) Refinancings
D) Home Improvement Loans
F) Non-occupant Loans on < 5 Family Dwellings (A B C & D)
Number
Average Value
Number
Average Value
Number
Average Value
Number
Average Value
Number
Average Value
LOANS ORIGINATED
26
$718,229
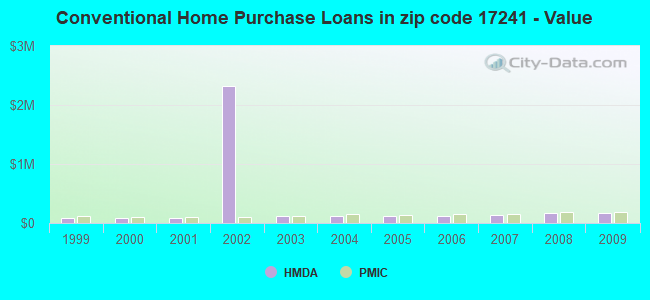
219
$2,317,619
634
$94,623
129
$25,695
36
$77,035
APPLICATIONS APPROVED, NOT ACCEPTED
2
$63,830
38
$77,220
120
$75,534
16
$22,975
5
$82,570
APPLICATIONS DENIED
3
$70,167
61
$1,373,975
244
$88,720
47
$14,141
5
$41,644
APPLICATIONS WITHDRAWN
5
$32,812,870
27
$3,283,309
155
$96,098
12
$22,499
11
$7,947,345
FILES CLOSED FOR INCOMPLETENESS
0
$0
5
$27,556
47
$97,914
1
$30,590
0
$0
Aggregated Statistics For Year 2001 (Based on 1 full and 4 partial tracts)
A) FHA, FSA/RHS & VA Home Purchase Loans
B) Conventional Home Purchase Loans
C) Refinancings
D) Home Improvement Loans
E) Loans on Dwellings For 5+ Families
F) Non-occupant Loans on < 5 Family Dwellings (A B C & D)
Number
Average Value
Number
Average Value
Number
Average Value
Number
Average Value
Number
Average Value
Number
Average Value
LOANS ORIGINATED
34
$103,691
204
$82,588
497
$89,384
128
$28,841
0
$0
17
$69,141
APPLICATIONS APPROVED, NOT ACCEPTED
0
$0
63
$50,253
71
$77,556
19
$25,851
0
$0
1
$60,080
APPLICATIONS DENIED
1
$140,920
128
$41,572
328
$83,290
50
$23,825
2
$163,380
12
$144,552
APPLICATIONS WITHDRAWN
3
$69,027
17
$85,074
105
$88,189
15
$23,820
0
$0
1
$52,440
FILES CLOSED FOR INCOMPLETENESS
2
$58,510
3
$101,687
41
$107,618
5
$13,982
0
$0
0
$0
Aggregated Statistics For Year 2000 (Based on 1 full and 4 partial tracts)
A) FHA, FSA/RHS & VA Home Purchase Loans
B) Conventional Home Purchase Loans
C) Refinancings
D) Home Improvement Loans
E) Loans on Dwellings For 5+ Families
F) Non-occupant Loans on < 5 Family Dwellings (A B C & D)
Number
Average Value
Number
Average Value
Number
Average Value
Number
Average Value
Number
Average Value
Number
Average Value
LOANS ORIGINATED
31
$91,060
243
$82,126
201
$68,400
145
$22,893
1
$70,000
27
$78,235
APPLICATIONS APPROVED, NOT ACCEPTED
5
$61,400
61
$51,600
75
$66,545
22
$27,015
0
$0
3
$42,723
APPLICATIONS DENIED
2
$41,795
166
$41,112
220
$65,728
43
$30,419
0
$0
14
$58,616
APPLICATIONS WITHDRAWN
2
$106,110
27
$76,984
79
$64,580
6
$10,322
2
$151,980
4
$74,508
FILES CLOSED FOR INCOMPLETENESS
0
$0
3
$54,067
32
$90,452
2
$9,120
0
$0
1
$67,000
Aggregated Statistics For Year 1999 (Based on 1 full and 3 partial tracts)
A) FHA, FSA/RHS & VA Home Purchase Loans
B) Conventional Home Purchase Loans
C) Refinancings
D) Home Improvement Loans
F) Non-occupant Loans on < 5 Family Dwellings (A B C & D)
2004 - 2018 National Fire Incident Reporting System (NFIRS) incidents
Based on the data from the years 2004 - 2018 the average number of fires per year is 65. The highest number of reported fire incidents - 121 took place in 2009, and the least - 8 in 2004. The data has an increasing trend.
When looking into fire subcategories, the most reports belonged to: Structure Fires (47.6%), and Outside Fires (32.3%).
Fire incident types reported to NFIRS in Zip Code 17241
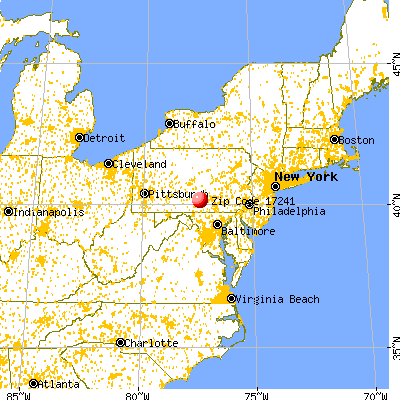


 Nearest zip codes: 17266, 17081, 17257, 17240, 17006, 17015.


 Based on the data from the years 2004 - 2018 the average number of fires per year is 65. The highest number of reported fire incidents - 121 took place in 2009, and the least - 8 in 2004. The data has an increasing trend.
 When looking into fire subcategories, the most reports belonged to: Structure Fires (47.6%), and Outside Fires (32.3%).