Estimated zip code population in 2022: 5,195 Zip code population in 2010: 4,686 Zip code population in 2000: 4,740
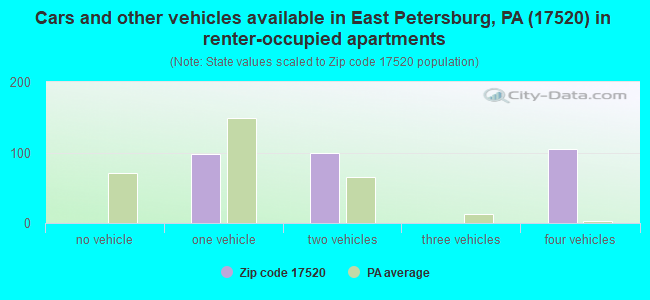
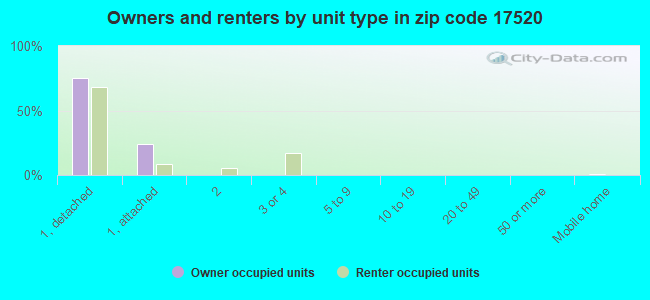
Houses and condos: 2,139 Renter-occupied apartments: 299
% of renters here:
14%
State:
31%
March 2022 cost of living index in zip code 17520: 95.5 (near average, U.S. average is 100)
Land area: 1.9 sq. mi. Water area: 0.0 sq. mi.
Population density: 2,785 people per square mile
(average).
OSM Map
General Map
Google Map
MSN Map
OSM Map
General Map
Google Map
MSN Map
OSM Map
General Map
Google Map
MSN Map
OSM Map
General Map
Google Map
MSN Map
Please wait while loading the map...
Real estate property taxes paid for housing units in 2022:
This zip code:
1.5% ($3,726)
Pennsylvania:
1.3% ($3,094)
Median real estate property taxes paid for housing units with mortgages in 2022: $3,870 (1.5%) Median real estate property taxes paid for housing units with no mortgage in 2022: $3,471 (1.3%)
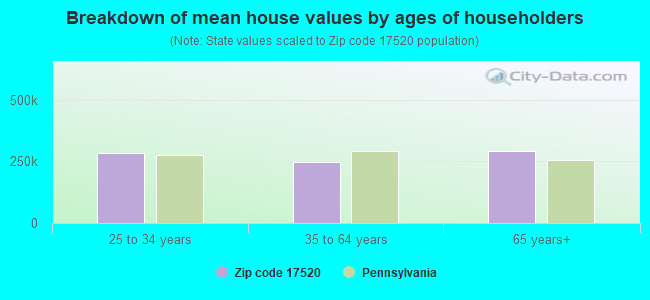
Estimated median house/condo value in 2022: $256,679
17520:
$256,679
Pennsylvania:
$245,500
According to our research of Pennsylvania and other state lists, there were 3 registered sex offenders living in 17520 zip code as of April 26, 2024. The ratio of all residents to sex offenders in zip code 17520 is 1,569 to 1. The ratio of registered sex offenders to all residents in this zip code is much lower than the state average.
Median resident age:
This zip code:
42.3 years
Pennsylvania median age:
40.9 years
Average household size:
This zip code:
2.4 people
Pennsylvania:
2.4 people
Averages for the 2020 tax year for zip code 17520, filed in 2021:
Average Adjusted Gross Income (AGI) in 2020: $65,757 (Individual Income Tax Returns)
Here:
$65,757
State:
$75,707
Salary/wage: $55,682 (reported on 83.9% of returns)
Here:
$55,682
State:
$62,806
(% of AGI for various income ranges: 998.2% for AGIs below $25k, 3454.5% for AGIs $25k-50k, 6014.7% for AGIs $50k-75k, 9287.2% for AGIs $75k-100k, 15591.1% for AGIs $100k-200k, 49576.7% for AGIs over 200k)
Taxable interest for individuals: $954 (reported on 30.7% of returns)
This zip code:
$954
Pennsylvania:
$1,633
(% of AGI for various income ranges: 14.7% for AGIs below $25k, 21.2% for AGIs $25k-50k, 33.8% for AGIs $50k-75k, 31.6% for AGIs $75k-100k, 72.2% for AGIs $100k-200k, 670.0% for AGIs over 200k)
Ordinary dividends: $3,720 (reported on 22.6% of returns)
Here:
$3,720
State:
$7,382
(% of AGI for various income ranges: 33.3% for AGIs below $25k, 35.5% for AGIs $25k-50k, 64.1% for AGIs $50k-75k, 120.8% for AGIs $75k-100k, 188.5% for AGIs $100k-200k, 2783.3% for AGIs over 200k)
Net capital gain/loss in AGI: +$13,894 (reported on 18.4% of returns)
Here:
+$13,894
State:
+$23,522
(% of AGI for various income ranges: 16.9% for AGIs below $25k, 22.2% for AGIs $25k-50k, 66.6% for AGIs $50k-75k, 148.8% for AGIs $75k-100k, 164.4% for AGIs $100k-200k, 18146.7% for AGIs over 200k)
Profit/loss from business: +$18,165 (reported on 11.9% of returns)
Here:
+$18,165
State:
+$16,274
(% of AGI for various income ranges: 106.9% for AGIs below $25k, 129.6% for AGIs $25k-50k, 158.1% for AGIs $50k-75k, 366.4% for AGIs $75k-100k, 277.8% for AGIs $100k-200k, 7580.0% for AGIs over 200k)
Taxable individual retirement arrangement distribution: $17,654 (reported on 13.4% of returns)
17520:
$17,654
Pennsylvania:
$18,583
(% of AGI for various income ranges: 130.0% for AGIs below $25k, 150.4% for AGIs $25k-50k, 291.9% for AGIs $50k-75k, 290.8% for AGIs $75k-100k, 1153.3% for AGIs $100k-200k)
Total itemized deductions: $24,640 (reported on 5.7% of returns)
Here:
$24,640
State:
$34,850
(% of AGI for various income ranges: 91.2% for AGIs below $25k, 139.4% for AGIs $50k-75k, 292.0% for AGIs $75k-100k, 400.4% for AGIs $100k-200k, 3306.7% for AGIs over 200k)
Charity contributions: $6,969 (reported on 5.0% of returns)
Here:
$6,969
State:
$12,392
(% of AGI for various income ranges: 18.8% for AGIs $25k-50k, 50.0% for AGIs $75k-100k, 137.0% for AGIs $100k-200k, 1050.0% for AGIs over 200k)
Taxes paid: $7,513 (reported on 5.7% of returns)
17520:
$7,513
State:
$8,200
(% of AGI for various income ranges: 68.8% for AGIs $50k-75k, 100.0% for AGIs $75k-100k, 139.3% for AGIs $100k-200k, 936.7% for AGIs over 200k)
Earned income credit: $1,981 (reported on 10.3% of returns)
Here:
$1,981
State:
$2,100
(% of AGI for various income ranges: 59.4% for AGIs below $25k, 47.8% for AGIs $25k-50k)
Percentage of individuals using paid preparers for their 2020 taxes: 93.9%
Here:
94%
State:
92%
(% for various income ranges: 91.7% for AGIs below $25k, 93.8% for AGIs $25k-50k, 95.1% for AGIs $50k-75k, 94.3% for AGIs $75k-100k, 95.1% for AGIs $100k-200k, 100.0% for AGIs over 200k)
Averages for the 2012 tax year for zip code 17520, filed in 2013:
Average Adjusted Gross Income (AGI) in 2012: $50,288 (Individual Income Tax Returns)
Here:
$50,288
State:
$61,346
Salary/wage: $43,625 (reported on 85.8% of returns)
Here:
$43,625
State:
$51,902
(% of AGI for various income ranges: 71.3% for AGIs below $25k, 76.5% for AGIs $25k-50k, 81.0% for AGIs $50k-75k, 81.2% for AGIs $75k-100k, 76.9% for AGIs $100k-200k, 34.1% for AGIs over 200k)
Taxable interest for individuals: $1,127 (reported on 34.1% of returns)
This zip code:
$1,127
Pennsylvania:
$1,588
(% of AGI for various income ranges: 1.3% for AGIs below $25k, 0.7% for AGIs $25k-50k, 0.5% for AGIs $50k-75k, 0.5% for AGIs $75k-100k, 0.2% for AGIs $100k-200k, 3.1% for AGIs over 200k)
Ordinary dividends: $2,318 (reported on 22.4% of returns)
Here:
$2,318
State:
$5,827
(% of AGI for various income ranges: 1.6% for AGIs below $25k, 1.1% for AGIs $25k-50k, 0.7% for AGIs $50k-75k, 1.2% for AGIs $75k-100k, 1.1% for AGIs $100k-200k, 0.6% for AGIs over 200k)
Net capital gain/loss in AGI: +$3,664 (reported on 13.4% of returns)
Here:
+$3,664
State:
+$14,495
(% of AGI for various income ranges: 0.3% for AGIs $50k-75k, 0.3% for AGIs $75k-100k, 0.2% for AGIs $100k-200k, 9.7% for AGIs over 200k)
Profit/loss from business: +$13,963 (reported on 12.2% of returns)
Here:
+$13,963
State:
+$16,268
(% of AGI for various income ranges: 4.4% for AGIs below $25k, 3.9% for AGIs $25k-50k, 2.8% for AGIs $50k-75k, 2.2% for AGIs $75k-100k, 5.5% for AGIs $100k-200k)
Taxable individual retirement arrangement distribution: $12,124 (reported on 13.8% of returns)
17520:
$12,124
Pennsylvania:
$14,550
(% of AGI for various income ranges: 6.5% for AGIs below $25k, 3.5% for AGIs $25k-50k, 2.5% for AGIs $50k-75k, 2.4% for AGIs $75k-100k, 5.1% for AGIs $100k-200k)
Total itemized deductions: $17,668 (22% of AGI, reported on 35.8% of returns)
Here:
$17,668
State:
$23,538
Here:
21.7% of AGI
State:
18.4% of AGI
(% of AGI for various income ranges: 10.6% for AGIs below $25k, 11.8% for AGIs $25k-50k, 12.7% for AGIs $50k-75k, 13.3% for AGIs $75k-100k, 12.9% for AGIs $100k-200k, 13.0% for AGIs over 200k)
Charity contributions: $3,484 (reported on 27.6% of returns)
Here:
$3,484
State:
$4,025
(% of AGI for various income ranges: 0.7% for AGIs below $25k, 1.3% for AGIs $25k-50k, 1.9% for AGIs $50k-75k, 1.9% for AGIs $75k-100k, 2.7% for AGIs $100k-200k, 2.0% for AGIs over 200k)
Taxes paid: $6,514 (reported on 35.8% of returns)
17520:
$6,514
State:
$9,982
(% of AGI for various income ranges: 2.4% for AGIs below $25k, 3.6% for AGIs $25k-50k, 4.7% for AGIs $50k-75k, 5.1% for AGIs $75k-100k, 5.5% for AGIs $100k-200k, 5.3% for AGIs over 200k)
Earned income credit: $1,793 (reported on 12.2% of returns)
Here:
$1,793
State:
$2,106
(% of AGI for various income ranges: 3.8% for AGIs below $25k, 0.8% for AGIs $25k-50k)
Percentage of individuals using paid preparers for their 2012 taxes: 51.6%
Here:
52%
State:
53%
(% for various income ranges: 44.8% for AGIs below $25k, 50.0% for AGIs $25k-50k, 57.4% for AGIs $50k-75k, 55.6% for AGIs $75k-100k, 59.1% for AGIs $100k-200k, 100.0% for AGIs over 200k)
Averages for the 2004 tax year for zip code 17520, filed in 2005:
Average Adjusted Gross Income (AGI) in 2004: $46,826 (Individual Income Tax Returns)
Here:
$46,826
State:
$48,049
Salary/wage: $39,484 (reported on 87.1% of returns)
Here:
$39,484
State:
$42,646
(% of AGI for various income ranges: 91.4% for AGIs below $10k, 71.5% for AGIs $10k-25k, 82.2% for AGIs $25k-50k, 86.4% for AGIs $50k-75k, 87.5% for AGIs $75k-100k, 44.6% for AGIs over 100k)
Taxable interest for individuals: $1,137 (reported on 49.7% of returns)
This zip code:
$1,137
Pennsylvania:
$1,657
(% of AGI for various income ranges: 4.7% for AGIs below $10k, 3.0% for AGIs $10k-25k, 1.3% for AGIs $25k-50k, 0.8% for AGIs $50k-75k, 0.6% for AGIs $75k-100k, 1.2% for AGIs over 100k)
Taxable dividends: $1,757 (reported on 27.9% of returns)
Here:
$1,757
State:
$3,566
(% of AGI for various income ranges: 2.4% for AGIs below $10k, 2.1% for AGIs $10k-25k, 1.2% for AGIs $25k-50k, 1.0% for AGIs $50k-75k, 0.8% for AGIs $75k-100k, 0.8% for AGIs over 100k)
Net capital gain/loss: +$25,315 (reported on 18.6% of returns)
Here:
+$25,315
State:
+$9,716
(% of AGI for various income ranges: -1.3% for AGIs below $10k, -0.4% for AGIs $10k-25k, -0.0% for AGIs $25k-50k, 0.4% for AGIs $50k-75k, 0.6% for AGIs $75k-100k, 37.1% for AGIs over 100k)
Profit/loss from business: +$11,766 (reported on 12.1% of returns)
Here:
+$11,766
State:
+$14,267
(% of AGI for various income ranges: 6.3% for AGIs below $10k, 3.5% for AGIs $10k-25k, 3.3% for AGIs $25k-50k, 2.9% for AGIs $50k-75k, 1.9% for AGIs $75k-100k, 3.4% for AGIs over 100k)
IRA payment deduction: $2,519 (reported on 3.2% of returns)
17520:
$2,519
Pennsylvania:
$2,903
Self-employed pension: $6,800 (reported on 0.8% of returns)
Here:
$6,800
Pennsylvania:
$14,674
Total itemized deductions: $14,640 (22% of AGI, reported on 38.1% of returns)
Here:
$14,640
State:
$18,804
Here:
21.7% of AGI
State:
19.5% of AGI
(% of AGI for various income ranges: 4.3% for AGIs below $10k, 10.6% for AGIs $10k-25k, 12.7% for AGIs $25k-50k, 14.9% for AGIs $50k-75k, 13.3% for AGIs $75k-100k, 8.2% for AGIs over 100k)
Charity contributions deductions: $3,001 (4% of AGI, reported on 32.7% of returns)
Here:
$3,001
State:
$3,337
Here:
4.3% of AGI
State:
3.3% of AGI
(% of AGI for various income ranges: 1.5% for AGIs $10k-25k, 1.7% for AGIs $25k-50k, 2.3% for AGIs $50k-75k, 2.2% for AGIs $75k-100k, 2.4% for AGIs over 100k)
Total tax: $6,124 (reported on 78.5% of returns)
17520:
$6,124
State:
$8,008
(% of AGI for various income ranges: 1.9% for AGIs below $10k, 4.6% for AGIs $10k-25k, 6.9% for AGIs $25k-50k, 8.4% for AGIs $50k-75k, 10.6% for AGIs $75k-100k, 16.7% for AGIs over 100k)
Earned income credit: $1,379 (reported on 7.9% of returns)
Here:
$1,379
State:
$1,643
Percentage of individuals using paid preparers for their 2004 taxes: 51.5%
Here:
52%
State:
56%
(% for various income ranges: 39.8% for AGIs below $10k, 54.1% for AGIs $10k-25k, 54.9% for AGIs $25k-50k, 54.4% for AGIs $50k-75k, 52.7% for AGIs $75k-100k, 55.4% for AGIs over 100k)
Household received Food Stamps/SNAP in the past 12 months: 44 Household did not receive Food Stamps/SNAP in the past 12 months: 2,096
Women who had a birth in the past 12 months: 22 (21 now married, 1 unmarried) Women who did not have a birth in the past 12 months: 1,153 (701 now married, 443 unmarried)
Housing units in zip code 17520 with a mortgage: 1,184 (219 second mortgage, 199 both second mortgage and home equity loan) Houses without a mortgage: 232
Median monthly owner costs for units with a mortgage: $1,605 Median monthly owner costs for units without a mortgage: $694
Residents with income below the poverty level in 2022:
This zip code:
5.9%
Whole state:
11.8%
Residents with income below 50% of the poverty level in 2022:
This zip code:
4.5%
Whole state:
6.1%
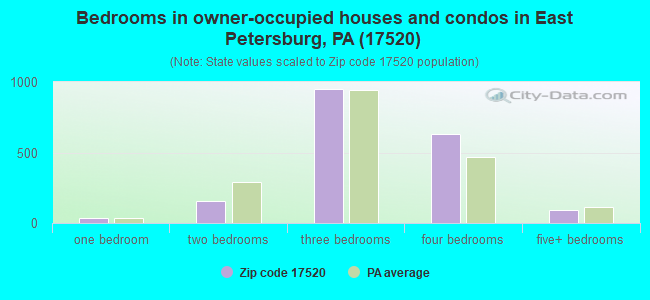
Median number of rooms in houses and condos:
Here:
6.8
State:
6.8
Median number of rooms in apartments:
Here:
5.2
State:
4.3
Notable locations in this zip code not listed on our city pages
In group quarters: 15 (-1 institutionalized population)
Size of family households: 807 2-persons, 242 3-persons, 314 4-persons, 171 5-persons, 43 6-persons
Size of nonfamily households: 491 1-person, 79 2-persons
976 married couples with children.
107 single-parent households (30 men, 77 women).
91.6% of residents of 17520 zip code speak English at home.
4.1% of residents speak Spanish at home (100% very well).
0.3% of residents speak other Indo-European language at home (100% well).
2.2% of residents speak Asian or Pacific Island language at home (100% very well).
1.6% of residents speak other language at home (100% very well).
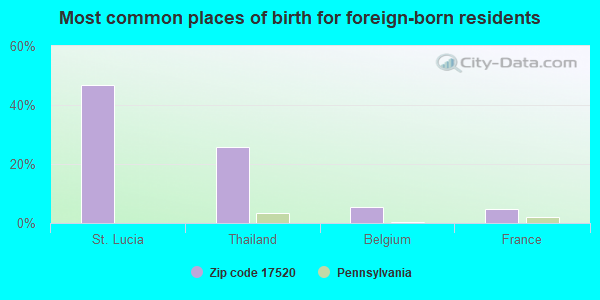
Foreign born population: 274 (5.3%) (63.1% of them are naturalized citizens)
This zip code:
5.3%
Whole state:
7.5%
47%St. Lucia
26%Thailand
5%Belgium
5%France
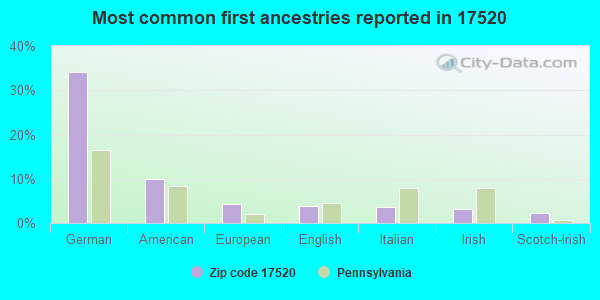
34%German
10%American
4%European
4%English
4%Italian
3%Irish
2%Scotch-Irish
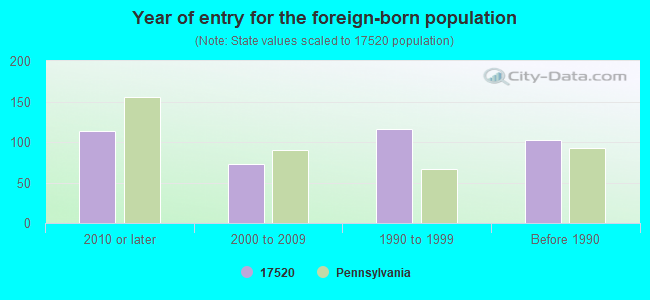
Year of entry for the foreign-born population
1132010 or later
732000 to 2009
1161990 to 1999
103Before 1990
Facilities with environmental interests located in this zip code:
BINKLEY & OBER INC/E PETERSBURG (ROUTE 72 NORTH in EAST PETERSBURG, PA)
AIR MINOR (AIRS/AFS) National Pollutant Discharge Elimination System NON-MAJOR (Tracking pollutant discharge elimination systems) - permit Business SIC classification: READY-MIXED CONCRETE; CUT STONE AND STONE PRODUCTS
AUTOHAUS PORSCHE-AUDI-INCORPORATED (5260 MAIN STREET in EAST PETERSBURG, PA)
Housing units lacking complete kitchen facilities: 1.5%
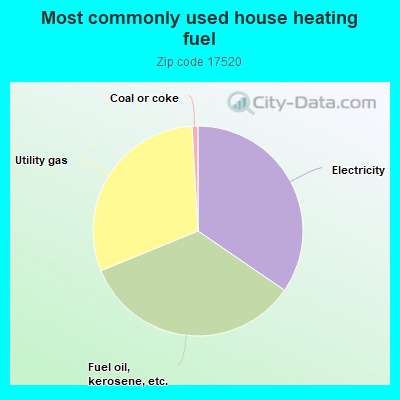
34.6%Electricity
34.3%Fuel oil, kerosene, etc.
30.3%Utility gas
0.9%Coal or coke
Population in 1990: 4,387. Population change in the 1990s: +353 (+8.0%).
Place of birth for U.S.-born residents:
This state: 3,752
Northeast: 510
Midwest: 123
South: 314
West: 71
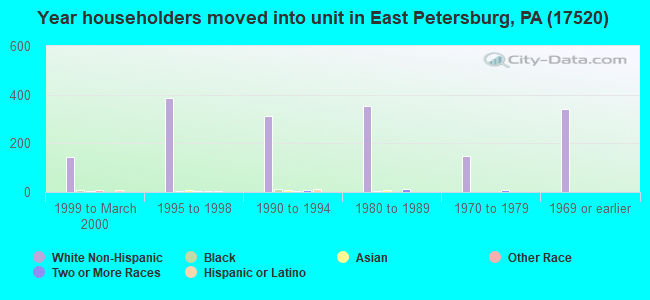
69% of the 17520 zip code residents lived in the same house 5 years ago. Out of people who lived in different houses, 73% lived in this county. Out of people who lived in different counties, 50% lived in Pennsylvania.
96% of the 17520 zip code residents lived in the same house 1 year ago. Out of people who lived in different houses, 77% moved from this county. Out of people who lived in different houses, 26% moved from different county within same state.
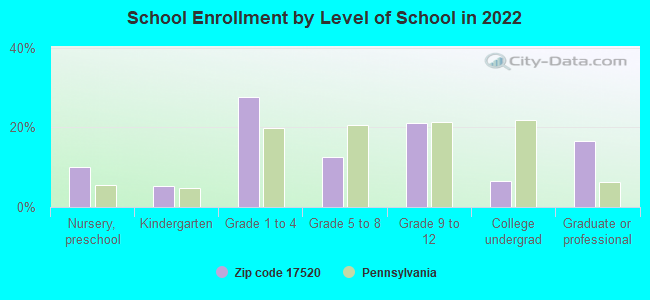
Private vs. public school enrollment:
Students in private schools in grades 1 to 8 (elementary and middle school): 195
Here:
36.9%
Pennsylvania:
15.7%
Students in private schools in grades 9 to 12 (high school): 2
Here:
0.8%
Pennsylvania:
13.4%
Students in private undergraduate colleges:
Here:
0.0%
Pennsylvania:
39.8%
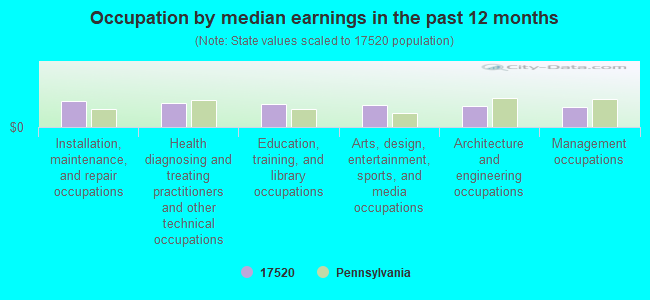
Occupation by median earnings in the past 12 months ($)
77,182Installation, maintenance, and repair occupations
70,564Health diagnosing and treating practitioners and other technical occupations
67,432Education, training, and library occupations
65,267Arts, design, entertainment, sports, and media occupations
62,282Architecture and engineering occupations
60,382Management occupations
Companies with federal contracts located in this zip code:
GOOSEWORKS, INC (6069 MAIN STREET in EAST PETERSBUR, PA) : $1,488,886 in 2 contractsin 2005
$744,443 with U.S. Army Corps of Engineers - civil program financing only for Maintenance, Repair or Alteration of Real Property -- Dams. Signed on 2005-04-25. Completion date: 2004-07-06.
$744,443 with Army for Maintenance, Repair or Alteration of Real Property -- Dams. Signed on 2005-04-25. Completion date: 2004-07-06.
WACOR ELECTRONIC SYSTEMS INC (1830 STATE ST in EAST PETERSBUR, PA; small business) : $69,557 in 10 contractsfrom 2000 to 2005
Contracts for Optoelectronic Devices and Associated Hardware, Photographic Equipment and Accessories, ADP Support Equipment, Maintenance, Repair and Rebuilding of Equipment -- Alarm, Signal, and Security Detection Systems by Defense Logistics Agency, Navy, National Park Service Signed by year:2000: $29,120; 2001: $0; 2002: $0; 2003: $6,486; 2004: $17,964; 2005: $15,987; 2006: $0.
Biggest contracts:
$29,120 with Defense Logistics Agency for Optoelectronic Devices and Associated Hardware. Signed on 2000-09-18. Completion date: 2000-11-20.
$17,313 with Navy for Photographic Equipment and Accessories. Signed on 2005-08-04. Completion date: 2005-09-06.
$15,000 with Navy for ADP Support Equipment. Signed on 2004-12-02. Completion date: 2005-09-30.
$3,644 with National Park Service for Maintenance, Repair and Rebuilding of Equipment -- Alarm, Signal, and Security Detection Systems. Signed on 2004-08-25. Effective on 2004-10-01. Completion date: 2005-09-30.
RICHTER PRECISION INC (1021 COMMERCIAL AVE in EAST PETERSBUR, PA)
$57,390 with Army for Cutting Tools for Machine Tools. Signed on 2004-03-03. Completion date: 2004-03-23.
Top industries in this zip code by the number of employees in 2005:
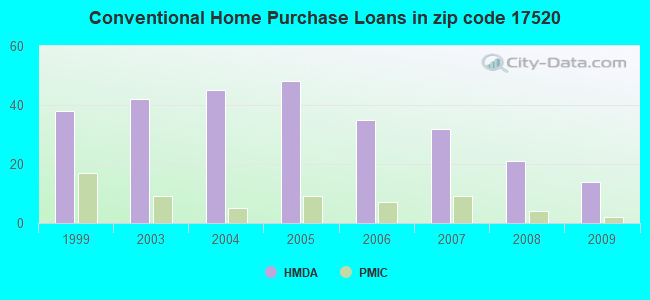
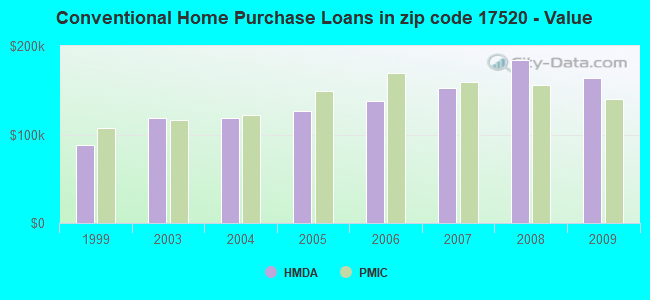
Detailed PMIC statistics for the following Tracts:0116.00
2002 - 2018 National Fire Incident Reporting System (NFIRS) incidents
According to the data from the years 2002 - 2018 the average number of fires per year is 17. The highest number of fires - 30 took place in 2002, and the least - 6 in 2016. The data has a declining trend.
When looking into fire subcategories, the most incidents belonged to: Structure Fires (74.1%), and Outside Fires (15.7%).
Fire incident types reported to NFIRS in Zip Code 17520

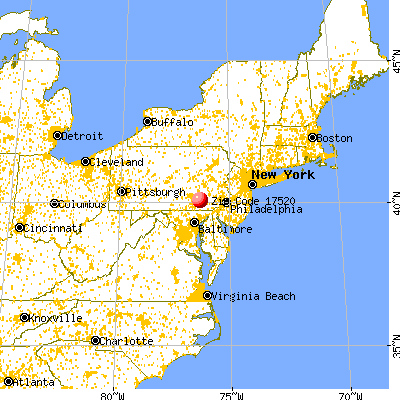


 Nearest zip codes: 17601, 17606, 17538, 17603, 17554, 17543.


 According to the data from the years 2002 - 2018 the average number of fires per year is 17. The highest number of fires - 30 took place in 2002, and the least - 6 in 2016. The data has a declining trend.
 When looking into fire subcategories, the most incidents belonged to: Structure Fires (74.1%), and Outside Fires (15.7%).