Estimated zip code population in 2022: 67,801 Zip code population in 2010: 61,973 Zip code population in 2000: 57,611
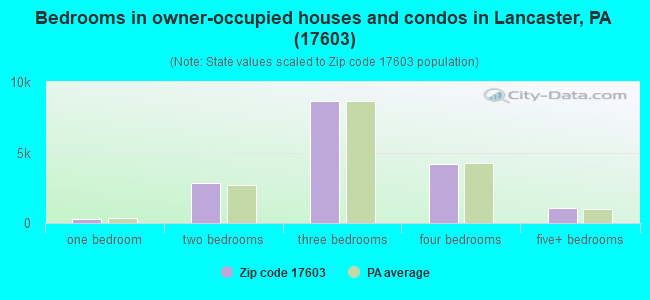
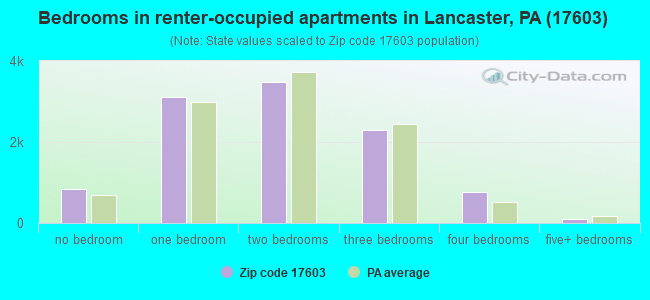
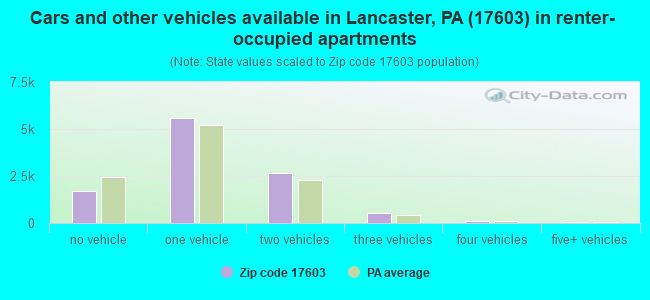
Houses and condos: 28,559 Renter-occupied apartments: 10,544
% of renters here:
38%
State:
31%
March 2022 cost of living index in zip code 17603: 95.2 (less than average, U.S. average is 100)
Land area: 29.8 sq. mi. Water area: 0.4 sq. mi.
Population density: 2,275 people per square mile
(low).
OSM Map
General Map
Google Map
MSN Map
OSM Map
General Map
Google Map
MSN Map
OSM Map
General Map
Google Map
MSN Map
OSM Map
General Map
Google Map
MSN Map
Please wait while loading the map...
Real estate property taxes paid for housing units in 2022:
This zip code:
1.4% ($3,532)
Pennsylvania:
1.3% ($3,094)
Median real estate property taxes paid for housing units with mortgages in 2022: $3,414 (1.4%) Median real estate property taxes paid for housing units with no mortgage in 2022: $3,802 (1.5%)
Averages for the 2020 tax year for zip code 17603, filed in 2021:
Average Adjusted Gross Income (AGI) in 2020: $65,674 (Individual Income Tax Returns)
Here:
$65,674
State:
$75,707
Salary/wage: $48,468 (reported on 84.5% of returns)
Here:
$48,468
State:
$62,806
(% of AGI for various income ranges: 1143.5% for AGIs below $25k, 3491.0% for AGIs $25k-50k, 6324.3% for AGIs $50k-75k, 9132.7% for AGIs $75k-100k, 16728.2% for AGIs $100k-200k, 89652.8% for AGIs over 200k)
Taxable interest for individuals: $2,003 (reported on 22.2% of returns)
This zip code:
$2,003
Pennsylvania:
$1,633
(% of AGI for various income ranges: 11.6% for AGIs below $25k, 13.1% for AGIs $25k-50k, 29.0% for AGIs $50k-75k, 56.4% for AGIs $75k-100k, 131.3% for AGIs $100k-200k, 2881.4% for AGIs over 200k)
Ordinary dividends: $9,760 (reported on 16.7% of returns)
Here:
$9,760
State:
$7,382
(% of AGI for various income ranges: 25.4% for AGIs below $25k, 25.9% for AGIs $25k-50k, 72.2% for AGIs $50k-75k, 194.3% for AGIs $75k-100k, 517.4% for AGIs $100k-200k, 11945.5% for AGIs over 200k)
Net capital gain/loss in AGI: +$23,789 (reported on 14.6% of returns)
Here:
+$23,789
State:
+$23,522
(% of AGI for various income ranges: 10.6% for AGIs below $25k, 23.4% for AGIs $25k-50k, 74.4% for AGIs $50k-75k, 209.4% for AGIs $75k-100k, 742.1% for AGIs $100k-200k, 32563.1% for AGIs over 200k)
Profit/loss from business: +$13,712 (reported on 12.5% of returns)
Here:
+$13,712
State:
+$16,274
(% of AGI for various income ranges: 53.8% for AGIs below $25k, 91.7% for AGIs $25k-50k, 194.2% for AGIs $50k-75k, 341.1% for AGIs $75k-100k, 805.2% for AGIs $100k-200k, 5737.9% for AGIs over 200k)
Taxable individual retirement arrangement distribution: $19,242 (reported on 8.3% of returns)
17603:
$19,242
Pennsylvania:
$18,583
(% of AGI for various income ranges: 48.3% for AGIs below $25k, 63.2% for AGIs $25k-50k, 153.3% for AGIs $50k-75k, 377.1% for AGIs $75k-100k, 903.1% for AGIs $100k-200k, 5049.3% for AGIs over 200k)
Self-employed (Keogh) retirement plans: $20,674 (reported on 0.6% of returns)
17603:
$20,674
Pennsylvania:
$25,407
(% of AGI for various income ranges: 9.6% for AGIs $50k-75k, 37.3% for AGIs $100k-200k, 986.6% for AGIs over 200k)
Total itemized deductions: $45,751 (reported on 5.8% of returns)
Here:
$45,751
State:
$34,850
(% of AGI for various income ranges: 41.7% for AGIs below $25k, 85.4% for AGIs $25k-50k, 186.3% for AGIs $50k-75k, 414.4% for AGIs $75k-100k, 842.1% for AGIs $100k-200k, 16914.5% for AGIs over 200k)
Charity contributions: $30,154 (reported on 4.5% of returns)
Here:
$30,154
State:
$12,392
(% of AGI for various income ranges: 2.4% for AGIs below $25k, 13.4% for AGIs $25k-50k, 30.4% for AGIs $50k-75k, 85.3% for AGIs $75k-100k, 257.0% for AGIs $100k-200k, 12802.4% for AGIs over 200k)
Taxes paid: $7,460 (reported on 5.8% of returns)
17603:
$7,460
State:
$8,200
(% of AGI for various income ranges: 5.1% for AGIs below $25k, 15.3% for AGIs $25k-50k, 51.7% for AGIs $50k-75k, 127.9% for AGIs $75k-100k, 230.4% for AGIs $100k-200k, 1402.1% for AGIs over 200k)
Earned income credit: $2,214 (reported on 18.7% of returns)
Here:
$2,214
State:
$2,100
(% of AGI for various income ranges: 94.1% for AGIs below $25k, 67.8% for AGIs $25k-50k, 1.0% for AGIs $50k-75k)
Percentage of individuals using paid preparers for their 2020 taxes: 94.1%
Here:
94%
State:
92%
(% for various income ranges: 92.9% for AGIs below $25k, 95.3% for AGIs $25k-50k, 94.8% for AGIs $50k-75k, 92.9% for AGIs $75k-100k, 94.7% for AGIs $100k-200k, 94.4% for AGIs over 200k)
Averages for the 2012 tax year for zip code 17603, filed in 2013:
Average Adjusted Gross Income (AGI) in 2012: $49,480 (Individual Income Tax Returns)
Here:
$49,480
State:
$61,346
Salary/wage: $40,206 (reported on 86.0% of returns)
Here:
$40,206
State:
$51,902
(% of AGI for various income ranges: 83.3% for AGIs below $25k, 85.3% for AGIs $25k-50k, 79.9% for AGIs $50k-75k, 76.0% for AGIs $75k-100k, 69.8% for AGIs $100k-200k, 41.2% for AGIs over 200k)
Taxable interest for individuals: $1,942 (reported on 26.8% of returns)
This zip code:
$1,942
Pennsylvania:
$1,588
(% of AGI for various income ranges: 0.9% for AGIs below $25k, 0.5% for AGIs $25k-50k, 0.6% for AGIs $50k-75k, 0.7% for AGIs $75k-100k, 1.0% for AGIs $100k-200k, 2.0% for AGIs over 200k)
Ordinary dividends: $6,948 (reported on 17.9% of returns)
Here:
$6,948
State:
$5,827
(% of AGI for various income ranges: 1.5% for AGIs below $25k, 0.9% for AGIs $25k-50k, 1.2% for AGIs $50k-75k, 1.5% for AGIs $75k-100k, 2.8% for AGIs $100k-200k, 5.5% for AGIs over 200k)
Net capital gain/loss in AGI: +$12,666 (reported on 12.9% of returns)
Here:
+$12,666
State:
+$14,495
(% of AGI for various income ranges: 0.2% for AGIs below $25k, 0.2% for AGIs $25k-50k, 0.4% for AGIs $50k-75k, 0.6% for AGIs $75k-100k, 2.3% for AGIs $100k-200k, 11.3% for AGIs over 200k)
Profit/loss from business: +$10,499 (reported on 11.4% of returns)
Here:
+$10,499
State:
+$16,268
(% of AGI for various income ranges: 1.6% for AGIs $25k-50k, 2.5% for AGIs $50k-75k, 2.8% for AGIs $75k-100k, 4.1% for AGIs $100k-200k, 3.0% for AGIs over 200k)
Taxable individual retirement arrangement distribution: $15,622 (reported on 9.7% of returns)
17603:
$15,622
Pennsylvania:
$14,550
(% of AGI for various income ranges: 2.8% for AGIs below $25k, 2.0% for AGIs $25k-50k, 2.2% for AGIs $50k-75k, 2.9% for AGIs $75k-100k, 4.6% for AGIs $100k-200k, 3.6% for AGIs over 200k)
Self-employment retirement plans: $19,659 (reported on 0.6% of returns)
17603:
$19,659
Pennsylvania:
$20,922
(% of AGI for various income ranges: 0.3% for AGIs $100k-200k, 0.6% for AGIs over 200k)
Total itemized deductions: $20,690 (19% of AGI, reported on 26.4% of returns)
Here:
$20,690
State:
$23,538
Here:
19.2% of AGI
State:
18.4% of AGI
(% of AGI for various income ranges: 6.4% for AGIs below $25k, 9.0% for AGIs $25k-50k, 11.7% for AGIs $50k-75k, 13.2% for AGIs $75k-100k, 14.2% for AGIs $100k-200k, 11.1% for AGIs over 200k)
Charity contributions: $4,818 (reported on 20.2% of returns)
Here:
$4,818
State:
$4,025
(% of AGI for various income ranges: 0.5% for AGIs below $25k, 0.9% for AGIs $25k-50k, 1.4% for AGIs $50k-75k, 1.8% for AGIs $75k-100k, 2.6% for AGIs $100k-200k, 3.5% for AGIs over 200k)
Taxes paid: $8,140 (reported on 26.3% of returns)
17603:
$8,140
State:
$9,982
(% of AGI for various income ranges: 1.6% for AGIs below $25k, 2.9% for AGIs $25k-50k, 4.1% for AGIs $50k-75k, 5.1% for AGIs $75k-100k, 6.1% for AGIs $100k-200k, 5.3% for AGIs over 200k)
Earned income credit: $2,261 (reported on 23.1% of returns)
Here:
$2,261
State:
$2,106
(% of AGI for various income ranges: 7.5% for AGIs below $25k, 1.2% for AGIs $25k-50k)
Percentage of individuals using paid preparers for their 2012 taxes: 53.9%
Here:
54%
State:
53%
(% for various income ranges: 49.9% for AGIs below $25k, 52.9% for AGIs $25k-50k, 56.7% for AGIs $50k-75k, 62.3% for AGIs $75k-100k, 62.7% for AGIs $100k-200k, 80.6% for AGIs over 200k)
Averages for the 2004 tax year for zip code 17603, filed in 2005:
Average Adjusted Gross Income (AGI) in 2004: $41,247 (Individual Income Tax Returns)
Here:
$41,247
State:
$48,049
Salary/wage: $34,413 (reported on 86.9% of returns)
Here:
$34,413
State:
$42,646
(% of AGI for various income ranges: 104.5% for AGIs below $10k, 80.9% for AGIs $10k-25k, 85.8% for AGIs $25k-50k, 81.7% for AGIs $50k-75k, 76.8% for AGIs $75k-100k, 50.6% for AGIs over 100k)
Taxable interest for individuals: $1,753 (reported on 37.8% of returns)
This zip code:
$1,753
Pennsylvania:
$1,657
(% of AGI for various income ranges: 4.3% for AGIs below $10k, 1.7% for AGIs $10k-25k, 1.2% for AGIs $25k-50k, 1.1% for AGIs $50k-75k, 1.6% for AGIs $75k-100k, 2.1% for AGIs over 100k)
Taxable dividends: $3,998 (reported on 23.3% of returns)
Here:
$3,998
State:
$3,566
(% of AGI for various income ranges: 3.8% for AGIs below $10k, 1.6% for AGIs $10k-25k, 1.1% for AGIs $25k-50k, 1.2% for AGIs $50k-75k, 2.2% for AGIs $75k-100k, 4.0% for AGIs over 100k)
Net capital gain/loss: +$10,565 (reported on 17.0% of returns)
Here:
+$10,565
State:
+$9,716
(% of AGI for various income ranges: -1.4% for AGIs below $10k, 0.2% for AGIs $10k-25k, 0.5% for AGIs $25k-50k, 0.8% for AGIs $50k-75k, 1.9% for AGIs $75k-100k, 12.1% for AGIs over 100k)
Profit/loss from business: +$14,921 (reported on 10.5% of returns)
Here:
+$14,921
State:
+$14,267
(% of AGI for various income ranges: 2.2% for AGIs below $10k, 2.8% for AGIs $10k-25k, 2.3% for AGIs $25k-50k, 3.0% for AGIs $50k-75k, 3.2% for AGIs $75k-100k, 6.1% for AGIs over 100k)
Profit/loss from farming: +$6,308 (reported on 0.2% of returns)
Here:
+$6,308
State:
+$274
IRA payment deduction: $2,863 (reported on 2.4% of returns)
17603:
$2,863
Pennsylvania:
$2,903
(% of AGI for various income ranges: 0.2% for AGIs below $10k, 0.2% for AGIs $10k-25k, 0.2% for AGIs $25k-50k, 0.2% for AGIs $50k-75k, 0.2% for AGIs $75k-100k, 0.1% for AGIs over 100k)
Self-employed pension: $15,866 (reported on 0.9% of returns)
Here:
$15,866
Pennsylvania:
$14,674
(% of AGI for various income ranges: 0.2% for AGIs below $10k, 0.0% for AGIs $25k-50k, 0.1% for AGIs $50k-75k, 0.2% for AGIs $75k-100k, 0.9% for AGIs over 100k)
Total itemized deductions: $16,387 (20% of AGI, reported on 29.0% of returns)
Here:
$16,387
State:
$18,804
Here:
19.7% of AGI
State:
19.5% of AGI
(% of AGI for various income ranges: 8.8% for AGIs below $10k, 6.5% for AGIs $10k-25k, 10.6% for AGIs $25k-50k, 12.7% for AGIs $50k-75k, 14.7% for AGIs $75k-100k, 12.3% for AGIs over 100k)
Charity contributions deductions: $4,059 (5% of AGI, reported on 24.5% of returns)
Here:
$4,059
State:
$3,337
Here:
4.5% of AGI
State:
3.3% of AGI
(% of AGI for various income ranges: 0.4% for AGIs below $10k, 0.8% for AGIs $10k-25k, 1.3% for AGIs $25k-50k, 1.8% for AGIs $50k-75k, 2.5% for AGIs $75k-100k, 4.3% for AGIs over 100k)
Total tax: $6,737 (reported on 71.7% of returns)
17603:
$6,737
State:
$8,008
(% of AGI for various income ranges: 2.3% for AGIs below $10k, 3.8% for AGIs $10k-25k, 7.3% for AGIs $25k-50k, 9.3% for AGIs $50k-75k, 11.1% for AGIs $75k-100k, 20.1% for AGIs over 100k)
Earned income credit: $1,783 (reported on 18.9% of returns)
Here:
$1,783
State:
$1,643
Percentage of individuals using paid preparers for their 2004 taxes: 59.1%
Here:
59%
State:
56%
(% for various income ranges: 52.8% for AGIs below $10k, 62.7% for AGIs $10k-25k, 56.7% for AGIs $25k-50k, 61.9% for AGIs $50k-75k, 59.1% for AGIs $75k-100k, 70.2% for AGIs over 100k)
Likely homosexual households (counted as self-reported same-sex unmarried-partner households)
Lesbian couples: 0.3% of all households
Gay men: 0.4% of all households
Household received Food Stamps/SNAP in the past 12 months: 4,442 Household did not receive Food Stamps/SNAP in the past 12 months: 23,145
Women who had a birth in the past 12 months: 1,033 (810 now married, 236 unmarried) Women who did not have a birth in the past 12 months: 16,503 (5,942 now married, 10,582 unmarried)
Housing units in zip code 17603 with a mortgage: 10,428 (1,012 second mortgage, 10 home equity loan, 818 both second mortgage and home equity loan) Houses without a mortgage: 664
Median monthly owner costs for units with a mortgage: $1,425 Median monthly owner costs for units without a mortgage: $649
Residents with income below the poverty level in 2022:
This zip code:
12.5%
Whole state:
11.8%
Residents with income below 50% of the poverty level in 2022:
This zip code:
7.1%
Whole state:
6.1%
Median number of rooms in houses and condos:
Here:
6.6
State:
6.8
Median number of rooms in apartments:
Here:
4.3
State:
4.3
Notable locations in this zip code not listed on our city pages
8,483 married couples with children.
4,665 single-parent households (839 men, 3,826 women).
76.2% of residents of 17603 zip code speak English at home.
18.7% of residents speak Spanish at home (51% very well, 28% well, 15% not well, 7% not at all).
2.5% of residents speak other Indo-European language at home (56% very well, 31% well, 6% not well, 7% not at all).
2.2% of residents speak Asian or Pacific Island language at home (51% very well, 20% well, 21% not well, 8% not at all).
1.4% of residents speak other language at home (33% very well, 43% well, 24% not well).
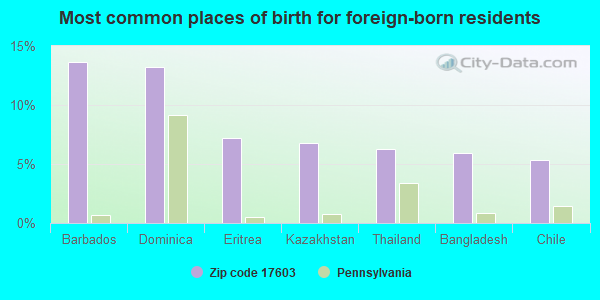
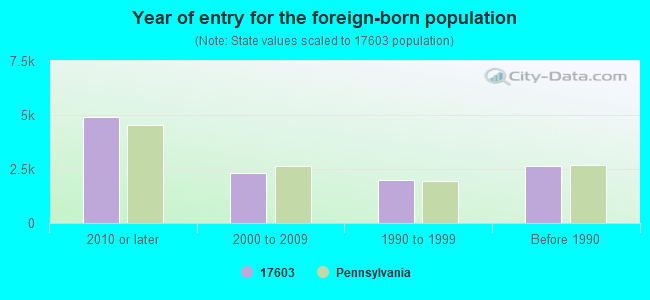
Foreign born population: 6,246 (9.2%) (63.5% of them are naturalized citizens)
Major facilities with environmental interests located in this zip code:
BIRD IN HAND WOODWORKS EAST HEMPFIELD SCH FURNITURE MFG PLT (3031 INDUSTRY DR. in LANCASTER, PA)
AIR SYNTHETIC MINOR (AIRS/AFS) ENFORCEMENT/COMPLIANCE ACTIVITY (Integrated Compliance Information System) - ICIS-03-2003-0309, FORMAL ENFORCEMENT ACTION (Integrated Compliance Information System) - ICIS-03-2003-0309, FORMAL ENFORCEMENT ACTION COMPLIANCE ACTIVITY (Tracking inspections of insecticide, fungicide, and rodenticide, and toxic substances) CRITERIA AND HAZARDOUS AIR POLLUTANT INVENTORY (Inventory of air pollution sources) STATE MASTER (Pennsylvania database) - PCS-PAR223525, National Pollutant Discharge Elimination System Permit, AFS-22-2618811-1, AIR PROGRAM, PCS-PAR323506, National Pollutant Discharge Elimination System Permit, RCRIS-PAD987268687, HAZARDOUS WASTE PROGRAM National Pollutant Discharge Elimination System NON-MAJOR (Tracking pollutant discharge elimination systems) - permit National Pollutant Discharge Elimination System NON-MAJOR (Tracking pollutant discharge elimination systems) - permit Conditionally Exempt Small Quantity Generators, less than 100 kg/month of hazardous waste (Resource Conservation and Recovery Act (tracking hazardous waste)) TRI REPORTER (Tracking of toxic chemicals releasing facilities) Business SIC classification: PUBLIC BUILDING AND RELATED FURNITURE Business NAICS classification: INSTITUTIONAL FURNITURE MANUFACTURING. Organizations: CHILDCRAFT EDUCATION CORP (CONTACT/GENERAL)
, OPERNAME (CONTACT/OPERATOR)
Alternative names: BIRD IN HAND WOODWORKS INC, BIRD IN HAND WOODWORKS/E HEMPFIELD, BIRD IN HAND WOODWORKS SCH FURNITURE MFG PLT E HEMPFIELD
ARMSTRONG WORLD IND LANCASTER PLT (401 WEST LIBERTY STREET in LANCASTER, PA)
AIR MAJOR (AIRS/AFS) AIR MINOR (AIRS/AFS) (Integrated Compliance Information System) - ICIS-HQ-1985-0011, FORMAL ENFORCEMENT ACTION, ICIS-03-1983-0017, COMPLIANCE ACTIVITY (Tracking inspections of insecticide, fungicide, and rodenticide, and toxic substances) CRITERIA AND HAZARDOUS AIR POLLUTANT INVENTORY (Inventory of air pollution sources) STATE MASTER (Pennsylvania database) - AFS-23-0366390-6, AIR PROGRAM, PCS-PAR323512, National Pollutant Discharge Elimination System Permit, RCRIS-PAD001307792, HAZARDOUS WASTE PROGRAM, AFS-36-3353196-2, AIR PROGRAM HAZARDOUS WASTE BIENNIAL REPORTER (Resource Conservation and Recovery Act (tracking hazardous waste)) Large Quantity Generators, more that 1000 kg of hazardous waste/month (Resource Conservation and Recovery Act (tracking hazardous waste)) - notification TSD (Resource Conservation and Recovery Act (tracking hazardous waste)) - notification TRI REPORTER (Tracking of toxic chemicals releasing facilities) Business SIC classification: PLASTICS PRODUCTS; ASBESTOS PRODUCTS; ARCHITECTURAL AND ORNAMENTAL METALWORK; LINOLEUM, ASPHALTED-FELT-BASE, AND OTHER HARD SURFACE FLOOR COVERINGS Business NAICS classification: RESILIENT FLOOR COVERING MANUFACTURING. Organizations: ARMSTRONG WORLD INDUSTRIES INC (CONTACT/OWNER)
, ARMSTRONG WORLD INDUSTRIES, INC. (CONTACT/OWNER)
, BRANDENBURG INDUSTRIAL SERVICE COMPANY (CONTACT/OWNER)
Alternative names: ARMSTRONG LANCASTER FLOORING MFG, ARMSTRONG WORLD IND INC/CEILING, ARMSTRONG WORLD IND INC/FLOOR C, ARMSTRONG WORLD IND /FLOOR PLT, ARMSTRONG WORLD IND LANCASTER FLOOR
AMERIMAX HOME PROD (450 RICHARDSON DR. in LANCASTER, PA)
AIR SYNTHETIC MINOR (AIRS/AFS) COMPLIANCE ACTIVITY (Tracking inspections of insecticide, fungicide, and rodenticide, and toxic substances) CRITERIA AND HAZARDOUS AIR POLLUTANT INVENTORY (Inventory of air pollution sources) STATE MASTER (Pennsylvania database) - PCS-PAR203570, National Pollutant Discharge Elimination System Permit, AFS-23-2860729-2, AIR PROGRAM, RCRIS-PAD982580151, HAZARDOUS WASTE PROGRAM National Pollutant Discharge Elimination System NON-MAJOR (Tracking pollutant discharge elimination systems) - permit Small Quantity Generators, between 100 kg and 1000 kg of hazardous waste/month (Resource Conservation and Recovery Act (tracking hazardous waste)) - notification TRI REPORTER (Tracking of toxic chemicals releasing facilities) Business SIC classification: SHEET METALWORK Organizations: OPERNAME (CONTACT/OPERATOR)
, EURAMAX INTL PLC (CONTACT/OWNER)
, AMERIMAX HOME PRODUCTS, INC. (CONTACT/OWNER)
Alternative names: AMERIMAX HOME PROD I/HEMPFIELD
ARMSTRONG WORLD INDS (150 NORTH QUEEN STREET in LANCASTER, PA)
COMPLIANCE ACTIVITY (Tracking inspections of insecticide, fungicide, and rodenticide, and toxic substances) STATE MASTER (Pennsylvania database) - RCRIS-PAR000019828, HAZARDOUS WASTE PROGRAM Conditionally Exempt Small Quantity Generators, less than 100 kg/month of hazardous waste (Resource Conservation and Recovery Act (tracking hazardous waste)) - notification Organizations: ARMSTRONG WORLD INDUSTRIES INC (CONTACT/OWNER)
, ARMSTRONG WORLD INDUSTRIES, INC. (CONTACT/OWNER)
ATLANTIC SVC STA (111 W ORANGE ST-TANKS in LANCASTER, PA)
STATE MASTER (Pennsylvania database) - RCRIS-PAD987348216, HAZARDOUS WASTE PROGRAM Conditionally Exempt Small Quantity Generators, less than 100 kg/month of hazardous waste (Resource Conservation and Recovery Act (tracking hazardous waste)) - notification Organizations: OPERNAME (CONTACT/OPERATOR)
, ATLANTIC REFINING & MARKETING (CONTACT/OWNER)
, ATLANTIC REFINING & MARKETING CORPORATION (CONTACT/OWNER)
ARMSTRONG WORLD INDUSTRIES, INC. (313 W LIBERTY ST in LANCASTER, PA)
(Integrated Compliance Information System) - ICIS-03-1999-0226, FORMAL ENFORCEMENT ACTION, ICIS-03-1999-0231, Business SIC classification: MINERAL WOOL; COMMERCIAL, INDUSTRIAL, AND INSTITUTIONAL ELECTRIC LIGHTING FIXTURES; LINOLEUM, ASPHALTED-FELT-BASE, AND OTHER HARD SURFACE FLOOR COVERINGS
AAMCO TRANSMISSION (2001 COLUMBIA AVE in LANCASTER, PA)
Small Quantity Generators, between 100 kg and 1000 kg of hazardous waste/month (Resource Conservation and Recovery Act (tracking hazardous waste)) - notification Organizations: OPERNAME (CONTACT/OPERATOR)
, SHAH AJAY (CONTACT/OWNER)
AH HOSTETTER INC (PRANGLEY & RUBY ST in LANCASTER, PA)
Small Quantity Generators, between 100 kg and 1000 kg of hazardous waste/month (Resource Conservation and Recovery Act (tracking hazardous waste)) - notification Organizations: OPERNAME (CONTACT/OPERATOR)
, HOSTETTER BARBARA M (CONTACT/OWNER)
ARCHIES BODY SHOP (MARTICVILLE RD in LANCASTER, PA)
Small Quantity Generators, between 100 kg and 1000 kg of hazardous waste/month (Resource Conservation and Recovery Act (tracking hazardous waste)) - notification Organizations: OPERNAME (CONTACT/OPERATOR)
, WALDRON, ARCHIE (CONTACT/OWNER)
AMERICAN FIBERGLASS TECHNOLOGIES (1756 WABANK ROAD in LANCASTER, PA)
Conditionally Exempt Small Quantity Generators, less than 100 kg/month of hazardous waste (Resource Conservation and Recovery Act (tracking hazardous waste)) - notification Organizations: STABLER LAND CO (CONTACT/OWNER)
BJS GAS (110 CENTERVILLE RD in LANCASTER, PA)
Conditionally Exempt Small Quantity Generators, less than 100 kg/month of hazardous waste (Resource Conservation and Recovery Act (tracking hazardous waste)) Organizations: BJS WHOLESALE CLUB INC (CONTACT/OWNER)
109 S QUEEN STREET (109 S QUEEN STREET in LANCASTER, PA)
ENFORCEMENT/COMPLIANCE ACTIVITY (Integrated Compliance Information System)
340 S. QUEEN ST.; APT. #2 (340 S. QUEEN ST.; APT. #2 in LANCASTER, PA)
COMPLIANCE ACTIVITY (Tracking inspections of insecticide, fungicide, and rodenticide, and toxic substances)
Housing units lacking complete plumbing facilities: 0.2% Housing units lacking complete kitchen facilities: 0.8%
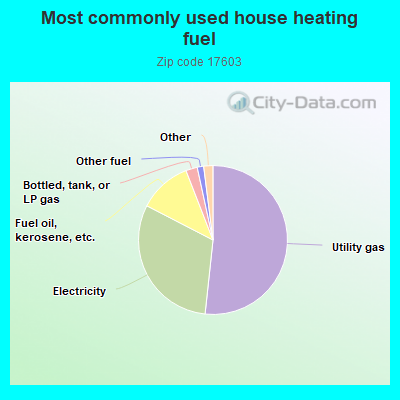
51.7%Utility gas
30.9%Electricity
11.5%Fuel oil, kerosene, etc.
2.5%Bottled, tank, or LP gas
1.4%Other fuel
0.7%No fuel used
0.5%Wood
Population in 1990: 55,173. Population change in the 1990s: +2,438 (+4.4%).
Place of birth for U.S.-born residents:
This state: 42,333
Northeast: 6,661
Midwest: 2,224
South: 3,993
West: 1,025
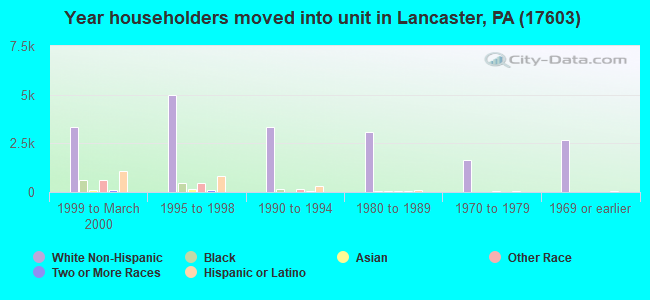
54% of the 17603 zip code residents lived in the same house 5 years ago. Out of people who lived in different houses, 71% lived in this county. Out of people who lived in different counties, 50% lived in Pennsylvania.
87% of the 17603 zip code residents lived in the same house 1 year ago. Out of people who lived in different houses, 64% moved from this county. Out of people who lived in different houses, 22% moved from different county within same state. Out of people who lived in different houses, 11% moved from different state. Out of people who lived in different houses, 1% moved from abroad.
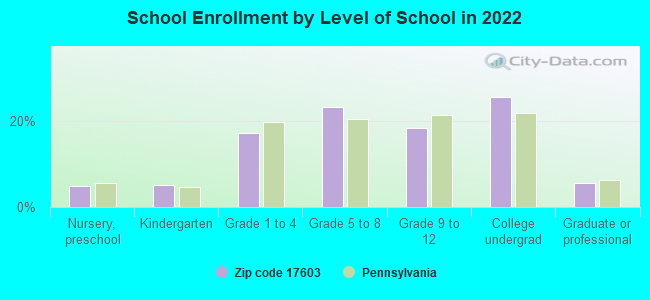
Private vs. public school enrollment:
Students in private schools in grades 1 to 8 (elementary and middle school): 997
Here:
14.3%
Pennsylvania:
15.7%
Students in private schools in grades 9 to 12 (high school): 394
Here:
12.6%
Pennsylvania:
13.4%
Students in private undergraduate colleges: 2,397
Here:
54.5%
Pennsylvania:
39.8%
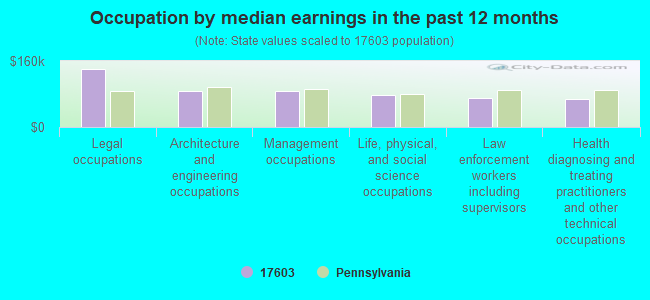
Occupation by median earnings in the past 12 months ($)
141,045Legal occupations
88,429Architecture and engineering occupations
87,062Management occupations
78,580Life, physical, and social science occupations
70,839Law enforcement workers including supervisors
68,762Health diagnosing and treating practitioners and other technical occupations
Companies with biggest federal contracts located in this zip code (LANCASTER, PA):
L-3 COMMUNICATIONS CORPORATION (101 N QUEEN ST) : $118,462,117 in 51 contractsfrom 2002 to 2006
Contracts for Fuzes and Primers, Ammunition, 75 mm through 125 mm, Grenades, Miscellaneous Fire Control Equipment, and moreby Army, Air Force, Navy Signed by year:2000: $0; 2001: $0; 2002: $1,837,120; 2003: $34,960,243; 2004: $40,833,257; 2005: $13,416,344; 2006: $27,415,153.
Biggest contracts:
$23,500,253 with Army for Fuzes and Primers. Signed on 2003-02-27. Completion date: 2006-12-30.
$17,664,978 with Army for Ammunition, 75 mm through 125 mm. Signed on 2006-03-30. Completion date: 2008-03-28.
$16,861,815 with Army for Fuzes and Primers. Signed on 2004-02-27. Completion date: 2006-12-30.
$9,765,790 with Army for Ammunition, 75 mm through 125 mm. Signed on 2004-12-20. Completion date: 2004-11-05.
BULOVA TECHNOLOGIES LLC (101 N QUEEN ST; small business) : $111,585,243 in 38 contractsfrom 2000 to 2006
Contracts for Fuzes and Primers, Pyrotechnics, Cartridge and Propellant Actuated Devices and Components, Guided Missile Remote Control Systems, and moreby Army, Navy, Defense Logistics Agency Signed by year:2000: $27,974,040; 2001: $33,794,785; 2002: $17,124,192; 2003: $0; 2004: $16,766,940; 2005: $4,604,677; 2006: $11,320,609.
Biggest contracts:
$21,191,302 with Army for Fuzes and Primers. Signed on 2001-09-10. Completion date: 2010-09-10.
$20,801,885, same as above.Signed on 2000-04-28. Completion date: 2002-04-30.
$16,825,012, same as above.Signed on 2002-02-28. Completion date: 2005-08-03.
$16,766,940, same as above.Signed on 2004-12-23. Completion date: 2006-05-31.
SUSQUEHANNA ASSN FOR THE BLIND (244 N QUEEN ST) : $16,152,396 in 21 contractsfrom 1999 to 2006
Contracts for Armor, Personal, Guns, through 30 mm, Household Furnishings, Miscellaneous Chemical Specialties, and moreby Defense Logistics Agency Signed by year:2000: $4,052,460; 2001: $57,604; 2002: $4,559,480; 2003: $173,426; 2004: $5,009,136; 2005: $1,490,637; 2006: $773,383.
Biggest contracts:
$4,530,870 with Defense Logistics Agency for Armor, Personal. Signed on 2002-01-18. Completion date: 2003-03-26.
$4,003,600, same as above.Signed on 2000-04-10. Completion date: 2002-03-25.
$2,208,000, same as above.Signed on 2004-01-23. Completion date: 2004-05-04.
$1,943,040, same as above.Signed on 2004-07-29. Completion date: 2004-07-29.
HERLEY INDUSTRIES, INC D/B/A (3061 INDUSTRY DRIVE) : $15,378,359 in 31 contractsfrom 2001 to 2006
Contracts for Miscellaneous Communication Equipment, Radar Equipment, Airborne, Converters, Electrical, Nonrotating, Electrical and Electronic assemblies, Boards, Cards, and Associated Hardware, and moreby Navy, Defense Logistics Agency Signed by year:2000: $0; 2001: $1,543,131; 2002: $4,148,103; 2003: $6,201,312; 2004: $3,185,590; 2005: $219,823; 2006: $80,400.
Biggest contracts:
$3,498,192 with Navy for Miscellaneous Communication Equipment. Signed on 2002-03-29. Completion date: 2003-12-31.
$3,151,890, same as above.Signed on 2003-06-09. Completion date: 2005-06-30.
$3,088,176, same as above.Signed on 2004-06-14. Completion date: 2006-06-30.
$862,100, same as above.Signed on 2003-08-20. Completion date: 2004-07-10.
RETTEW ASSOCIATES, INC (3020 COLUMBIA AVENUE) : $804,457 in 23 contractsfrom 2001 to 2005
Contracts for Other Architect and Engineering Services, A&E Management Engineering Services, Architect - Engineer Services (including landscaping, interior layout, and designing), Other Non-Building Structures, and moreby U.S. Army Corps of Engineers - civil program financing only, U.S. Fish and Wildlife Service, National Park Service Signed by year:2000: $0; 2001: $621,946; 2002: $160,800; 2003: $17,061; 2004: $2,850; 2005: $1,800; 2006: $0.
Biggest contracts:
$125,400 with U.S. Army Corps of Engineers - civil program financing only for Other Architect and Engineering Services. Signed on 2001-09-21. Completion date: 2001-11-21.
$96,346, same as above.Signed on 2001-05-02. Completion date: 2001-06-29.
$86,000, same as above.Signed on 2002-09-06. Completion date: 2002-12-20.
$75,000, same as above.Signed on 2001-04-03. Completion date: 2001-07-19.
KUNZLER & COMPANY INC (652 MANOR ST) : $446,387 in 6 contractsfrom 2004 to 2006
Contracts for Food Items For Resale by Defense Commissary Agency Signed by year:2000: $0; 2001: $0; 2002: $0; 2003: $0; 2004: $123,604; 2005: $218,907; 2006: $103,876.
Biggest contracts:
$123,604 with Defense Commissary Agency for Food Items For Resale. Signed on 2004-10-01. Completion date: 2005-02-28.
$103,876, same as above.Signed on 2006-01-01. Completion date: 2006-03-31.
$94,869, same as above.Signed on 2005-10-01. Completion date: 2005-12-31.
$69,483, same as above.Signed on 2005-04-01. Completion date: 2005-08-31.
CHOICE SECURITY SERVICES, LLC (101 GOOD DR; small business) : $61,012 in 3 contractsfrom 2005 to 2006
$48,903 with Department of Defense for Other ADP and Telecommunications Services (includes data storage on tapes, compact disks, etc.). Signed on 2005-03-01. Completion date: 2006-02-28.
$6,721, same as above.Signed on 2005-04-21. Completion date: 2006-02-28.
$5,388 with Defense Information Systems Agency for Other ADP and Telecommunications Services (includes data storage on tapes, compact disks, etc.). Signed on 2006-03-06. Completion date: 2007-02-28.
ANDERSON MATERIAL HANDLING CO (223 WOHLSEN WAY; small business) : $39,557 in 7 contractsfrom 2004 to 2006
Contracts for Construction of Structures and Facilities -- Miscellaneous Buildings, Miscellaneous Materials Handling Equipment, Miscellaneous Items, Hydraulic and Pneumatic Presses, Power Driven by Navy, Defense Logistics Agency Signed by year:2000: $0; 2001: $0; 2002: $0; 2003: $0; 2004: $22,649; 2005: $14,336; 2006: $2,572.
Biggest contracts:
$17,989 with Navy for Construction of Structures and Facilities -- Miscellaneous Buildings. Signed on 2004-09-01. Completion date: 2004-11-01.
$6,379 with Defense Logistics Agency for Miscellaneous Materials Handling Equipment. Signed on 2005-03-02. Completion date: 2005-03-31.
$4,660, same as above.Signed on 2004-12-07. Completion date: 2005-01-01.
$3,840 with Defense Logistics Agency for Miscellaneous Items. Taking place in VA. Signed on 2005-04-26. Completion date: 2005-05-26.
D L MYERS (3023 COLUMBIA AVE; small business) : $33,770 in 3 contractsfrom 2005 to 2006
$25,945 with Defense Logistics Agency for Batteries, Rechargeable. Signed on 2005-07-23. Completion date: 2005-08-22.
$4,800 with Defense Logistics Agency for Batteries, Nonrechargeable. Signed on 2006-05-25. Completion date: 2006-06-15.
$3,025 with Army for Batteries, Nonrechargeable. Signed on 2005-05-04. Completion date: 2005-05-20.
COMMAND SCHOOL INC (117 D S WEST END AVE; small business) : $9,000 in 2 contractsin 2004
$12,000 with Army for Training/Curriculum Development. Taking place in AL. Signed on 2004-07-26. Completion date: 2004-09-16.
-$3,000, same as above.Signed on 2004-11-23. Completion date: 2004-09-16.
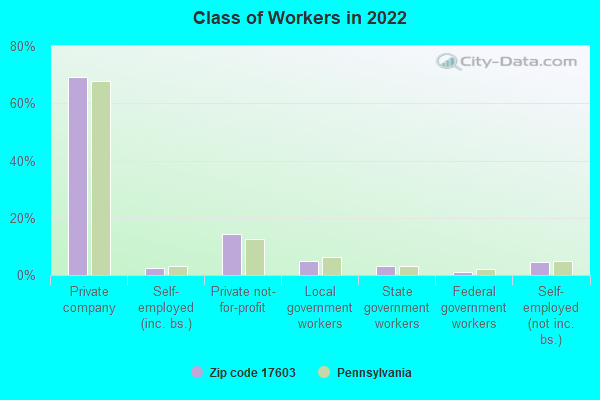
Top industries in this zip code by the number of employees in 2005:
Health Care and Social Assistance: Offices of Physicians (except Mental Health Specialists) (100-249: 1, 50-99: 3, 20-49: 6, 10-19: 6, 5-9: 8, 1-4: 19)
Finance and Insurance: Third Party Administration of Insurance and Pension Funds (250-499: 1, 20-49: 1)
People in group quarters in 2010:
874 people in college/university student housing
328 people in nursing facilities/skilled-nursing facilities
264 people in emergency and transitional shelters (with sleeping facilities) for people experiencing homelessness
58 people in residential treatment centers for juveniles (non-correctional)
51 people in group homes intended for adults
27 people in other noninstitutional facilities
11 people in residential treatment centers for adults
People in group quarters in 2000:
1,278 people in college dormitories (includes college quarters off campus)
469 people in nursing homes
279 people in other noninstitutional group quarters
90 people in other group homes
33 people in other types of correctional institutions
25 people in homes for the mentally ill
18 people in homes for the mentally retarded
16 people in religious group quarters
Home Mortgage Disclosure Act Aggregated Statistics For Year 2009 (Based on 7 full and 24 partial tracts)
A) FHA, FSA/RHS & VA Home Purchase Loans
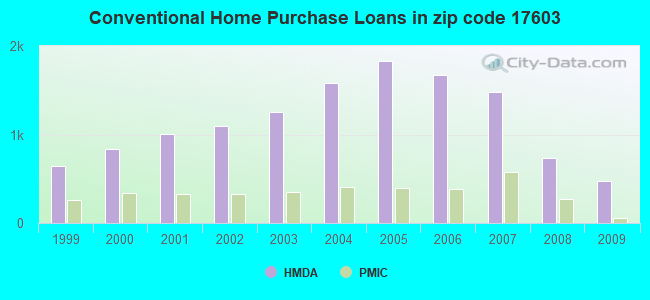
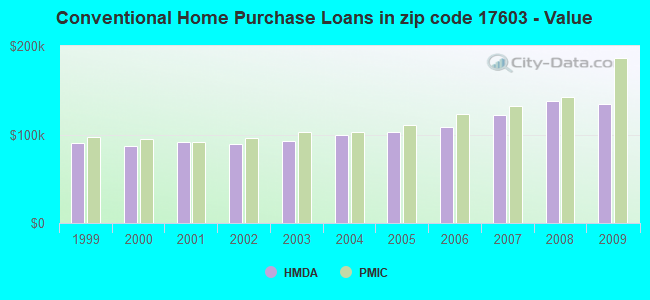
B) Conventional Home Purchase Loans
C) Refinancings
D) Home Improvement Loans
E) Loans on Dwellings For 5+ Families
F) Non-occupant Loans on < 5 Family Dwellings (A B C & D)
G) Loans On Manufactured Home Dwelling (A B C & D)
Number
Average Value
Number
Average Value
Number
Average Value
Number
Average Value
Number
Average Value
Number
Average Value
Number
Average Value
LOANS ORIGINATED
651
$141,313
475
$133,916
1,556
$145,498
196
$64,918
8
$278,576
171
$107,374
9
$36,932
APPLICATIONS APPROVED, NOT ACCEPTED
27
$124,701
32
$167,894
132
$136,791
40
$29,163
0
$0
11
$92,606
13
$39,658
APPLICATIONS DENIED
94
$146,577
82
$97,341
615
$143,859
146
$43,016
7
$728,279
50
$77,745
41
$40,334
APPLICATIONS WITHDRAWN
54
$125,664
31
$135,779
385
$142,718
17
$54,356
4
$465,420
29
$126,130
0
$0
FILES CLOSED FOR INCOMPLETENESS
16
$147,240
13
$91,694
75
$146,843
4
$68,440
0
$0
1
$212,000
2
$43,500
Aggregated Statistics For Year 2008 (Based on 7 full and 24 partial tracts)
A) FHA, FSA/RHS & VA Home Purchase Loans
B) Conventional Home Purchase Loans
C) Refinancings
D) Home Improvement Loans
E) Loans on Dwellings For 5+ Families
F) Non-occupant Loans on < 5 Family Dwellings (A B C & D)
G) Loans On Manufactured Home Dwelling (A B C & D)
Number
Average Value
Number
Average Value
Number
Average Value
Number
Average Value
Number
Average Value
Number
Average Value
Number
Average Value
LOANS ORIGINATED
502
$136,603
730
$137,966
1,007
$114,210
304
$36,720
23
$1,119,736
271
$104,061
25
$41,600
APPLICATIONS APPROVED, NOT ACCEPTED
15
$115,639
76
$134,768
204
$108,099
47
$29,871
3
$130,400
35
$74,387
27
$47,939
APPLICATIONS DENIED
78
$138,067
132
$114,045
765
$122,338
306
$63,285
9
$546,350
102
$80,413
50
$41,619
APPLICATIONS WITHDRAWN
27
$133,166
50
$162,214
269
$135,115
48
$51,798
7
$2,230,981
30
$93,024
3
$92,143
FILES CLOSED FOR INCOMPLETENESS
3
$118,333
44
$122,325
55
$148,818
4
$78,845
0
$0
9
$149,888
3
$45,333
Aggregated Statistics For Year 2007 (Based on 7 full and 24 partial tracts)
A) FHA, FSA/RHS & VA Home Purchase Loans
B) Conventional Home Purchase Loans
C) Refinancings
D) Home Improvement Loans
E) Loans on Dwellings For 5+ Families
F) Non-occupant Loans on < 5 Family Dwellings (A B C & D)
G) Loans On Manufactured Home Dwelling (A B C & D)
Number
Average Value
Number
Average Value
Number
Average Value
Number
Average Value
Number
Average Value
Number
Average Value
Number
Average Value
LOANS ORIGINATED
240
$125,046
1,479
$121,944
1,342
$104,920
481
$37,997
31
$692,276
386
$90,938
25
$48,577
APPLICATIONS APPROVED, NOT ACCEPTED
9
$121,764
138
$111,742
315
$100,144
80
$45,752
1
$209,470
46
$78,584
24
$41,715
APPLICATIONS DENIED
23
$133,724
240
$100,008
1,026
$105,977
380
$55,538
3
$300,403
138
$80,255
36
$38,548
APPLICATIONS WITHDRAWN
17
$124,651
165
$125,796
446
$116,681
37
$75,442
6
$654,155
48
$66,273
4
$66,630
FILES CLOSED FOR INCOMPLETENESS
0
$0
55
$103,409
121
$167,438
5
$46,350
1
$187,760
18
$212,252
0
$0
Aggregated Statistics For Year 2006 (Based on 7 full and 24 partial tracts)
A) FHA, FSA/RHS & VA Home Purchase Loans
B) Conventional Home Purchase Loans
C) Refinancings
D) Home Improvement Loans
E) Loans on Dwellings For 5+ Families
F) Non-occupant Loans on < 5 Family Dwellings (A B C & D)
G) Loans On Manufactured Home Dwelling (A B C & D)
Number
Average Value
Number
Average Value
Number
Average Value
Number
Average Value
Number
Average Value
Number
Average Value
Number
Average Value
LOANS ORIGINATED
262
$115,028
1,669
$108,889
1,532
$96,063
506
$35,028
17
$722,011
465
$83,661
27
$32,164
APPLICATIONS APPROVED, NOT ACCEPTED
4
$135,265
135
$97,793
339
$97,510
55
$35,031
0
$0
58
$63,272
7
$48,551
APPLICATIONS DENIED
21
$107,712
338
$82,900
1,133
$103,569
290
$42,808
8
$181,699
161
$70,515
23
$42,106
APPLICATIONS WITHDRAWN
17
$82,132
156
$96,164
750
$115,396
28
$80,019
0
$0
61
$72,848
5
$73,088
FILES CLOSED FOR INCOMPLETENESS
0
$0
30
$86,697
149
$123,685
2
$52,410
0
$0
8
$76,552
2
$41,500
Aggregated Statistics For Year 2005 (Based on 7 full and 24 partial tracts)
A) FHA, FSA/RHS & VA Home Purchase Loans
B) Conventional Home Purchase Loans
C) Refinancings
D) Home Improvement Loans
E) Loans on Dwellings For 5+ Families
F) Non-occupant Loans on < 5 Family Dwellings (A B C & D)
G) Loans On Manufactured Home Dwelling (A B C & D)
Number
Average Value
Number
Average Value
Number
Average Value
Number
Average Value
Number
Average Value
Number
Average Value
Number
Average Value
LOANS ORIGINATED
239
$108,252
1,831
$102,444
1,673
$98,951
442
$34,641
13
$412,058
503
$72,605
34
$36,574
APPLICATIONS APPROVED, NOT ACCEPTED
8
$96,788
151
$93,026
318
$88,808
54
$36,603
2
$142,820
54
$65,495
21
$29,287
APPLICATIONS DENIED
18
$96,084
372
$91,941
1,484
$97,973
309
$32,172
1
$103,000
142
$62,500
53
$37,373
APPLICATIONS WITHDRAWN
18
$105,941
186
$111,168
964
$109,769
112
$118,467
0
$0
68
$86,753
3
$49,143
FILES CLOSED FOR INCOMPLETENESS
3
$93,780
51
$121,267
157
$127,431
8
$32,984
0
$0
10
$89,277
0
$0
Aggregated Statistics For Year 2004 (Based on 7 full and 24 partial tracts)
A) FHA, FSA/RHS & VA Home Purchase Loans
B) Conventional Home Purchase Loans
C) Refinancings
D) Home Improvement Loans
E) Loans on Dwellings For 5+ Families
F) Non-occupant Loans on < 5 Family Dwellings (A B C & D)
G) Loans On Manufactured Home Dwelling (A B C & D)
Number
Average Value
Number
Average Value
Number
Average Value
Number
Average Value
Number
Average Value
Number
Average Value
Number
Average Value
LOANS ORIGINATED
317
$99,463
1,584
$99,639
1,827
$89,238
454
$29,108
30
$308,408
485
$68,379
17
$48,426
APPLICATIONS APPROVED, NOT ACCEPTED
8
$121,456
121
$105,342
414
$86,075
61
$36,790
2
$374,720
50
$66,707
10
$33,171
APPLICATIONS DENIED
32
$92,474
209
$78,333
1,507
$89,641
286
$32,235
0
$0
135
$50,027
42
$41,516
APPLICATIONS WITHDRAWN
23
$91,523
101
$121,058
955
$102,130
53
$46,506
3
$68,373
49
$69,678
3
$50,800
FILES CLOSED FOR INCOMPLETENESS
1
$99,320
38
$95,241
157
$113,748
20
$36,782
0
$0
13
$79,803
0
$0
Aggregated Statistics For Year 2003 (Based on 7 full and 24 partial tracts)
A) FHA, FSA/RHS & VA Home Purchase Loans
B) Conventional Home Purchase Loans
C) Refinancings
D) Home Improvement Loans
E) Loans on Dwellings For 5+ Families
F) Non-occupant Loans on < 5 Family Dwellings (A B C & D)
Number
Average Value
Number
Average Value
Number
Average Value
Number
Average Value
Number
Average Value
Number
Average Value
LOANS ORIGINATED
406
$91,869
1,251
$92,099
3,566
$94,828
323
$24,971
18
$423,378
468
$66,317
APPLICATIONS APPROVED, NOT ACCEPTED
22
$78,583
107
$79,996
560
$89,731
67
$32,424
1
$1,413,000
56
$55,349
APPLICATIONS DENIED
32
$88,856
172
$70,685
1,460
$88,703
158
$20,428
1
$115,550
119
$56,837
APPLICATIONS WITHDRAWN
12
$81,472
62
$98,654
1,039
$100,969
34
$29,896
2
$207,020
37
$61,193
FILES CLOSED FOR INCOMPLETENESS
6
$77,080
20
$112,528
177
$105,595
11
$40,410
0
$0
10
$65,121
Aggregated Statistics For Year 2002 (Based on 7 full and 24 partial tracts)
A) FHA, FSA/RHS & VA Home Purchase Loans
B) Conventional Home Purchase Loans
C) Refinancings
D) Home Improvement Loans
E) Loans on Dwellings For 5+ Families
F) Non-occupant Loans on < 5 Family Dwellings (A B C & D)
Number
Average Value
Number
Average Value
Number
Average Value
Number
Average Value
Number
Average Value
Number
Average Value
LOANS ORIGINATED
498
$90,071
1,101
$89,564
1,859
$94,093
342
$18,390
19
$2,193,650
379
$61,231
APPLICATIONS APPROVED, NOT ACCEPTED
15
$88,681
87
$81,144
411
$92,103
62
$25,005
0
$0
36
$64,863
APPLICATIONS DENIED
42
$77,663
166
$74,673
950
$82,998
164
$17,056
2
$315,040
78
$78,045
APPLICATIONS WITHDRAWN
15
$68,671
51
$95,347
729
$96,542
30
$25,077
0
$0
36
$86,894
FILES CLOSED FOR INCOMPLETENESS
5
$88,896
35
$90,045
110
$1,118,859
5
$32,486
0
$0
12
$41,154
Aggregated Statistics For Year 2001 (Based on 7 full and 24 partial tracts)
A) FHA, FSA/RHS & VA Home Purchase Loans
B) Conventional Home Purchase Loans
C) Refinancings
D) Home Improvement Loans
E) Loans on Dwellings For 5+ Families
F) Non-occupant Loans on < 5 Family Dwellings (A B C & D)
Number
Average Value
Number
Average Value
Number
Average Value
Number
Average Value
Number
Average Value
Number
Average Value
LOANS ORIGINATED
579
$89,839
1,009
$91,259
1,689
$84,778
311
$19,426
16
$694,598
260
$55,195
APPLICATIONS APPROVED, NOT ACCEPTED
20
$84,634
99
$72,664
280
$79,031
49
$32,142
3
$605,507
24
$49,324
APPLICATIONS DENIED
40
$79,874
213
$56,467
886
$68,992
206
$14,178
5
$956,100
85
$44,125
APPLICATIONS WITHDRAWN
33
$85,986
55
$89,237
545
$89,096
62
$28,314
4
$621,845
26
$56,950
FILES CLOSED FOR INCOMPLETENESS
7
$52,450
8
$169,259
67
$75,965
9
$14,579
0
$0
4
$57,865
Aggregated Statistics For Year 2000 (Based on 7 full and 24 partial tracts)
A) FHA, FSA/RHS & VA Home Purchase Loans
B) Conventional Home Purchase Loans
C) Refinancings
D) Home Improvement Loans
E) Loans on Dwellings For 5+ Families
F) Non-occupant Loans on < 5 Family Dwellings (A B C & D)
Number
Average Value
Number
Average Value
Number
Average Value
Number
Average Value
Number
Average Value
Number
Average Value
LOANS ORIGINATED
510
$82,854
841
$87,569
626
$65,976
372
$20,451
16
$1,002,843
172
$49,476
APPLICATIONS APPROVED, NOT ACCEPTED
19
$72,567
89
$60,248
199
$63,480
77
$22,545
0
$0
28
$55,050
APPLICATIONS DENIED
34
$74,910
248
$54,434
655
$52,225
241
$16,118
0
$0
53
$50,437
APPLICATIONS WITHDRAWN
36
$75,354
93
$80,853
338
$65,235
35
$26,728
1
$1,043,200
22
$51,041
FILES CLOSED FOR INCOMPLETENESS
7
$75,189
21
$56,671
61
$76,967
4
$38,918
0
$0
3
$55,630
Aggregated Statistics For Year 1999 (Based on 9 full and 11 partial tracts)
A) FHA, FSA/RHS & VA Home Purchase Loans
B) Conventional Home Purchase Loans
C) Refinancings
D) Home Improvement Loans
E) Loans on Dwellings For 5+ Families
F) Non-occupant Loans on < 5 Family Dwellings (A B C & D)
2002 - 2018 National Fire Incident Reporting System (NFIRS) incidents
According to the data from the years 2002 - 2018 the average number of fire incidents per year is 195. The highest number of reported fire incidents - 310 took place in 2007, and the least - 83 in 2014. The data has an increasing trend.
When looking into fire subcategories, the most reports belonged to: Structure Fires (69.8%), and Outside Fires (17.7%).
Fire incident types reported to NFIRS in Zip Code 17603


 Nearest zip codes: 17601, 17551, 17520, 17606, 17602, 17554.


 According to the data from the years 2002 - 2018 the average number of fire incidents per year is 195. The highest number of reported fire incidents - 310 took place in 2007, and the least - 83 in 2014. The data has an increasing trend.
 When looking into fire subcategories, the most reports belonged to: Structure Fires (69.8%), and Outside Fires (17.7%).