Lancaster, Pennsylvania

Lancaster: Sky over Lancaster
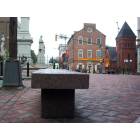
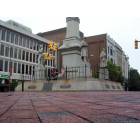
Lancaster: Lancaster Downtown Square
Lancaster: A familur site in Lancaster, PA
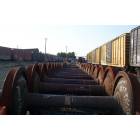
Lancaster: Lancaster Railroad Yard

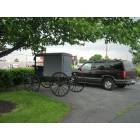
Lancaster: Amish Buggy - "Not far from Home"
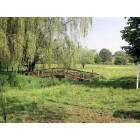
Lancaster: Stream in Lancaster, PA

Lancaster: Downtown Lancaster, the Watt & Shand building
Lancaster: Lancaster Downtown Square
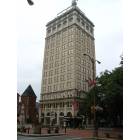
Lancaster: downtown; griest building
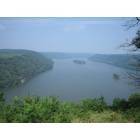
Lancaster: The mighty Susquahanna River, Lancaster, PA
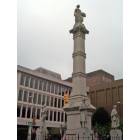
Lancaster: Lancaster Downtown Square
- see
50
more - add
your
Submit your own pictures of this city and show them to the world
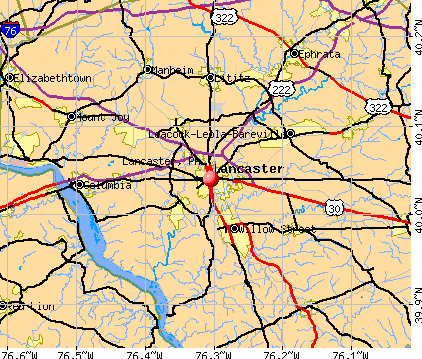
- OSM Map
- General Map
- Google Map
- MSN Map
Population change since 2000: +2.0%
 |
| Males: 27,360 | |
| Females: 30,093 |
| Median resident age: | 32.1 years |
| Pennsylvania median age: | 40.9 years |
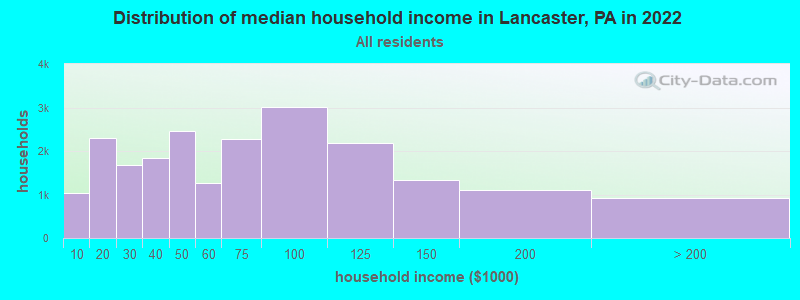
| Lancaster: | $61,938 |
| PA: | $71,798 |
Estimated per capita income in 2022: $29,533 (it was $13,955 in 2000)
Lancaster city income, earnings, and wages data
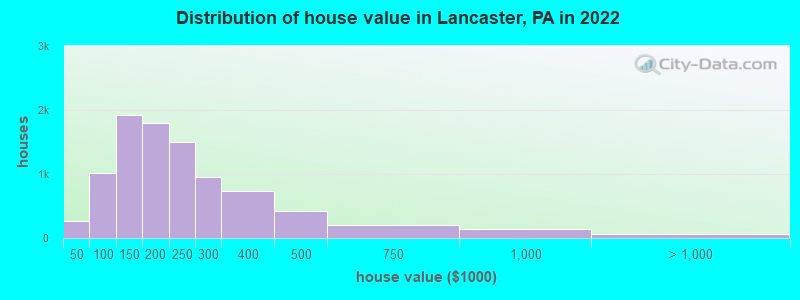
Estimated median house or condo value in 2022: $195,571 (it was $71,900 in 2000)
| Lancaster: | $195,571 |
| PA: | $245,500 |
Mean prices in 2022: all housing units: $246,205; detached houses: $248,276; townhouses or other attached units: $223,318; in 2-unit structures: $285,294; in 3-to-4-unit structures: $342,607; in 5-or-more-unit structures: $677,892; mobile homes: $46,648
Median gross rent in 2022: $1,100.
(10.8% for White Non-Hispanic residents, 18.0% for Black residents, 26.1% for Hispanic or Latino residents, 22.7% for American Indian residents, 42.2% for other race residents, 20.8% for two or more races residents)
Detailed information about poverty and poor residents in Lancaster, PA


- 23,70440.6%Hispanic
- 22,33538.3%White alone
- 8,23814.1%Black alone
- 3,5856.1%Two or more races
- 1,5862.7%Asian alone
- 1760.3%Other race alone
- 590.1%Native Hawaiian and Other
Pacific Islander alone - 50.01%American Indian alone
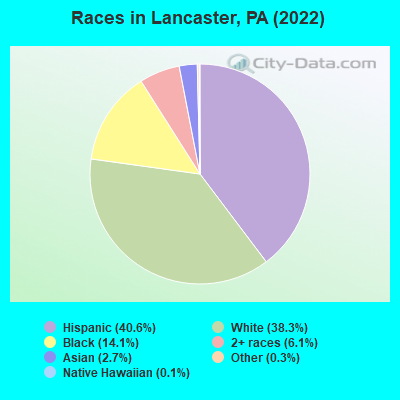
Races in Lancaster detailed stats: ancestries, foreign born residents, place of birth
According to our research of Pennsylvania and other state lists, there were 345 registered sex offenders living in Lancaster, Pennsylvania as of April 27, 2024.
The ratio of all residents to sex offenders in Lancaster is 174 to 1.
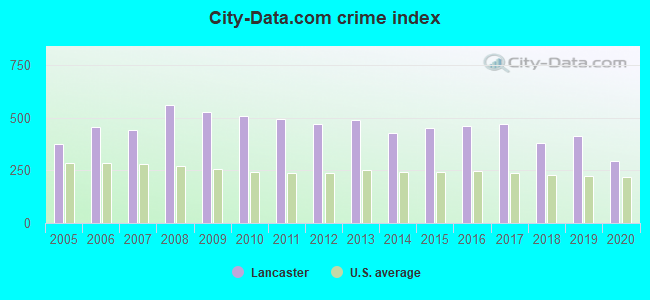
The City-Data.com crime index weighs serious crimes and violent crimes more heavily. Higher means more crime, U.S. average is 246.1. It adjusts for the number of visitors and daily workers commuting into cities.
- means the value is smaller than the state average.- means the value is about the same as the state average.
- means the value is bigger than the state average.
- means the value is much bigger than the state average.
Crime rate in Lancaster detailed stats: murders, rapes, robberies, assaults, burglaries, thefts, arson
Full-time law enforcement employees in 2021, including police officers: 163 (134 officers - 125 male; 9 female).
| Officers per 1,000 residents here: | 2.27 |
| Pennsylvania average: | 2.55 |
 Recent articles from our blog. Our writers, many of them Ph.D. graduates or candidates, create easy-to-read articles on a wide variety of topics.

 | Lancaster - 2024 thoughts on a move (13 replies) |
| Live in Lancaster City without a car? (14 replies) |
| Lancaster - city vs suburbs, safe vs sketchy, other questions (10 replies) |
| Harrisburg v. Lancaster (21 replies) |
| Lancaster is awesome (23 replies) |
| Insights of all kinds wanted on move to Lancaster (23 replies) |
Latest news from Lancaster, PA collected exclusively by city-data.com from local newspapers, TV, and radio stations
Ancestries: German (9.2%), American (3.7%), Irish (3.6%), Italian (1.7%), English (1.6%), African (1.4%).
Current Local Time: EST time zone
Incorporated on 03/20/1818
Elevation: 368 feet
Land area: 7.40 square miles.
Population density: 7,766 people per square mile (high).
7,705 residents are foreign born (7.5% Latin America, 2.5% Asia, 2.4% Africa).
| This city: | 13.2% |
| Pennsylvania: | 7.3% |
Median real estate property taxes paid for housing units with mortgages in 2022: $3,115 (1.6%)
Median real estate property taxes paid for housing units with no mortgage in 2022: $3,216 (1.7%)
Nearest city with pop. 200,000+: Baltimore, MD  (53.3 miles , pop. 651,154).
Nearest city with pop. 1,000,000+: Philadelphia, PA (61.5 miles , pop. 1,517,550).
Nearest cities:
), ), ), ), ), Latitude: 40.04 N, Longitude: 76.30 W
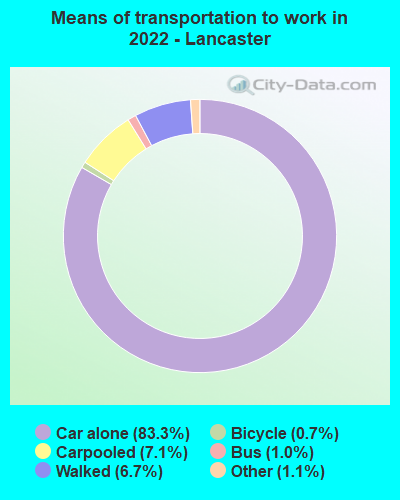
Daytime population change due to commuting: +15,276 (+26.2%)
Workers who live and work in this city: 12,042 (41.6%)
Area code: 717
Lancaster tourist attractions:
- Amish Farm and House - Lancaster, Pennsylvania - Working Farm and Museum
- Best Western Eden Resort & Suites - Lancaster, Pennsylvania - Hotel
- Wheatland in Lancaster was President James Buchanan's Favored Home
- The Central Market in Lancaster is More than a Fruit and Vegetable Stand
- Amish Country in Lancaster is Home to a Unique Culture
- Hands-on House - Lancaster, Pennsylvania - Children's Museum
- Hotel Brunswick - Lancaster, Pennsylvania - Hotel
- Lancaster Arts Hotel - Lancaster, Pennsylvania - Boutique Hotel Featuring an Art Gallery
- Lancaster Host Resort and Conference Center - Lancaster, Pennsylvania Hotel and Conference Center with Golf Course
- Lancaster Quilt & Textile Museum - Lancaster, Pennsylvania - Quilt & Textile Museum
- Landis Valley Museum - Lancaster, Pennsylvania - Living History Village and Farm
- Mennonite Information Center - Lancaster, Pennsylvania - Mennonite and Amish Information Center
- Courtyard by Marriott Lancaster
- Park City Center - Lancaster, Pennsylvania - indoor shopping center and dining location
- Rockvale Square Outlets - Lancaster, Pennsylvania - outlet shopping center with over 100 stores
- Tanger Outlets Lancaster - Lancaster, Pennsylvania - Shopping Outlet
- Willow Valley Resort & Conference Center - Lancaster, Pennsylvania Hotel in Pennsylvania Dutch Country
Lancaster, Pennsylvania accommodation & food services, waste management - Economy and Business Data
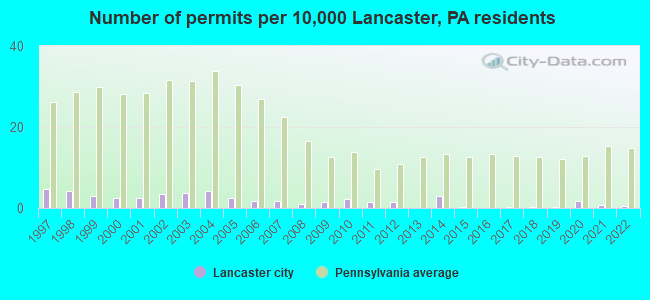
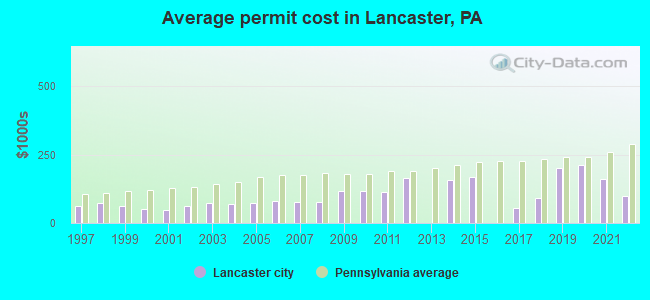
Single-family new house construction building permits:
- 2022: 3 buildings, average cost: $100,000
- 2021: 4 buildings, average cost: $161,000
- 2020: 10 buildings, average cost: $211,000
- 2019: 1 building, cost: $200,000
- 2018: 1 building, cost: $91,000
- 2017: 2 buildings, average cost: $55,200
- 2015: 2 buildings, average cost: $166,500
- 2014: 16 buildings, average cost: $156,400
- 2012: 8 buildings, average cost: $163,900
- 2011: 8 buildings, average cost: $112,800
- 2010: 13 buildings, average cost: $118,100
- 2009: 9 buildings, average cost: $116,700
- 2008: 5 buildings, average cost: $78,100
- 2007: 10 buildings, average cost: $78,100
- 2006: 10 buildings, average cost: $79,300
- 2005: 14 buildings, average cost: $75,100
- 2004: 23 buildings, average cost: $70,200
- 2003: 21 buildings, average cost: $71,600
- 2002: 20 buildings, average cost: $64,100
- 2001: 14 buildings, average cost: $49,200
- 2000: 14 buildings, average cost: $51,700
- 1999: 17 buildings, average cost: $62,800
- 1998: 24 buildings, average cost: $74,200
- 1997: 27 buildings, average cost: $61,500
| Here: | 2.9% |
| Pennsylvania: | 2.9% |
Population change in the 1990s: +381 (+0.7%).
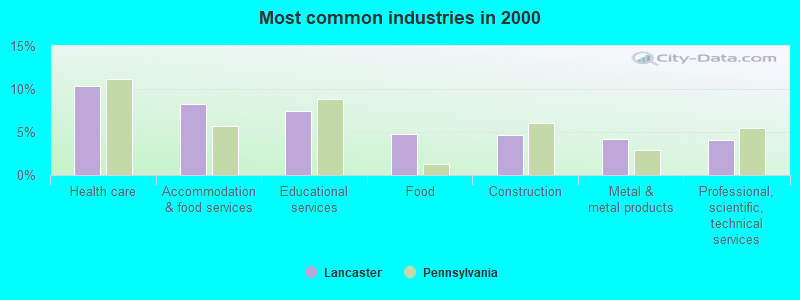
- Health care (10.3%)
- Accommodation & food services (8.3%)
- Educational services (7.4%)
- Food (4.8%)
- Construction (4.7%)
- Metal & metal products (4.2%)
- Professional, scientific, technical services (4.1%)
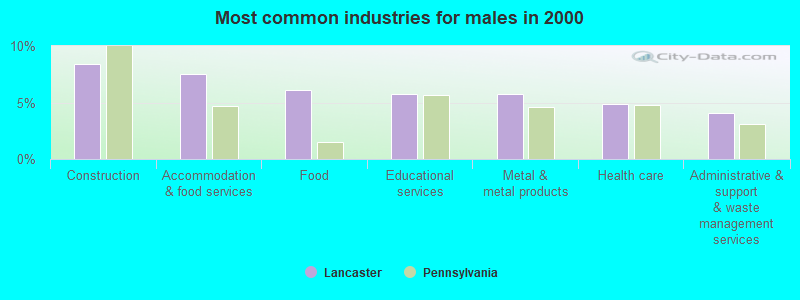
- Construction (8.4%)
- Accommodation & food services (7.5%)
- Food (6.1%)
- Educational services (5.8%)
- Metal & metal products (5.7%)
- Health care (4.8%)
- Administrative & support & waste management services (4.1%)
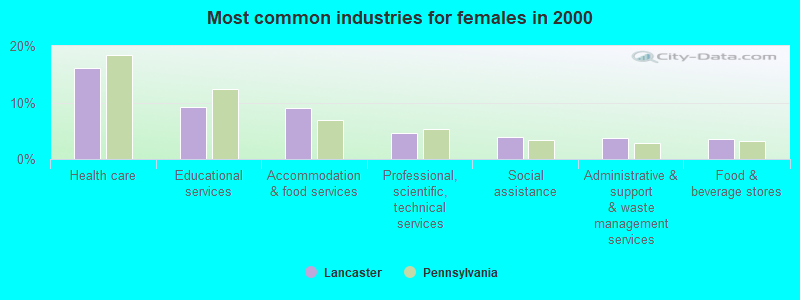
- Health care (16.0%)
- Educational services (9.2%)
- Accommodation & food services (9.1%)
- Professional, scientific, technical services (4.5%)
- Social assistance (3.9%)
- Administrative & support & waste management services (3.7%)
- Food & beverage stores (3.5%)
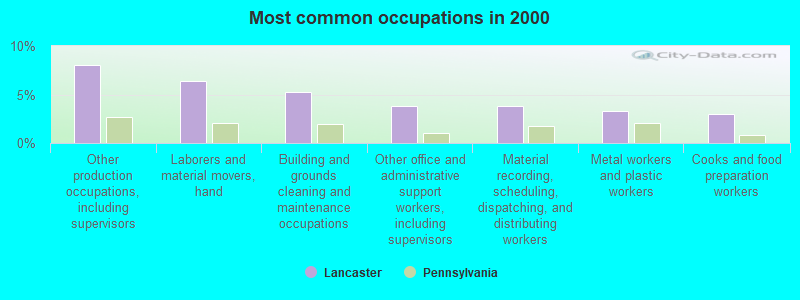
- Other production occupations, including supervisors (8.0%)
- Laborers and material movers, hand (6.4%)
- Building and grounds cleaning and maintenance occupations (5.3%)
- Other office and administrative support workers, including supervisors (3.9%)
- Material recording, scheduling, dispatching, and distributing workers (3.8%)
- Metal workers and plastic workers (3.3%)
- Cooks and food preparation workers (3.0%)
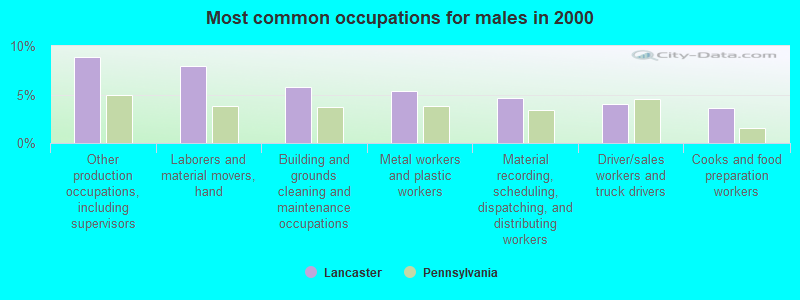
- Other production occupations, including supervisors (8.8%)
- Laborers and material movers, hand (7.9%)
- Building and grounds cleaning and maintenance occupations (5.8%)
- Metal workers and plastic workers (5.3%)
- Material recording, scheduling, dispatching, and distributing workers (4.7%)
- Driver/sales workers and truck drivers (4.1%)
- Cooks and food preparation workers (3.6%)
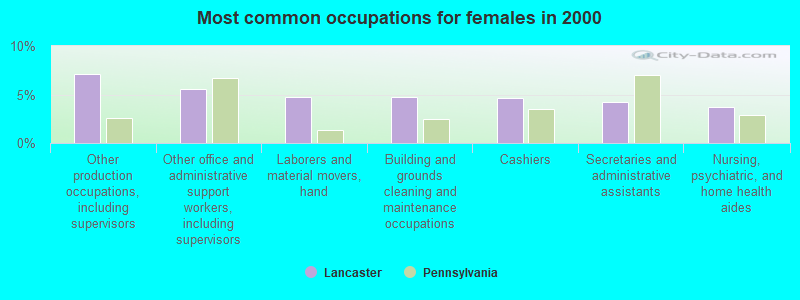
- Other production occupations, including supervisors (7.2%)
- Other office and administrative support workers, including supervisors (5.6%)
- Laborers and material movers, hand (4.8%)
- Building and grounds cleaning and maintenance occupations (4.7%)
- Cashiers (4.7%)
- Secretaries and administrative assistants (4.2%)
- Nursing, psychiatric, and home health aides (3.7%)
Average climate in Lancaster, Pennsylvania
Based on data reported by over 4,000 weather stations

|
|

(lower is better)
Air Quality Index (AQI) level in 2023 was 132. This is significantly worse than average.
| City: | 132 |
| U.S.: | 73 |
Carbon Monoxide (CO) [ppm] level in 2017 was 0.157. This is significantly better than average. Closest monitor was 1.2 miles away from the city center.
| City: | 0.157 |
| U.S.: | 0.251 |
Nitrogen Dioxide (NO2) [ppb] level in 2023 was 7.94. This is significantly worse than average. Closest monitor was 0.6 miles away from the city center.
| City: | 7.94 |
| U.S.: | 5.11 |
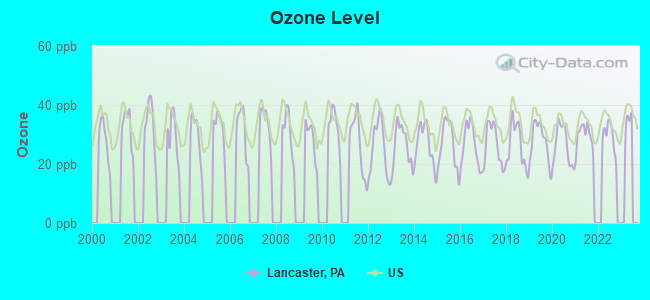
Ozone [ppb] level in 2022 was 29.4. This is about average. Closest monitor was 1.2 miles away from the city center.
| City: | 29.4 |
| U.S.: | 33.3 |
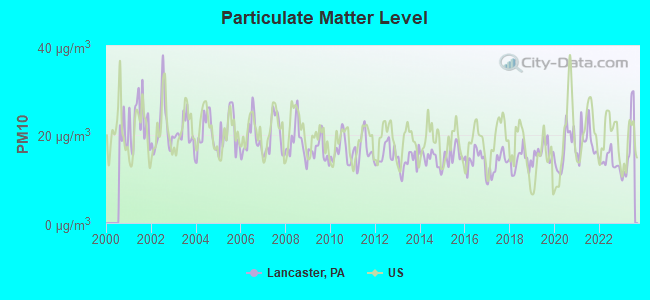
Particulate Matter (PM10) [µg/m3] level in 2023 was 17.3. This is about average. Closest monitor was 1.2 miles away from the city center.
| City: | 17.3 |
| U.S.: | 19.2 |
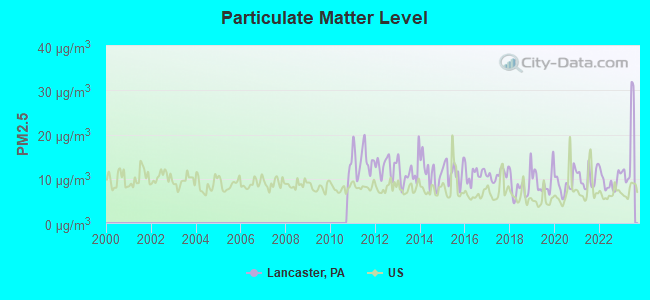
Particulate Matter (PM2.5) [µg/m3] level in 2023 was 16.6. This is significantly worse than average. Closest monitor was 1.2 miles away from the city center.
| City: | 16.6 |
| U.S.: | 8.1 |
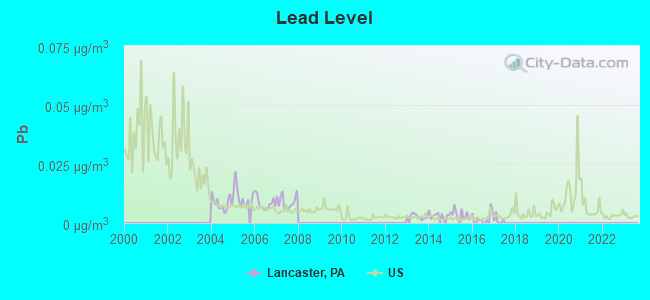
Lead (Pb) [µg/m3] level in 2016 was 0.00190. This is significantly better than average. Closest monitor was 0.1 miles away from the city center.
| City: | 0.00190 |
| U.S.: | 0.00931 |
Tornado activity:
Lancaster-area historical tornado activity is above Pennsylvania state average. It is 21% greater than the overall U.S. average.
On 11/4/1950, a category F3 (max. wind speeds 158-206 mph) tornado 14.8 miles away from the Lancaster city center injured one person and caused between $50,000 and $500,000 in damages.
On 7/14/2004, a category F3 tornado 22.1 miles away from the city center caused $18 million in damages.
Earthquake activity:
Lancaster-area historical earthquake activity is significantly above Pennsylvania state average. It is 61% smaller than the overall U.S. average.On 8/23/2011 at 17:51:04, a magnitude 5.8 (5.8 MW, Depth: 3.7 mi, Class: Moderate, Intensity: VI - VII) earthquake occurred 171.5 miles away from the city center
On 1/16/1994 at 01:49:16, a magnitude 4.6 (4.6 MB, 4.6 LG, Depth: 3.1 mi, Class: Light, Intensity: IV - V) earthquake occurred 24.5 miles away from Lancaster center
On 1/16/1994 at 00:42:43, a magnitude 4.2 (4.2 MB, 4.0 LG, Depth: 3.1 mi) earthquake occurred 25.3 miles away from the city center
On 9/25/1998 at 19:52:52, a magnitude 5.2 (4.8 MB, 4.3 MS, 5.2 LG, 4.5 MW, Depth: 3.1 mi) earthquake occurred 236.6 miles away from the city center
On 10/7/1983 at 10:18:46, a magnitude 5.3 (5.1 MB, 5.3 LG, 5.1 ML) earthquake occurred 288.8 miles away from the city center
On 11/30/2017 at 21:47:31, a magnitude 4.1 (4.1 MW, Depth: 6.1 mi) earthquake occurred 74.5 miles away from Lancaster center
Magnitude types: regional Lg-wave magnitude (LG), body-wave magnitude (MB), local magnitude (ML), surface-wave magnitude (MS), moment magnitude (MW)
Natural disasters:
The number of natural disasters in Lancaster County (19) is greater than the US average (15).Major Disasters (Presidential) Declared: 14
Emergencies Declared: 5
Causes of natural disasters: Floods: 5, Storms: 5, Winter Storms: 5, Hurricanes: 3, Snowstorms: 3, Tropical Storms: 3, Blizzard: 1, Heavy Rain: 1, Mudslide: 1, Snowfall: 1, Other: 1 (Note: some incidents may be assigned to more than one category).
Main business address for: FULTON FINANCIAL CORP (NATIONAL COMMERCIAL BANKS), HERLEY INDUSTRIES INC /NEW (SEARCH, DETECTION, NAVIGATION, GUIDANCE, AERONAUTICAL SYS), ARMSTRONG HOLDINGS INC /PA/ (PLASTICS PRODUCTS, NEC), STERLING FINANCIAL CORP /PA/ (NATIONAL COMMERCIAL BANKS).
Hospitals in Lancaster:
- FRIENDSHIP COMMUNITY (2165 NEW HOLLAND AVENUE)
- FRIENDSHIP COMMUNITY (2044 PENWICK RD)
- HEARTLAND HOME HEALTH CARE AND HOSPICE (217 GRANITE RUN DRIVE)
- HOSPICE LANCASTER CNTY (685 GOOD DRIVE PO BOX 685)
- LANCASTER GENERAL HOSPITAL (Voluntary non-profit - Other, provides emergency services, 555 NORTH DUKE STREET)
- LANCASTER REGIONAL MEDICAL CENTER (Proprietary, provides emergency services, 250 COLLEGE AVENUE)
- LANCASTER REHABILITATION HOSPITAL (provides emergency services, 675 GOOD DRIVE)
- SELECT SPECIALTY HOSPITAL LANCASTER (555 NORTH DUKE STREET)
Nursing Homes in Lancaster:
- BRETHREN VILLAGE (3001 LITITZ PIKE)
- CALVARY FELLOWSHIP HOMES INC (502 ELIZABETH DRIVE)
- GLEN AT WILLOW VALLEY, THE (675 WILLOW VALLEY SQUARE)
- GOLDEN LIVINGCENTER-LANCASTER (425 NORTH DUKE STREET)
- HOMESTEAD VILLAGE, INC (1800 VILLAGE CIRCLE)
- LANCASHIRE HALL (2829 LITITZ PIKE)
- MANORCARE HEALTH SERVICES-LANCASTER (100 ABBEYVILLE ROAD)
- MENNONITE HOME, THE (1520 HARRISBURG PIKE)
- TCC LANCASTER GENERAL HOSP (PO BOX 3555)
- VILLAGE VISTA MANOR (PO BOX 7001)
Dialysis Facilities in Lancaster:
- DAVITA - LANCASTER (1412 EAST KING STREET)
- LANCASTER GENERAL HEALTH CAMPUS (2100 HARRISBURG PIKE)
- PHYSICIANS DIALYSIS OF LANCASTER LLC (2110 HARRISBURG PIKE, SUITE 310)
Home Health Centers in Lancaster:
- AMEDISYS HOME HEALTH (480 NEW HOLLAND AVENUE, BUILDING 8, STE 8101)
- BAYADA NURSES INC (1850 WILLIAM PENN WAY SUITE 110)
- COMMUNITY HOSP LANCASTER HHC (1100 EAST ORANGE STREET)
- CRITICARE (1821 OREGON PIKE SUITE 214)
- EXTENDED FAMILY CARE (1860 CHARTER LANE SUITE 208)
- GENTIVA HEALTH SERVICES (800 NEW HOLLAND AVE)
- VNA COMMUNITY CARE SERVICES (1811 OLDE HOMESTEAD ROAD, PO BOX 10788)
Airports and heliports located in Lancaster:
- Lancaster Airport (LNS) (Runways: 2, Air Taxi Ops: 4,184, Itinerant Ops: 41,125, Local Ops: 31,513, Military Ops: 4,392)
- Commonwealth Security Systems Heliport (PA12)
- Lancaster General Hospital Heliport (5PS1)
- Lgh-Women And Babies Hospital Heliport (6PN2)
- Wgal-Tv Heliport (2PS4)
Amtrak station:
LANCASTER (53 MCGOVERN AVE.) . Services: ticket office, partially wheelchair accessible, enclosed waiting area, public restrooms, public payphones, vending machines, ATM, paid short-term parking, paid long-term parking, call for car rental service, call for taxi service, intercity bus service, public transit connection.Colleges/Universities in Lancaster:
- Franklin and Marshall College (Full-time enrollment: 2,585; Location: College Ave; Private, not-for-profit; Website: WWW.FANDM.EDU)
- Lancaster Bible College (Full-time enrollment: 1,176; Location: 901 Eden Rd; Private, not-for-profit; Website: www.LBC.edu; Offers Doctor's degree)
- Pennsylvania College of Health Sciences (Full-time enrollment: 1,025; Location: 410 N Lime Street; Private, not-for-profit; Website: https://www.pacollege.edu/)
- Thaddeus Stevens College of Technology (Full-time enrollment: 961; Location: 750 E King St; Public; Website: www.stevenscollege.edu)
- Pennsylvania College of Art and Design (Full-time enrollment: 228; Location: 204 N Prince St; Private, not-for-profit; Website: www.pcad.edu)
- Consolidated School of Business-Lancaster (Full-time enrollment: 117; Location: 2124 Ambassador Cir; Private, for-profit; Website: www.csb.edu)
- Empire Beauty School-Lancaster (Full-time enrollment: 113; Location: 1801 Columbia Ave; Private, for-profit; Website: www.empire.edu)
- Lancaster School of Cosmetology (Full-time enrollment: 111; Location: 50 Ranck Ave; Private, for-profit; Website: lancasterschoolofcosmetology.com)
- Lancaster Theological Seminary (Full-time enrollment: 84; Location: 555 W James St; Private, not-for-profit; Website: www.lancasterseminary.edu; Offers Doctor's degree)
Other colleges/universities with over 2000 students near Lancaster:
- Millersville University of Pennsylvania (about 4 miles; Millersville, PA; Full-time enrollment: 7,743)
- YTI Career Institute-York (about 20 miles; York, PA; FT enrollment: 2,212)
- York College Pennsylvania (about 24 miles; York, PA; FT enrollment: 5,140)
- Lincoln University of Pennsylvania (about 26 miles; Lincoln University, PA; FT enrollment: 2,042)
- Pennsylvania State University-Penn State Harrisburg (about 26 miles; Middletown, PA; FT enrollment: 3,797)
- Alvernia University (about 27 miles; Reading, PA; FT enrollment: 2,461)
- Pennsylvania State University-Penn State Berks (about 29 miles; Reading, PA; FT enrollment: 2,605)
Public high schools in Lancaster:
- MCCASKEY CAMPUS (Students: 3,011, Location: 445 N RESERVOIR ST, Grades: 9-12)
- CONESTOGA VALLEY SHS (Students: 1,303, Location: 2110 HORSESHOE RD, Grades: 9-12)
- MANHEIM TWP HS (Students: 939, Location: SCHOOL ROAD, Grades: 9-12)
- LA ACADEMIA PARTNERSHIP CHARTER SCHOOL (Students: 90, Location: 30 N ANN STREET, Grades: 6-12, Charter school)
- PHOENIX ACADEMY (Location: 630 ROCKLAND ST, Grades: 6-12)
Private high schools in Lancaster:
- LANCASTER CATHOLIC HIGH SCHOOL (Students: 765, Location: 650 JULIETTE AVE, Grades: 9-12)
- LANCASTER COUNTRY DAY SCHOOL (Students: 578, Location: 725 HAMILTON RD, Grades: PK-12)
- LANCASTER COUNTY CHRISTIAN SCHOOL - LEOLA CAMPUS (Students: 266, Location: 2390 NEW HOLLAND PIKE, Grades: PK-12)
- BLUE ROCK MENNONITE SCHOOL (Students: 58, Location: 3453 BLUE ROCK RD, Grades: 1-10)
Biggest public elementary/middle schools in Lancaster:
- MANHEIM TWP MS (Students: 1,746, Location: SCHOOL ROAD, Grades: 7-8)
- CENTERVILLE MS (Students: 693, Location: 865 CENTERVILLE RD, Grades: 7-8)
- WHEATLAND MS (Students: 675, Location: 919 HAMILTON PARK DR, Grades: 6-8)
- LINCOLN MS (Students: 659, Location: 1001 LEHIGH AVE, Grades: 6-8)
- KING EL SCH (Students: 648, Location: 466 ROCKLAND ST, Grades: PK-5)
- SMOKETOWN EL SCH (Students: 640, Location: 2426 OLD PHILADELPHIA PIKE, Grades: KG-6)
- CONESTOGA VALLEY MS (Students: 628, Location: 500 MOUNT SIDNEY RD, Grades: 7-8)
- NITRAUER SCH (Students: 615, Location: 811 ASHBOURNE AVE, Grades: KG-4)
- REYNOLDS MS (Students: 590, Location: 605 W WALNUT ST, Grades: 6-8)
- FRITZ EL SCH (Students: 563, Location: 845 HORNIG RD, Grades: KG-6)
Biggest private elementary/middle schools in Lancaster:
- ST LEO THE GREAT SCHOOL (Students: 277, Location: 2427 MARIETTA AVE, Grades: PK-8)
- ST ANNE SCHOOL (Students: 243, Location: 108 E LIBERTY ST, Grades: PK-8)
- THE NEW SCHOOL OF LANCASTER (Students: 235, Location: 935 COLUMBIA AVE, Grades: PK-8)
- MONTESSORI ACADEMY OF LANCASTER (Students: 196, Location: 2750 WEAVER RD, Grades: PK-3)
- LANCASTER COUNTY CHRISTIAN SCHOOL-WEST LAMPETER (Students: 165, Location: 651 LAMPETER RD, Grades: UG-8)
- RESURRECTION CATHOLIC SCHOOL (Students: 158, Location: 521 E ORANGE ST, Grades: KG-8)
- SACRED HEART SCHOOL (Students: 154, Location: 235 NEVIN ST, Grades: KG-8)
- ROCKY RIDGE SCHOOL (Students: 35, Location: 351 CLEARVIEW RD, Grades: 1-8)
- GREENLAND AMISH SCHOOL (Students: 31, Location: 425 GRIDLEY RD, Grades: 1-8)
- GREENLAND SCHOOL (Students: 31, Location: GRIDLEY RD, Grades: 1-8)
Libraries in Lancaster:
- LIB SYSM OF LANCASTER COUNTY (Operating income: $2,700,095; Location: 1866 COLONIAL VILLAGE LN, SUITE 107; 16,157 books; 40 e-books; 515 audio materials; 472 video materials; 18 local licensed databases; 41 state licensed databases; 56 print serial subscriptions)
- LANCASTER PUBLIC LIBRARY (Operating income: $2,115,125; Location: 125 NORTH DUKE ST; 279,459 books; 148 e-books; 13,322 audio materials; 16,526 video materials; 18 local licensed databases; 41 state licensed databases; 748 print serial subscriptions)
User-submitted facts and corrections:
- Community Hospital no longer exists. It has been replaced by Heart of Lancaster Regional Medical Center which is located at 1500 Highlands Drive, Lititz, PA 17543. 717.625.5000
- Under Television around Lancaster, W23AY, York, is no longer on the air. The Channel 23 frequency is assigned to WLYH-DT 23, Lancaster
Points of interest:
Notable locations in Lancaster: Parkview Plaza (A), Greenfield Station (B), Lancaster Square (C), Lancaster City Bureau of Fire Station 6 - 4 - 3 (D), Lancaster City Bureau of Fire Station 6 - 4 - 6 (E), Aaron J Martin Library of the Sciences (F), Arthur Shadek - B F Fackethal Library (G), Benjamin Franklin Fackenthal Laboratory (H), Benjamin Franklin Residence Halls (I), Charles Mayser Physical Education Center (J), Diagnothian Hall (K), Gerhart House (L), Goethean Hall (M), Green Room Theatre (N), Healthy Living House (O), Herman Fine Arts Center (P), Huegel House (Q), Jacob Y Dietz and Charles Santee Hall (R), Kaufman Lecture Hall (S), Lanious B Keiper Liberal Arts Building (T). Display/hide their locations on the map
Shopping Center: South Duke Street Mall (1). Display/hide its location on the map
Main business address in Lancaster include: FULTON FINANCIAL CORP (A), STERLING FINANCIAL CORP /PA/ (B). Display/hide their locations on the map
Cemeteries: Lancaster Cemetery (1), Woodward Hill Cemetery (2), Riverview Cemetery (3), Saint Marys Cemetery (4), Greenwood Cemetery (5), Shreiners Cemetery (6), Saint James Cemetery (7). Display/hide their locations on the map
Parks in Lancaster include: Sponaugle-Williamson Field (1), Crystal Park (2), Williamson Park (3), Triangle Park (4), South End Park (5), Reservoir Park (6), Crystal Park (7), Kiwanis Park (8), Stauffer Park (9). Display/hide their locations on the map
Tourist attractions: Demuth Foundation (Museums; 120 East King St), Americana Museum of Bird in Hand (2705 Old Philadelphia Pik), First Reformed Church-United Church of Christ (Cultural Attractions- Events- & Facilities; 40 East Orange Street), Hands-On House Childrens Museum (Cultural Attractions- Events- & Facilities; 721 Landis Valley Rd), Castle Gift Shop (Amusement & Theme Parks; 2249 Lincoln Hwye), Gamestop (Amusement & Theme Parks; Golden Triangle Shop), Amf Rocky Springs Lanes (Amusement & Theme Parks; 1495 Millport Road), Dutch Wonderland Family Amusement Park (Amusement & Theme Parks; 2249 Lincoln Highway East), Amvets Bingo (Amusement & Theme Parks; 715 Fairview Avenue).
Hotels: Four Seasons Fireplace and Patio Corporate Offices (260 Centerville Road), Country Inn-Suites Lancaster (2260 Lincoln Highway), Canadiana Motel (2390 Lincoln Highway East), Econo Lodge (2165 Lincoln Highway East), Garden Spot Motel (2291 Lincoln Highway East), Clyde's Cafe (101 Granite Run Drive), Best Western Eden Resort Inn & Conference Center (222 Eden Road), Belvedere Inn (402 North Queen Street), Four Seasons Fireplace and Patio Warehouse Office (260 Centerville Road).
Birthplace of: Junior Vasquez - DJ, John F. Reynolds - Union Army general, Jonathan Groff - Stage actor, Andrew Baldwin - Military physician and Dating Game Show Participant, Mike Sekowsky - Comic artist, John Gibson (soldier) - Judge, Aaron Herr - Baseball player, Andrew J. Feustel - Astronaut, Andrew Porter (Civil War general) - Army officer, Tom Herr - Baseball player.
Drinking water stations with addresses in Lancaster and their reported violations in the past:
CITY OF LANCASTER (Population served: 120,000, Surface water):Past monitoring violations:TURKEY HILL MINIT MARKET #82 (Population served: 1,400, Groundwater):
- Monitoring, Turbidity (Enhanced SWTR) - In AUG-2013, Contaminant: IESWTR. Follow-up actions: St Compliance achieved (OCT-30-2013)
- Monitoring of Treatment (SWTR-Filter) - In OCT-2010. Follow-up actions: St Compliance achieved (NOV-23-2010)
- Monitoring of Treatment (SWTR-Filter) - In JUL-2010. Follow-up actions: St Violation/Reminder Notice (AUG-26-2010), St Compliance achieved (AUG-26-2010)
- 42 regular monitoring violations
Past monitoring violations:TURKEY HILL #168 (Population served: 900, Groundwater):
- 2 routine major monitoring violations
- 4 minor monitoring violations
- One regular monitoring violation
Past monitoring violations:TURKEY HILL MINI MKT 115 (Population served: 800, Groundwater):
- One routine major monitoring violation
- One regular monitoring violation
Past monitoring violations:TURKEY HILL MINI MKT 195 (Population served: 700, Groundwater):
- One routine major monitoring violation
- 5 regular monitoring violations
Past monitoring violations:CRESTWOOD EST MOBILE HOMES (Population served: 470, Groundwater):
- One routine major monitoring violation
Past monitoring violations:TURKEY HILL MINUTE MART #118 (Population served: 300, Groundwater):
- Monitoring of Treatment (SWTR-Unfilt/GWR) - In JUL-2014, Contaminant: GROUNDWATER RULE. Follow-up actions: St Violation/Reminder Notice (AUG-29-2014), St Public Notif requested (AUG-29-2014)
- Monitoring of Treatment (SWTR-Unfilt/GWR) - In APR-2012, Contaminant: GROUNDWATER RULE. Follow-up actions: St Compliance achieved (JUN-14-2012)
- Monitoring of Treatment (SWTR-Unfilt/GWR) - In FEB-2012, Contaminant: GROUNDWATER RULE. Follow-up actions: St Compliance achieved (MAR-20-2012)
- Monitoring of Treatment (SWTR-Unfilt/GWR) - In OCT-2011, Contaminant: GROUNDWATER RULE. Follow-up actions: St Violation/Reminder Notice (NOV-22-2011), St Compliance achieved (DEC-21-2011)
- Monitoring and Reporting (DBP) - Between JUL-2006 and SEP-2006, Contaminant: Chlorine. Follow-up actions: St Compliance achieved (SEP-26-2006)
- One routine major monitoring violation
- One regular monitoring violation
Past monitoring violations:PINE VIEW DAIRY (Population served: 250, Groundwater):
- One routine major monitoring violation
Past health violations:Past monitoring violations:
- MCL, Monthly (TCR) - In AUG-2010, Contaminant: Coliform. Follow-up actions: St Site Visit (enforcement) (SEP-29-2010), St Public Notif received (SEP-29-2010), St Compliance achieved (SEP-29-2010), St Formal NOV issued (SEP-29-2010)
- MCL, Average - Between JUL-2006 and SEP-2006, Contaminant: Nitrate. Follow-up actions: St Public Notif received (OCT-26-2006), St Compliance achieved (OCT-26-2006)
- Monitoring, Source Water (GWR) - In AUG-2010, Contaminant: E. COLI. Follow-up actions: St Compliance achieved (SEP-29-2010), St Violation/Reminder Notice (SEP-29-2010)
- Monitoring, Repeat Major (TCR) - Between JUL-2010 and SEP-2010, Contaminant: Coliform (TCR). Follow-up actions: St Public Notif received (AUG-26-2010), St Formal NOV issued (AUG-26-2010), St Compliance achieved (NOV-23-2010)
- One routine major monitoring violation
Drinking water stations with addresses in Lancaster that have no violations reported:
- TURKEY HILL (GILBERT) (Population served: 1,500, Primary Water Source Type: Groundwater)
- TURKEY HILL MINIT MARKET #177 (Population served: 500, Primary Water Source Type: Groundwater)
- TURKEY HILL #261 (Population served: 300, Primary Water Source Type: Groundwater)
- EAST LAMPETER TWP PARK (Population served: 150, Primary Water Source Type: Groundwater)
- TURKEY HILL MINIT MKT 76 (Population served: 100, Primary Water Source Type: Groundwater)
- TURKEY HILL MINIT MKT 73 (Population served: 100, Primary Water Source Type: Groundwater)
- TURKEY HILL MINIT MKT 60 (Population served: 100, Primary Water Source Type: Groundwater)
- TURKEY HILL #202 (Population served: 50, Primary Water Source Type: Groundwater)
- SEVEN MOUNTAINS CAMPGROUND (Population served: 25, Primary Water Source Type: Groundwater)
- TURKEY HILL MINI MKT 245 (Population served: 25, Primary Water Source Type: Groundwater)
| This city: | 2.6 people |
| Pennsylvania: | 2.5 people |
| This city: | 57.6% |
| Whole state: | 65.0% |
| This city: | 11.5% |
| Whole state: | 6.6% |
Likely homosexual households (counted as self-reported same-sex unmarried-partner households)
- Lesbian couples: 0.5% of all households
- Gay men: 0.6% of all households
People in group quarters in Lancaster in 2010:
- 1,080 people in college/university student housing
- 950 people in local jails and other municipal confinement facilities
- 492 people in other noninstitutional facilities
- 352 people in emergency and transitional shelters (with sleeping facilities) for people experiencing homelessness
- 121 people in nursing facilities/skilled-nursing facilities
- 76 people in correctional facilities intended for juveniles
- 58 people in residential treatment centers for juveniles (non-correctional)
- 46 people in residential treatment centers for adults
- 7 people in mental (psychiatric) hospitals and psychiatric units in other hospitals
- 5 people in group homes intended for adults
- 2 people in group homes for juveniles (non-correctional)
People in group quarters in Lancaster in 2000:
- 1,492 people in college dormitories (includes college quarters off campus)
- 984 people in local jails and other confinement facilities (including police lockups)
- 596 people in nursing homes
- 269 people in other noninstitutional group quarters
- 125 people in homes or halfway houses for drug/alcohol abuse
- 69 people in other nonhousehold living situations
- 41 people in training schools for juvenile delinquents
- 33 people in other types of correctional institutions
- 28 people in other group homes
- 20 people in religious group quarters
- 16 people in homes for the mentally ill
- 12 people in halfway houses
- 5 people in homes for the mentally retarded
Banks with most branches in Lancaster (2011 data):
- Susquehanna Bank: 18 branches. Info updated 2012/02/28: Bank assets: $14,849.0 mil, Deposits: $10,294.4 mil, headquarters in Lititz, PA, positive income, Commercial Lending Specialization, 308 total offices, Holding Company: Susquehanna Bancshares, Inc.
- PNC Bank, National Association: 13 branches. Info updated 2012/03/20: Bank assets: $263,309.6 mil, Deposits: $197,343.0 mil, headquarters in Wilmington, DE, positive income, Commercial Lending Specialization, 3085 total offices, Holding Company: Pnc Financial Services Group, Inc., The
- Fulton Bank, National Association: 11 branches. Info updated 2010/12/30: Bank assets: $9,041.7 mil, Deposits: $6,700.3 mil, local headquarters, positive income, Commercial Lending Specialization, 122 total offices, Holding Company: Fulton Financial Corporation
- Manufacturers and Traders Trust Company: 8 branches. Info updated 2011/08/08: Bank assets: $76,887.1 mil, Deposits: $60,064.2 mil, headquarters in Buffalo, NY, positive income, Commercial Lending Specialization, 808 total offices, Holding Company: M&T Bank Corporation
- Wells Fargo Bank, National Association: 8 branches. Info updated 2011/04/05: Bank assets: $1,161,490.0 mil, Deposits: $905,653.0 mil, headquarters in Sioux Falls, SD, positive income, 6395 total offices, Holding Company: Wells Fargo & Company
- Sovereign Bank, National Association: Oregon Pike Branch, Park City Branch, East Towne Mall Branch, Lancaster Branch, Western Corners Branch. Info updated 2012/01/31: Bank assets: $78,146.9 mil, Deposits: $48,042.9 mil, headquarters in Wilmington, DE, positive income, Commercial Lending Specialization, 718 total offices, Holding Company: Banco Santander, S.A.
- Union Community Bank FSB: Roseville Road Branch, Centreville Road Office Branch, Old Philadelphia Pike Branch, Lancaster Branch, Union Community Bank Fsb. Info updated 2011/07/21: Bank assets: $533.2 mil, Deposits: $454.9 mil, local headquarters, positive income, Commercial Lending Specialization, 15 total offices
- Citizens Bank of Pennsylvania: Centerville Branch, Lancaster Main Branch, Manheim Township Branch. Info updated 2010/09/24: Bank assets: $32,316.9 mil, Deposits: $25,297.1 mil, headquarters in Philadelphia, PA, positive income, 396 total offices, Holding Company: Uk Financial Investments Limited
- Metro Bank: Manheim Pike Branch, Rohrerstown Road Branch, Lititz Pike Branch. Info updated 2009/09/09: Bank assets: $2,417.8 mil, Deposits: $2,091.3 mil, headquarters in Lemoyne, PA, positive income, Commercial Lending Specialization, 33 total offices, Holding Company: Metro Bancorp, Inc.
- 4 other banks with 8 local branches
For population 15 years and over in Lancaster:
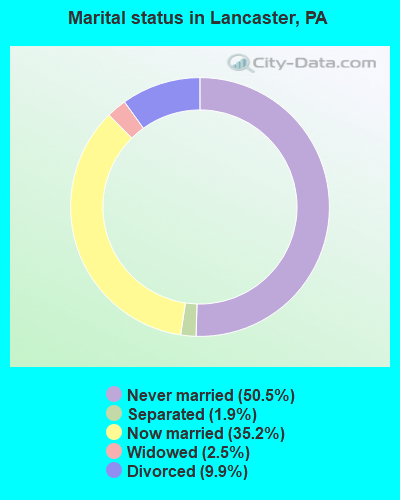
- Never married: 50.5%
- Now married: 35.2%
- Separated: 1.9%
- Widowed: 2.5%
- Divorced: 9.9%
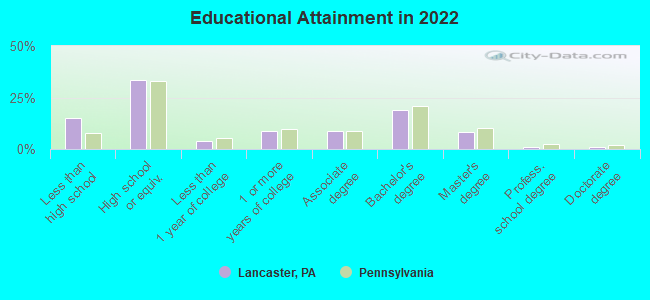
For population 25 years and over in Lancaster:
- High school or higher: 83.9%
- Bachelor's degree or higher: 27.4%
- Graduate or professional degree: 9.6%
- Unemployed: 5.6%
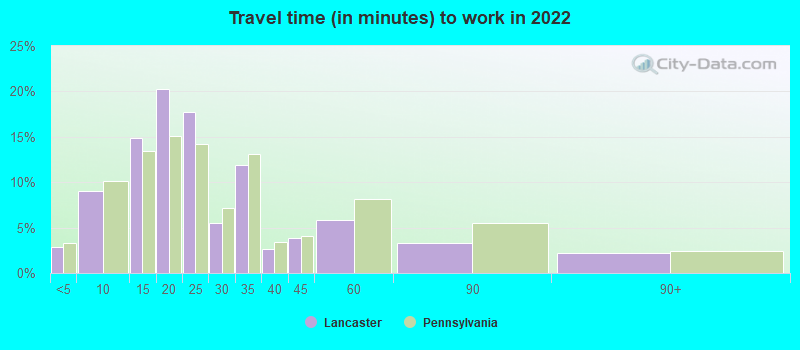
- Mean travel time to work (commute): 21.1 minutes
| Here: | 13.9 |
| Pennsylvania average: | 11.4 |
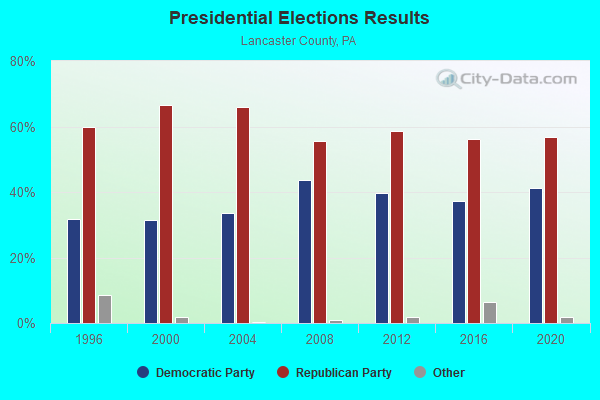
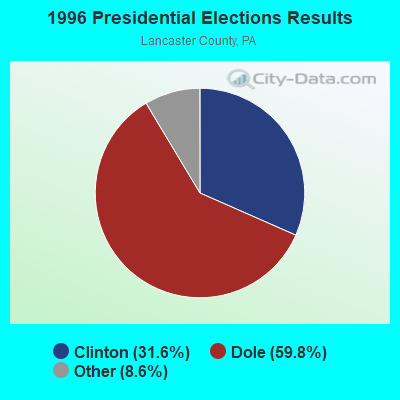
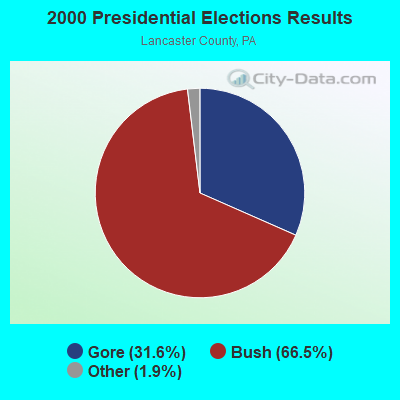
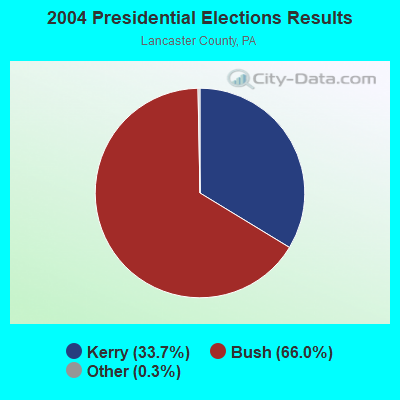
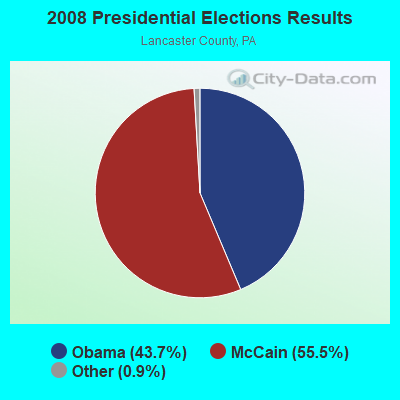
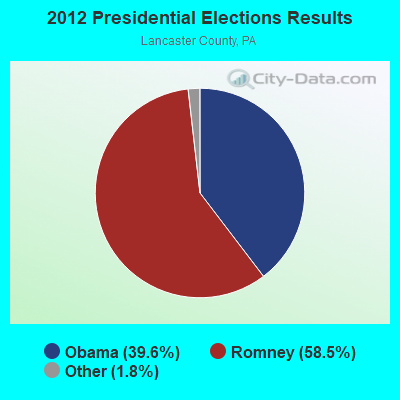
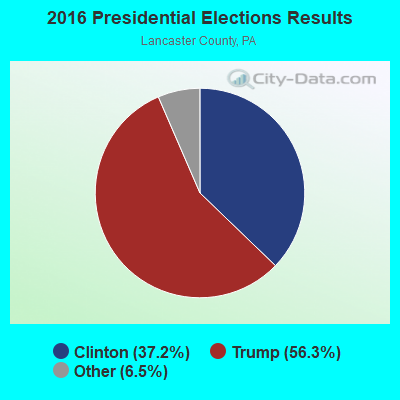
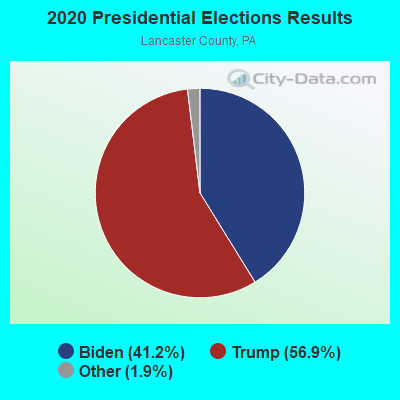
Graphs represent county-level data. Detailed 2008 Election Results
Religion statistics for Lancaster, PA (based on Lancaster County data)
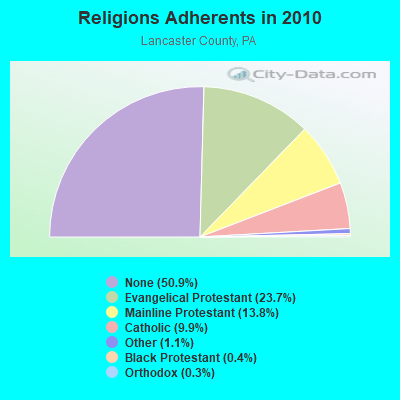
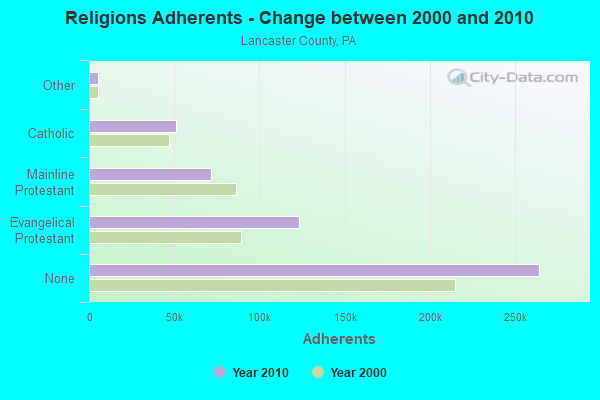
| Religion | Adherents | Congregations |
|---|---|---|
| Evangelical Protestant | 122,957 | 568 |
| Mainline Protestant | 71,573 | 192 |
| Catholic | 51,292 | 20 |
| Other | 5,536 | 20 |
| Black Protestant | 2,163 | 8 |
| Orthodox | 1,600 | 2 |
| None | 264,324 | - |
Food Environment Statistics:
| Lancaster County: | 2.13 / 10,000 pop. |
| State: | 2.04 / 10,000 pop. |
| Here: | 0.08 / 10,000 pop. |
| Pennsylvania: | 0.09 / 10,000 pop. |
| This county: | 0.62 / 10,000 pop. |
| Pennsylvania: | 0.88 / 10,000 pop. |
| This county: | 2.63 / 10,000 pop. |
| State: | 2.52 / 10,000 pop. |
| Lancaster County: | 5.94 / 10,000 pop. |
| State: | 7.12 / 10,000 pop. |
| Lancaster County: | 8.4% |
| Pennsylvania: | 9.1% |
| Lancaster County: | 27.4% |
| Pennsylvania: | 27.2% |
| Lancaster County: | 13.1% |
| State: | 11.5% |
Health and Nutrition:
| Here: | 47.5% |
| Pennsylvania: | 50.2% |
| Lancaster: | 45.9% |
| State: | 47.1% |
| Here: | 28.6 |
| Pennsylvania: | 28.7 |
| This city: | 21.1% |
| Pennsylvania: | 20.8% |
| This city: | 11.2% |
| State: | 10.9% |
| This city: | 6.8 |
| Pennsylvania: | 6.8 |
| Lancaster: | 32.5% |
| Pennsylvania: | 34.3% |
| Lancaster: | 55.2% |
| Pennsylvania: | 56.2% |
| Lancaster: | 80.5% |
| Pennsylvania: | 78.3% |
More about Health and Nutrition of Lancaster, PA Residents
| Local government employment and payroll (March 2022) | |||||
| Function | Full-time employees | Monthly full-time payroll | Average yearly full-time wage | Part-time employees | Monthly part-time payroll |
|---|---|---|---|---|---|
| Police Protection - Officers | 141 | $1,275,365 | $108,542 | 0 | $0 |
| Water Supply | 77 | $433,419 | $67,546 | 0 | $0 |
| Firefighters | 73 | $607,889 | $99,927 | 0 | $0 |
| Sewerage | 60 | $317,358 | $63,472 | 0 | $0 |
| Police - Other | 46 | $210,756 | $54,980 | 21 | $18,181 |
| Financial Administration | 41 | $221,825 | $64,924 | 5 | $4,150 |
| Streets and Highways | 36 | $179,267 | $59,756 | 0 | $0 |
| Other and Unallocable | 23 | $118,004 | $61,567 | 0 | $0 |
| Housing and Community Development (Local) | 19 | $109,234 | $68,990 | 0 | $0 |
| Other Government Administration | 12 | $32,379 | $32,379 | 0 | $0 |
| Parks and Recreation | 11 | $55,988 | $61,078 | 0 | $0 |
| Solid Waste Management | 8 | $51,064 | $76,596 | 2 | $130 |
| Health | 2 | $10,983 | $65,898 | 0 | $0 |
| Fire - Other | 2 | $10,583 | $63,498 | 0 | $0 |
| Totals for Government | 551 | $3,634,114 | $79,146 | 28 | $22,461 |
Lancaster government finances - Expenditure in 2021 (per resident):
- Construction - Water Utilities: $8,700,000 ($151.43)
Solid Waste Management: $7,839,000 ($136.44)
Sewerage: $6,800,000 ($118.36)
General Public Buildings: $4,200,000 ($73.10)
Natural Resources - Other: $1,995,000 ($34.72)
Parks and Recreation: $1,500,000 ($26.11)
- Current Operations - General - Other: $23,480,000 ($408.68)
Police Protection: $22,437,000 ($390.53)
Water Utilities: $19,611,000 ($341.34)
Central Staff Services: $16,861,000 ($293.47)
Local Fire Protection: $12,982,000 ($225.96)
Sewerage: $11,258,000 ($195.95)
Housing and Community Development: $8,931,000 ($155.45)
Regular Highways: $6,258,000 ($108.92)
Parks and Recreation: $5,444,000 ($94.76)
Solid Waste Management: $4,339,000 ($75.52)
Judicial and Legal Services: $2,162,000 ($37.63)
Protective Inspection and Regulation - Other: $1,937,000 ($33.71)
General Public Buildings: $1,280,000 ($22.28)
Natural Resources - Other: $1,214,000 ($21.13)
Health - Other: $821,000 ($14.29)
Financial Administration: $568,000 ($9.89)
Sea and Inland Port Facilities: $101,000 ($1.76)
Libraries: $100,000 ($1.74)
Miscellaneous Commercial Activities - Other: $97,000 ($1.69)
- General - Interest on Debt: $13,035,000 ($226.88)
- Other Capital Outlay - Water Utilities: $1,581,000 ($27.52)
Sewerage: $928,000 ($16.15)
Local Fire Protection: $614,000 ($10.69)
Police Protection: $250,000 ($4.35)
Natural Resources - Other: $240,000 ($4.18)
Regular Highways: $135,000 ($2.35)
Central Staff Services: $53,000 ($0.92)
Solid Waste Management: $49,000 ($0.85)
- Total Salaries and Wages: $36,609,000 ($637.20)
Lancaster government finances - Revenue in 2021 (per resident):
- Charges - Sewerage: $21,798,000 ($379.41)
Other: $17,435,000 ($303.47)
Solid Waste Management: $4,528,000 ($78.81)
Parks and Recreation: $287,000 ($5.00)
- Federal Intergovernmental - Housing and Community Development: $1,817,000 ($31.63)
Other: $106,000 ($1.84)
- Local Intergovernmental - Other: $1,222,000 ($21.27)
- Miscellaneous - Donations From Private Sources: $4,065,000 ($70.75)
Fines and Forfeits: $1,727,000 ($30.06)
Sale of Property: $547,000 ($9.52)
Rents: $544,000 ($9.47)
Interest Earnings: $345,000 ($6.00)
General Revenue - Other: $5,000 ($0.09)
- Revenue - Water Utilities: $28,270,000 ($492.05)
- State Intergovernmental - Other: $13,368,000 ($232.68)
Housing and Community Development: $6,629,000 ($115.38)
Highways: $1,528,000 ($26.60)
General Local Government Support: $70,000 ($1.22)
- Tax - Property: $30,436,000 ($529.75)
Individual Income: $6,562,000 ($114.22)
Occupation and Business License - Other: $3,248,000 ($56.53)
Documentary and Stock Transfer: $1,470,000 ($25.59)
Public Utility License: $577,000 ($10.04)
Lancaster government finances - Debt in 2021 (per resident):
- Long Term Debt - Beginning Outstanding - Unspecified Public Purpose: $352,936,000 ($6143.04)
Outstanding Unspecified Public Purpose: $348,806,000 ($6071.15)
Retired Unspecified Public Purpose: $9,630,000 ($167.62)
Issue, Unspecified Public Purpose: $5,500,000 ($95.73)
Lancaster government finances - Cash and Securities in 2021 (per resident):
- Bond Funds - Cash and Securities: $13,695,000 ($238.37)
- Other Funds - Cash and Securities: $68,704,000 ($1195.83)
- Sinking Funds - Cash and Securities: $437,000 ($7.61)
4.04% of this county's 2021 resident taxpayers lived in other counties in 2020 ($63,382 average adjusted gross income)
| Here: | 4.04% |
| Pennsylvania average: | 5.27% |
0.01% of residents moved from foreign countries ($104 average AGI)
Lancaster County: 0.01% Pennsylvania average: 0.01%
Top counties from which taxpayers relocated into this county between 2020 and 2021:
| from York County, PA | |
| from Berks County, PA | |
| from Chester County, PA |
4.16% of this county's 2020 resident taxpayers moved to other counties in 2021 ($63,657 average adjusted gross income)
| Here: | 4.16% |
| Pennsylvania average: | 5.44% |
0.01% of residents moved to foreign countries ($74 average AGI)
Lancaster County: 0.01% Pennsylvania average: 0.01%
Top counties to which taxpayers relocated from this county between 2020 and 2021:
| to York County, PA | |
| to Dauphin County, PA | |
| to Chester County, PA |
| Businesses in Lancaster, PA | ||||
| Name | Count | Name | Count | |
|---|---|---|---|---|
| ALDI | 1 | Knights Inn | 1 | |
| ALDO | 1 | Kohl's | 2 | |
| AT&T | 5 | Kroger | 27 | |
| Abercrombie & Fitch | 1 | LA Fitness | 1 | |
| Abercrombie Kids | 1 | La-Z-Boy | 3 | |
| Ace Hardware | 1 | Lane Bryant | 1 | |
| Advance Auto Parts | 4 | Lane Furniture | 4 | |
| Aeropostale | 3 | LensCrafters | 1 | |
| American Eagle Outfitters | 1 | Levi Strauss & Co. | 1 | |
| Ann Taylor | 4 | Little Caesars Pizza | 1 | |
| Apple Store | 1 | Long John Silver's | 2 | |
| Applebee's | 1 | Lowe's | 2 | |
| Arby's | 3 | Marriott | 3 | |
| Audi | 1 | Marshalls | 1 | |
| AutoZone | 2 | MasterBrand Cabinets | 20 | |
| BMW | 1 | Maurices | 1 | |
| Bakers | 1 | McDonald's | 11 | |
| Banana Republic | 2 | Men's Wearhouse | 2 | |
| Barnes & Noble | 1 | Motherhood Maternity | 3 | |
| Bath & Body Works | 2 | New Balance | 4 | |
| Bebe | 1 | New York & Co | 1 | |
| Bed Bath & Beyond | 1 | Nike | 16 | |
| Best Western | 1 | OfficeMax | 1 | |
| Blockbuster | 1 | Old Country Buffet | 1 | |
| Brooks Brothers | 1 | Old Navy | 1 | |
| Burger King | 5 | Olive Garden | 2 | |
| Burlington Coat Factory | 1 | Outback | 1 | |
| CVS | 8 | Outback Steakhouse | 1 | |
| Carson Pirie Scott | 2 | Pac Sun | 1 | |
| Casual Male XL | 1 | Panera Bread | 2 | |
| Charlotte Russe | 1 | Papa John's Pizza | 2 | |
| Chico's | 2 | Payless | 5 | |
| Chuck E. Cheese's | 1 | Penske | 2 | |
| Cinnabon | 1 | PetSmart | 2 | |
| Clarks | 2 | Pier 1 Imports | 1 | |
| Coldwater Creek | 1 | Pizza Hut | 5 | |
| Comfort Suites | 1 | Pottery Barn | 1 | |
| Costco | 1 | Pottery Barn Kids | 1 | |
| Cracker Barrel | 1 | Qdoba Mexican Grill | 1 | |
| Curves | 2 | Quiznos | 1 | |
| DHL | 1 | RadioShack | 4 | |
| Dairy Queen | 1 | Red Lobster | 1 | |
| Deb | 2 | Red Robin | 1 | |
| Decora Cabinetry | 4 | Red Roof Inn | 1 | |
| Dennys | 1 | Rite Aid | 3 | |
| Domino's Pizza | 3 | Rodeway Inn | 1 | |
| DressBarn | 3 | Ruby Tuesday | 3 | |
| Dressbarn | 3 | Rue21 | 1 | |
| Dunkin Donuts | 6 | Ryder Rental & Truck Leasing | 1 | |
| Econo Lodge | 1 | SAS Shoes | 2 | |
| Eddie Bauer | 1 | SONIC Drive-In | 1 | |
| Famous Footwear | 1 | Sears | 2 | |
| FedEx | 25 | Sephora | 1 | |
| Finish Line | 1 | Shoe Carnival | 2 | |
| Firestone Complete Auto Care | 2 | Skechers USA | 1 | |
| Foot Locker | 1 | Spencer Gifts | 1 | |
| Forever 21 | 1 | Sprint Nextel | 4 | |
| GNC | 4 | Staples | 1 | |
| GameStop | 5 | Starbucks | 5 | |
| Gap | 2 | Subway | 16 | |
| Giant | 7 | Super 8 | 2 | |
| Goodwill | 2 | T-Mobile | 12 | |
| Gymboree | 2 | T.G.I. Driday's | 1 | |
| H&M | 1 | T.J.Maxx | 1 | |
| H&R Block | 6 | Taco Bell | 2 | |
| Haagen-Dazs | 1 | Talbots | 2 | |
| Hawthorn | 1 | Target | 1 | |
| Hilton | 3 | The Limited | 1 | |
| Holiday Inn | 1 | Toys"R"Us | 2 | |
| Hollister Co. | 1 | Travelodge | 1 | |
| Home Depot | 1 | True Value | 1 | |
| Honda | 1 | U-Haul | 7 | |
| Hot Topic | 1 | UPS | 32 | |
| IZOD | 2 | Vans | 4 | |
| J. Jill | 1 | Verizon Wireless | 6 | |
| J.Crew | 1 | Victoria's Secret | 1 | |
| JCPenney | 1 | Volkswagen | 1 | |
| JoS. A. Bank | 2 | Waffle House | 2 | |
| Jones New York | 4 | Walgreens | 1 | |
| Journeys | 1 | Walmart | 2 | |
| Justice | 2 | Wendy's | 4 | |
| KFC | 3 | Wet Seal | 1 | |
| Kincaid | 2 | Wingate | 1 | |
| Kmart | 2 | YMCA | 2 | |
Strongest AM radio stations in Lancaster:
- WLAN (1390 AM; 5 kW; LANCASTER, PA)
- WLPA (1490 AM; 1 kW; LANCASTER, PA; Owner: HALL COMMUNICATIONS, INC.)
- WEEU (830 AM; 20 kW; READING, PA; Owner: WEEU BROADCASTING COMPANY)
- WVCH (740 AM; 50 kW; CHESTER, PA; Owner: WVCH COMMUNICATIONS, INC.)
- WCBM (680 AM; 50 kW; BALTIMORE, MD; Owner: WCBM MARYLAND, INC.)
- WWJZ (640 AM; 50 kW; MOUNT HOLLY, NJ; Owner: ABC, INC.)
- WPEN (950 AM; 50 kW; PHILADELPHIA, PA; Owner: GREATER PHILADELPHIA RADIO, INC.)
- WZZD (990 AM; 50 kW; PHILADELPHIA, PA; Owner: PENNSYLVANIA MEDIA ASSOCIATES, INC.)
- WBAL (1090 AM; 50 kW; BALTIMORE, MD; Owner: HEARST RADIO, INC.)
- KYW (1060 AM; 50 kW; PHILADELPHIA, PA; Owner: INFINITY BROADCASTING OPERATIONS, INC.)
- WWLG (1370 AM; 50 kW; BALTIMORE, MD; Owner: M-10 BROADCASTING, INC.)
- WGOP (700 AM; daytime; 25 kW; WALKERSVILLE, MD; Owner: BIRACH BROADCASTING CORPORATION)
- WNWR (1540 AM; 50 kW; PHILADELPHIA, PA)
Strongest FM radio stations in Lancaster:
- W259AA (99.7 FM; LANCASTER, PA; Owner: WITF, INC.)
- WJTL (90.3 FM; LANCASTER, PA; Owner: CREATIVE MINISTRIES, INC.)
- WFNM (89.1 FM; LANCASTER, PA; Owner: FRANKLIN AND MARSHALL COLLEGE)
- WLCH (91.3 FM; LANCASTER, PA; Owner: SPANISH AMERICAN CIVIC ASSC FOR EQUL)
- WIOV-FM (105.1 FM; EPHRATA, PA; Owner: REGENT BROADCASTING OF LANCASTER, INC.)
- WDAC (94.5 FM; LANCASTER, PA; Owner: WDAC RADIO COMPANY)
- WARM-FM (103.3 FM; YORK, PA; Owner: WSBA LICO, INC.)
- WROZ (101.3 FM; LANCASTER, PA; Owner: HALL COMMUNICATIONS, INC.)
- WLAN-FM (96.9 FM; LANCASTER, PA; Owner: CLEAR CHANNEL BROADCASTING LICENSES, INC.)
- WSOX (96.1 FM; RED LION, PA; Owner: LANCASTER-YORK BROADCASTING, LLC)
- WCAT-FM (106.7 FM; HERSHEY, PA; Owner: CITADEL BROADCASTING COMPANY)
- WRTL (90.7 FM; EPHRATA, PA; Owner: TEMPLE UNIV OF COMMONWEALTH SYSTEM)
- W220BX (91.9 FM; MARIETTA, PA; Owner: CALVARY CHAPEL OF TWIN FALLS, INC.)
- WQXA-FM (105.7 FM; YORK, PA; Owner: CITADEL BROADCASTING COMPANY)
- WHBO (92.7 FM; STARVIEW, PA; Owner: HALL COMMUNICATIONS, INC.)
- WITF-FM (89.5 FM; HARRISBURG, PA; Owner: WITF, INC.)
- WIXQ (91.7 FM; MILLERSVILLE, PA; Owner: MILLERSVILLE UNIVERSITY)
- WIOV-FM1 (105.1 FM; READING, PA; Owner: REGENT BROADCASTING OF LANCASTER, INC.)
- WBMP (88.1 FM; WARWICK, PA; Owner: FOUR RIVERS COMMUNITY BROADCASTING CORP.)
- WRFY-FM (102.5 FM; READING, PA; Owner: CLEAR CHANNEL BROADCASTING LICENSES, INC.)
TV broadcast stations around Lancaster:
- WPMT (Channel 43; YORK, PA; Owner: TRIBUNE TELEVISION COMPANY)
- WLYH-TV (Channel 15; LANCASTER, PA; Owner: TELEVISION STATION GROUP LICENSE SUBSIDIARY, LLC)
- WGAL (Channel 8; LANCASTER, PA; Owner: WGAL HEARST-ARGYLE TELEVISION, INC.)
- WGCB-TV (Channel 49; RED LION, PA; Owner: RED LION BROADCASTING CO., INC.)
- WTVE (Channel 51; READING, PA; Owner: READING BROADCASTING, INC.)
- WTSD-CA (Channel 14; WILMINGTON, DE; Owner: PRIORITY COMMUNICATIONS MINISTRIES, INC.)
- W23AY (Channel 23; YORK, PA; Owner: WIRELESS CABLE TV OF PA, INC.)
- WITF-TV (Channel 33; HARRISBURG, PA; Owner: WITF, INC.)
Medal of Honor Recipients
Medal of Honor Recipients born in Lancaster: Milton Blickensderfer, Robert Dale Reem, Trustrim Connell.
- National Bridge Inventory (NBI) Statistics
- 130Number of bridges
- 1,329ft / 405mTotal length
- $24,133,000Total costs
- 2,756,939Total average daily traffic
- 229,527Total average daily truck traffic
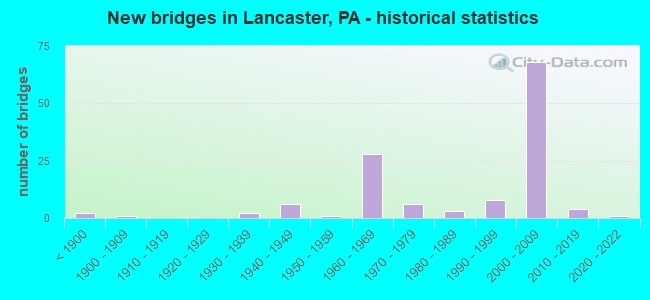
- New bridges - historical statistics
- 2Before 1900
- 11900-1909
- 21930-1939
- 61940-1949
- 11950-1959
- 281960-1969
- 61970-1979
- 31980-1989
- 81990-1999
- 682000-2009
- 42010-2019
- 12020-2022
FCC Registered Antenna Towers: 396 (See the full list of FCC Registered Antenna Towers)
FCC Registered Commercial Land Mobile Towers: 11 (See the full list of FCC Registered Commercial Land Mobile Towers in Lancaster, PA)
FCC Registered Private Land Mobile Towers: 11 (See the full list of FCC Registered Private Land Mobile Towers)
FCC Registered Broadcast Land Mobile Towers: 166 (See the full list of FCC Registered Broadcast Land Mobile Towers)
FCC Registered Microwave Towers: 110 (See the full list of FCC Registered Microwave Towers in this town)
FCC Registered Paging Towers: 23 (See the full list of FCC Registered Paging Towers)
FCC Registered Maritime Coast & Aviation Ground Towers: 4 (See the full list of FCC Registered Maritime Coast & Aviation Ground Towers)
FCC Registered Amateur Radio Licenses: 622 (See the full list of FCC Registered Amateur Radio Licenses in Lancaster)
FAA Registered Aircraft Manufacturers and Dealers: 2 (See the full list of FAA Registered Manufacturers and Dealers in Lancaster)
FAA Registered Aircraft: 64 (See the full list of FAA Registered Aircraft)
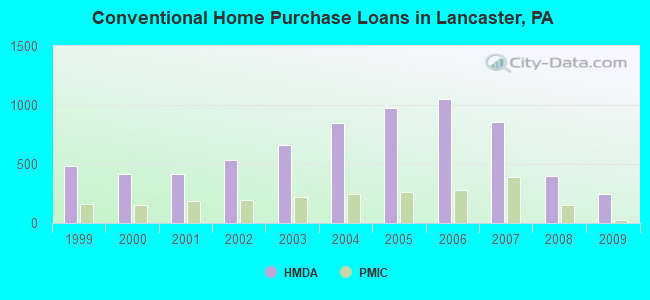
| Home Mortgage Disclosure Act Aggregated Statistics For Year 2009 (Based on 14 full and 6 partial tracts) | ||||||||||||||
| A) FHA, FSA/RHS & VA Home Purchase Loans | B) Conventional Home Purchase Loans | C) Refinancings | D) Home Improvement Loans | E) Loans on Dwellings For 5+ Families | F) Non-occupant Loans on < 5 Family Dwellings (A B C & D) | G) Loans On Manufactured Home Dwelling (A B C & D) | ||||||||
|---|---|---|---|---|---|---|---|---|---|---|---|---|---|---|
| Number | Average Value | Number | Average Value | Number | Average Value | Number | Average Value | Number | Average Value | Number | Average Value | Number | Average Value | |
| LOANS ORIGINATED | 341 | $109,675 | 249 | $105,287 | 517 | $112,857 | 87 | $40,485 | 8 | $286,744 | 135 | $87,312 | 0 | $0 |
| APPLICATIONS APPROVED, NOT ACCEPTED | 11 | $119,876 | 11 | $142,633 | 76 | $95,804 | 18 | $21,712 | 0 | $0 | 11 | $144,436 | 0 | $0 |
| APPLICATIONS DENIED | 47 | $112,355 | 49 | $86,286 | 303 | $95,573 | 97 | $29,053 | 4 | $197,485 | 45 | $67,317 | 9 | $33,000 |
| APPLICATIONS WITHDRAWN | 30 | $107,519 | 15 | $96,793 | 162 | $106,231 | 8 | $49,306 | 3 | $489,333 | 18 | $110,823 | 0 | $0 |
| FILES CLOSED FOR INCOMPLETENESS | 11 | $100,089 | 5 | $88,464 | 26 | $107,789 | 2 | $33,075 | 0 | $0 | 2 | $146,315 | 0 | $0 |
Detailed mortgage data for all 20 tracts in Lancaster, PA
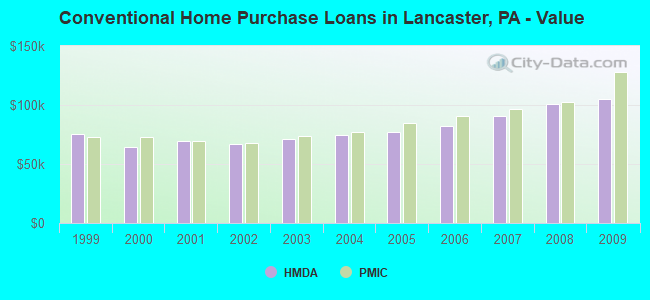
| Private Mortgage Insurance Companies Aggregated Statistics For Year 2009 (Based on 13 full and 6 partial tracts) | ||||||
| A) Conventional Home Purchase Loans | B) Refinancings | C) Non-occupant Loans on < 5 Family Dwellings (A & B) | ||||
|---|---|---|---|---|---|---|
| Number | Average Value | Number | Average Value | Number | Average Value | |
| LOANS ORIGINATED | 28 | $128,150 | 19 | $135,876 | 1 | $101,000 |
| APPLICATIONS APPROVED, NOT ACCEPTED | 9 | $111,261 | 9 | $206,554 | 2 | $41,500 |
| APPLICATIONS DENIED | 10 | $114,232 | 2 | $121,765 | 0 | $0 |
| APPLICATIONS WITHDRAWN | 1 | $285,840 | 3 | $169,773 | 0 | $0 |
| FILES CLOSED FOR INCOMPLETENESS | 0 | $0 | 0 | $0 | 0 | $0 |
2002 - 2018 National Fire Incident Reporting System (NFIRS) incidents
- Fire incident types reported to NFIRS in Lancaster, PA
- 6,82867.8%Structure Fires
- 1,73617.2%Outside Fires
- 1,22212.1%Mobile Property/Vehicle Fires
- 2852.8%Other
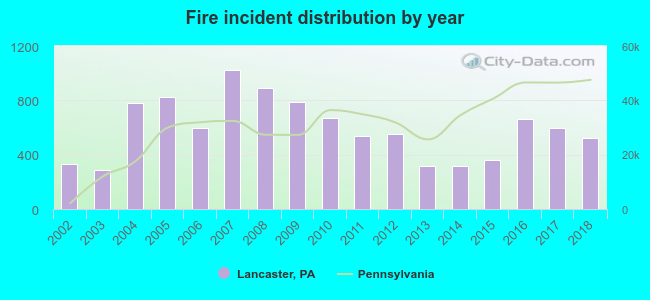 According to the data from the years 2002 - 2018 the average number of fire incidents per year is 592. The highest number of reported fire incidents - 1,022 took place in 2007, and the least - 286 in 2003. The data has a growing trend.
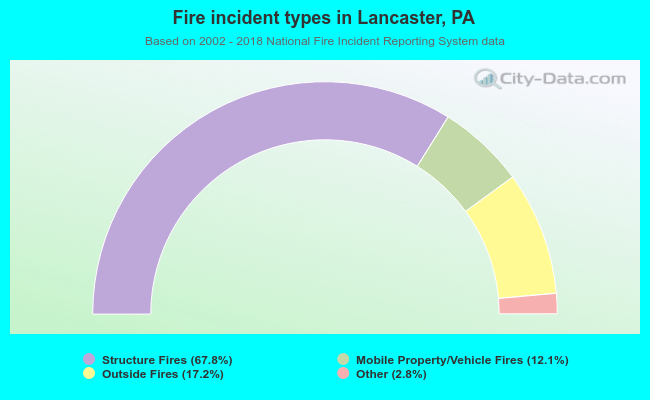 When looking into fire subcategories, the most incidents belonged to: Structure Fires (67.8%), and Outside Fires (17.2%).
Fire-safe hotels and motels in Lancaster, Pennsylvania:
- Econo Lodge North, 2165 US Hwy 30 E, Lancaster, Pennsylvania 17602 , Phone: (717) 299-6900, Fax: (717) 299-6900
- Best Western Eden Resort Inn & Conf Center, 222 Eden Rd, Lancaster, Pennsylvania 17601 , Phone: (717) 569-6444, Fax: (717) 560-5089
- Hampton Inn, 545 Greenfield Rd, Lancaster, Pennsylvania 17601 , Phone: (717) 299-1200, Fax: (717) 299-1155
- Days Inn & Suites, 1492 Lititz Pike, Lancaster, Pennsylvania 17601 , Phone: (717) 393-0771, Fax: (717) 293-8300
- Lancaster Host Resort, 2300 Lincoln Hwy E, Lancaster, Pennsylvania 17602 , Phone: (717) 299-5500, Fax: (717) 295-5116
- Red Roof Inn, 2307 Lincoln Hwy E, Lancaster, Pennsylvania 17602 , Phone: (717) 299-9700, Fax: (717) 392-3576
- Comfort Inn Lancaster Rockvale Outlets, 24 S Willowdale Dr, Lancaster, Pennsylvania 17602 , Phone: (717) 293-9500, Fax: (717) 293-8558
- Your Place Country Inn, 2133 Lincoln Hwy E, Lancaster, Pennsylvania 17602 , Phone: (717) 393-3413, Fax: (717) 393-2889
- 20 other hotels and motels
| Most common first names in Lancaster, PA among deceased individuals | ||
| Name | Count | Lived (average) |
|---|---|---|
| Mary | 1,679 | 81.9 years |
| John | 1,532 | 75.7 years |
| William | 994 | 75.5 years |
| Charles | 967 | 75.8 years |
| Robert | 919 | 73.0 years |
| Anna | 902 | 83.2 years |
| Dorothy | 672 | 79.3 years |
| George | 661 | 76.6 years |
| Helen | 638 | 81.1 years |
| Elizabeth | 637 | 82.8 years |
| Most common last names in Lancaster, PA among deceased individuals | ||
| Last name | Count | Lived (average) |
|---|---|---|
| Miller | 534 | 78.8 years |
| Smith | 382 | 77.6 years |
| Martin | 289 | 78.6 years |
| Herr | 277 | 81.6 years |
| Myers | 247 | 76.3 years |
| Brown | 231 | 74.4 years |
| Groff | 212 | 79.3 years |
| Weaver | 205 | 78.3 years |
| Hess | 197 | 81.3 years |
| Landis | 169 | 81.1 years |
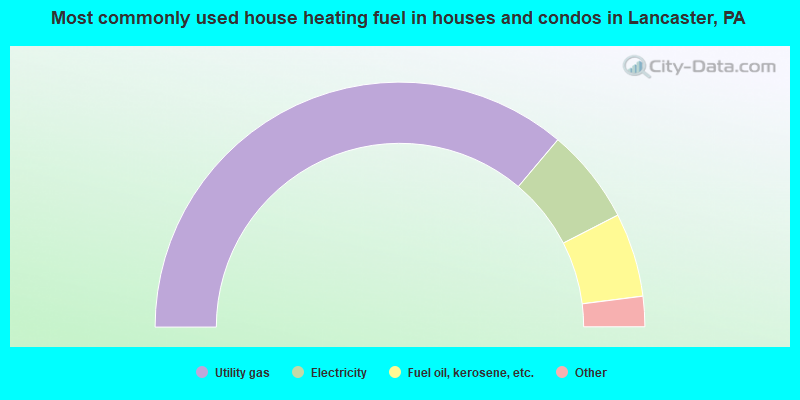
- 72.3%Utility gas
- 12.6%Electricity
- 11.1%Fuel oil, kerosene, etc.
- 1.8%Bottled, tank, or LP gas
- 1.1%No fuel used
- 0.6%Solar energy
- 0.4%Other fuel
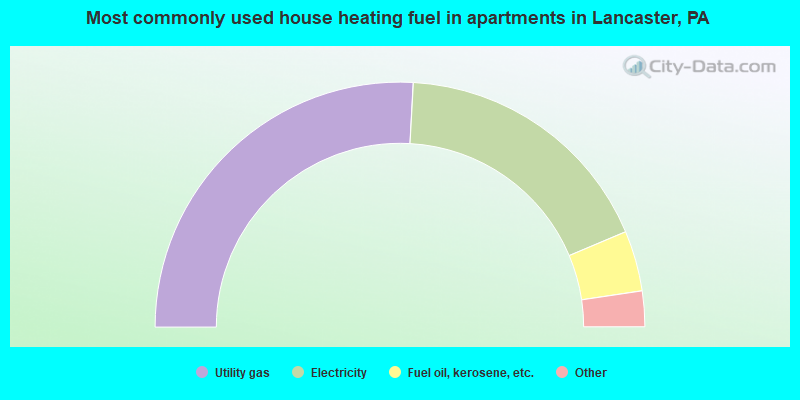
- 51.7%Utility gas
- 35.5%Electricity
- 8.0%Fuel oil, kerosene, etc.
- 1.7%Bottled, tank, or LP gas
- 1.7%Other fuel
- 1.1%No fuel used
- 0.2%Coal or coke
Lancaster compared to Pennsylvania state average:
- Unemployed percentage below state average.
- Hispanic race population percentage significantly above state average.
- Median age significantly below state average.
- Foreign-born population percentage above state average.
- Renting percentage above state average.
- House age above state average.
Lancaster on our top lists:
- #2 on the list of "Top 100 cities with old houses but young residents (pop. 50,000+)"
- #3 on the list of "Top 101 cities with the largest percentage of unmarried partner households (population 50,000+)"
- #4 on the list of "Top 100 cities with oldest houses (pop. 50,000+)"
- #8 on the list of "Top 101 cities with the most users submitting photos to our site per 10,000 residents (population 50,000+)"
- #12 on the list of "Top 101 cities with largest percentage of females in occupations: community and social service occupations (population 50,000+)"
- #25 on the list of "Top 101 cities with the smallest percentage of one, detached housing units in structures (20,000+ housing units)"
- #41 on the list of "Top 101 cities with the least cars per house, population 50,000+"
- #41 on the list of "Top 101 cities with the highest percentage of single-parent households, population 50,000+"
- #41 on the list of "Top 101 cities with largest percentage of males in occupations: production occupations (population 50,000+)"
- #46 on the list of "Top 101 cities with largest percentage of females in occupations: food preparation and serving related occupations (population 50,000+)"
- #47 on the list of "Top 101 cities with largest percentage of females in industries: health care and social assistance (population 50,000+)"
- #48 on the list of "Top 101 cities with largest percentage of males in occupations: food preparation and serving related occupations (population 50,000+)"
- #55 on the list of "Top 101 cities with largest percentage of females in industries: accommodation and food services (population 50,000+)"
- #56 on the list of "Top 101 cities with largest percentage of females in occupations: personal care and service occupations (population 50,000+)"
- #57 on the list of "Top 101 cities with largest percentage of males in industries: manufacturing (population 50,000+)"
- #60 on the list of "Top 101 cities with the highest number of thefts per 100,000 residents, excludes tourist destinations and others with a lot of outsiders visiting based on city industries data (population 50,000+)"
- #62 on the list of "Top 101 cities with the highest number of robberies per 100,000 residents, excludes tourist destinations and others with a lot of outsiders visiting based on city industries data (population 50,000+)"
- #69 on the list of "Top 101 cities where the highest percentage of females (15+ years) which never married (with at least 10,000 females in this group)"
- #71 on the list of "Top 101 cities with the highest number of rapes per 100,000 residents, excludes tourist destinations and others with a lot of outsiders visiting based on city industries data (population 50,000+)"
- #75 on the list of "Top 101 cities where the highest percentage of males (15+ years) which never married (with at least 10,000 males in this group)"
- #67 (17601) on the list of "Top 101 zip codes with the most beauty salons in 2005"
- #10 on the list of "Top 101 counties with the lowest percentage of residents relocating to other counties in 2011"
- #14 on the list of "Top 101 counties with the lowest percentage of residents relocating from other counties between 2010 and 2011 (pop. 50,000+)"
- #21 on the list of "Top 101 counties with the most Evangelical Protestant congregations"
- #24 on the list of "Top 101 counties with the most Mainline Protestant congregations"
- #25 on the list of "Top 101 counties with the highest Particulate Matter (PM2.5) Annual air pollution readings in 2012 (µg/m3)"

|
|
Total of 855 patent applications in 2008-2024.