Lancaster, PA (Pennsylvania) Houses and Residents
Estimated median house or condo value in 2022: $195,571 (it was $71,900 in 2000 )
Lancaster:
$195,571Pennsylvania:
$245,500
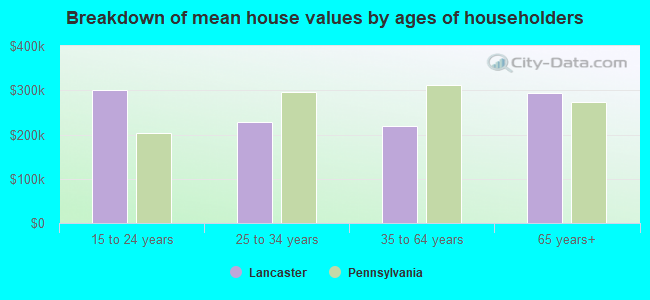
Lower value quartile - upper value quartile: $136,497 - $263,060Mean price in 2022: Detached houses: $248,276 Here:
$248,276State:
$317,202
Townhouses or other attached units: $223,318 Here:
$223,318State:
$254,369
In 2-unit structures: $285,294 Here:
$285,294State:
$249,182
In 3-to-4-unit structures: $342,607 Here:
$342,607State:
$297,446
In 5-or-more-unit structures: $677,892 Here:
$677,892State:
$320,068
Mobile homes: $46,648 Here:
$46,648State:
$92,414
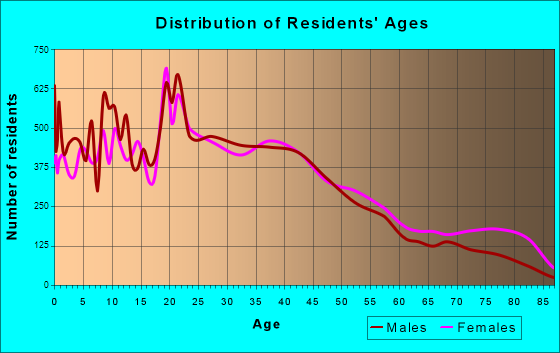
Total population: 59,302 (Urban population: 56,347, Rural population: 0)
Houses: 22,661 (21,468 occupied: 10,056 owner occupied, 11,485 renter occupied )
% of renters here:
53%State:
31%
Housing density: 3,063 houses/condos per square mile
Median price asked for vacant for-sale houses and condos in 2022: $141,145.
Median contract rent in 2022: $927 (lower quartile is $708, upper quartile is $1,134)
Median rent asked for vacant for-rent units in 2022: $900
Median gross rent in Lancaster, PA in 2022: $1,100
Housing units in Lancaster with a mortgage: 6,860 (656 second mortgage, 7 home equity loan, 539 both second mortgage and home equity loan )Houses without a mortgage: 259
Median household income for houses/condos with a mortgage: $93,390
Median household income for apartments without a mortgage: $75,933
Median monthly housing costs: $1,095
Data:
Median house or condo value ($)
Median house or condo value ($ change since 2000)
Median house or condo value ($) - White
Median house or condo value ($) - Black or African American
Median house or condo value ($) - Asian
Median house or condo value ($) - Hispanic or Latino
Median house or condo value ($) - American Indian and Alaska Native
Median house or condo value ($) - Multirace
Median house or condo value ($) - Other Race
Median price asked for mobile homes ($)
Household density (households per square mile)
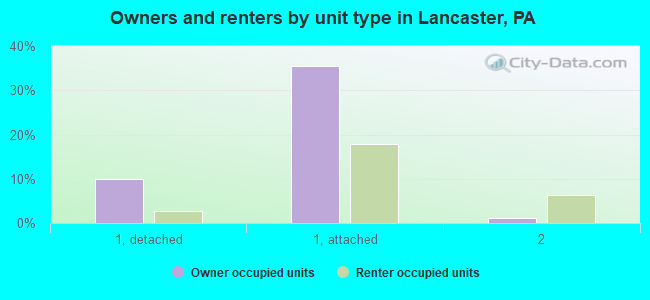
Mean house or condo value by units in structure - 1, detached ($)
Mean house or condo value by units in structure - 1, attached ($)
Mean house or condo value by units in structure - 2 ($)
Mean house or condo value by units in structure by units in structure - 3 or 4 ($)
Mean house or condo value by units in structure - 5 or more ($)
Mean house or condo value by units in structure - Boat, RV, van, etc. ($)
Mean house or condo value by units in structure - Mobile home ($)
Median contract rent ($)
Median contract rent - Lower quartile ($)
Median contract rent - Upper quartile ($)
Median gross rent ($)
Urban houses (%)
Rural houses (%)
Houses occupied (%)
Houses occupied (% change since 2000)
Houses owner occupied (%)
Houses owner occupied (% change since 2000)
Houses renter occupied (%)
Houses renter occupied (% change since 2000)
Vacant housing units - For rent (%)
Vacant housing units - For rent (% change since 2000)
Vacant housing units - For sale only (%)
Vacant housing units - For sale only (% change since 2000)
Vacant housing units - Rented or sold, not occupied (%)
Vacant housing units - Rented or sold, not occupied (% change since 2000)
Vacant housing units - For seasonal, recreational, or occasional use (%)
Vacant housing units - For seasonal, recreational, or occasional use (% change since 2000)
Vacant housing units - For migrant workers (%)
Vacant housing units - For migrant workers (% change since 2000)
Vacant housing units - Other vacant (%)
Vacant housing units - Other vacant (% change since 2000)
Median monthly housing costs ($)
Median household income for houses/condos with a mortgage ($)
Median household income for houses/condos without a mortgage ($)
Median household income ($)
Median household income ($) - White
Median household income ($) - Black or African American
Median household income ($) - Asian
Median household income ($) - Hispanic or Latino
Median household income ($) - American Indian and Alaska Native
Median household income ($) - Multirace
Median household income ($) - Other Race
Mortgage status - with mortgage (%)
Mortgage status - with second mortgage (%)
Mortgage status - with home equity loan (%)
Mortgage status - with both second mortgage and home equity loan (%)
Mortgage status - without a mortgage (%)
Median year house/condo built
Median year apartment built
Household type by relationship - Male householder living alone (%)
Household type by relationship - Male householder not living alone (%)
Household type by relationship - Female householder living alone (%)
Household type by relationship - Female householder not living alone (%)
Household type by relationship - Opposite-Sex spouse (%)
Household type by relationship - Same-Sex spouse (%)
Household type by relationship - Opposite-Sex unmarried partner (%)
Household type by relationship - Same-Sex unmarried partner (%)
Household type by relationship - In group quarters (%)
Size of family households - 2-person household (%)
Size of family households - 3-person household (%)
Size of family households - 4-person household (%)
Size of family households - 5-person household (%)
Size of family households - 6-person household (%)
Size of family households - 7-or-more-person household (%)
Size of nonfamily households - 1-person household (%)
Size of nonfamily households - 2-person household (%)
Size of nonfamily households - 3-person household (%)
Size of nonfamily households - 4-person household (%)
Size of nonfamily households - 5-person household (%)
Size of nonfamily households - 6-person household (%)
Size of nonfamily households - 7-or-moreperson household (%)
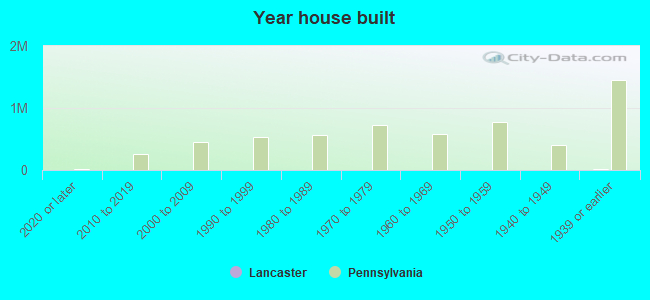
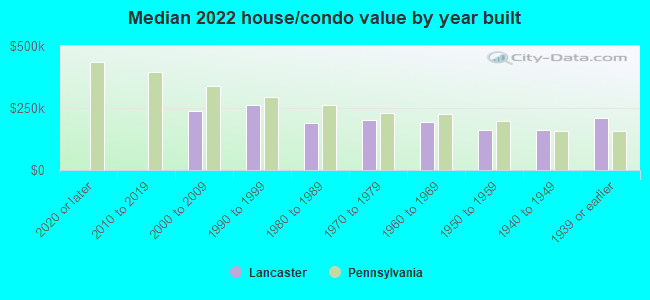
Year house built - Built 2010 or later (%)
Year house built - Built 2000 to 2009 (%)
Year house built - Built 1990 to 1999 (%)
Year house built - Built 1980 to 1989 (%)
Year house built - Built 1970 to 1979 (%)
Year house built - Built 1960 to 1969 (%)
Year house built - Built 1950 to 1959 (%)
Year house built - Built 1940 to 1949 (%)
Year house built - Built 1939 or earlier (%)
Median number of rooms in houses and condos
Median number of rooms in apartments
Median number of bedrooms in owner occupied houses
Mean number of bedrooms in owner occupied houses
Median number of bedrooms in renter occupied houses
Mean number of bedrooms in renter occupied houses
Median number of vehichles in owner occupied houses
Mean number of vehichles in owner occupied houses
Median number of vehichles in renter occupied houses
Mean number of vehichles in renter occupied houses
Rooms in owner-occupied houses - 1 room (%)
Rooms in owner-occupied houses - 2 rooms (%)
Rooms in owner-occupied houses - 3 rooms (%)
Rooms in owner-occupied houses - 4 rooms (%)
Rooms in owner-occupied houses - 5 rooms (%)
Rooms in owner-occupied houses - 6 rooms (%)
Rooms in owner-occupied houses - 7 rooms (%)
Rooms in owner-occupied houses - 8 rooms (%)
Rooms in owner-occupied houses - 9+ rooms (%)
Rooms in renter-occupied houses - 1 room (%)
Rooms in renter-occupied houses - 2 rooms (%)
Rooms in renter-occupied houses - 3 rooms (%)
Rooms in renter-occupied houses - 4 rooms (%)
Rooms in renter-occupied houses - 5 rooms (%)
Rooms in renter-occupied houses - 6 rooms (%)
Rooms in renter-occupied houses - 7 rooms (%)
Rooms in renter-occupied houses - 8 rooms (%)
Rooms in renter-occupied houses - 9+ rooms (%)
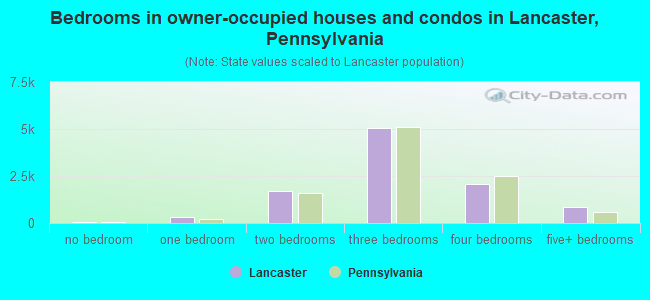
Bedrooms in owner-occupied houses - no bedrooms (%)
Bedrooms in owner-occupied houses - 1 bedroom (%)
Bedrooms in owner-occupied houses - 2 bedrooms (%)
Bedrooms in owner-occupied houses - 3 bedrooms (%)
Bedrooms in owner-occupied houses - 4 bedrooms (%)
Bedrooms in owner-occupied houses - 5+ bedrooms (%)
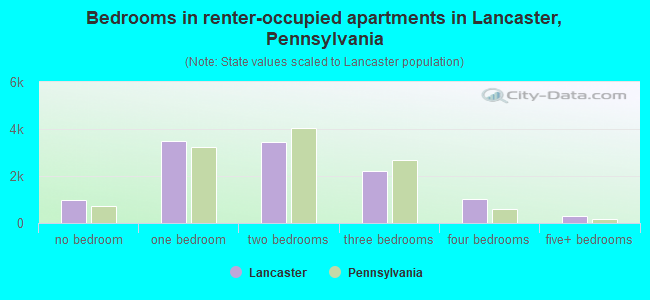
Bedrooms in renter-occupied houses - no bedrooms (%)
Bedrooms in renter-occupied houses - 1 bedroom (%)
Bedrooms in renter-occupied houses - 2 bedrooms (%)
Bedrooms in renter-occupied houses - 3 bedrooms (%)
Bedrooms in renter-occupied houses - 4 bedrooms (%)
Bedrooms in renter-occupied houses - 5+ bedrooms (%)
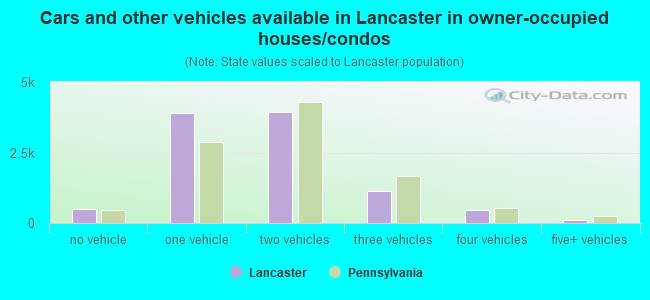
Vehicles available in owner-occupied houses - no vehicle available (%)
Vehicles available in owner-occupied houses - 1 vehicle available(%)
Vehicles available in owner-occupied houses - 2 Vehicles available (%)
Vehicles available in owner-occupied houses - 3 Vehicles available (%)
Vehicles available in owner-occupied houses - 4 Vehicles available (%)
Vehicles available in owner-occupied houses - 5+ Vehicles available (%)
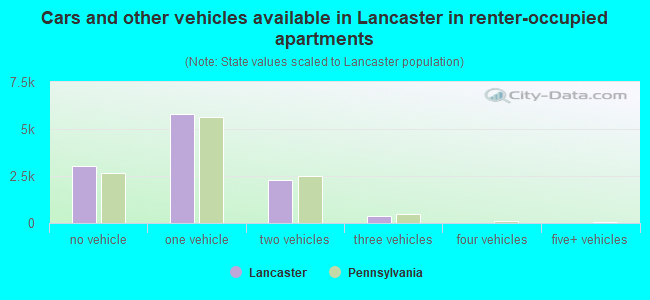
Vehicles available in renter-occupied houses - no vehicle available (%)
Vehicles available in renter-occupied houses - 1 vehicle available (%)
Vehicles available in renter-occupied houses - 2 Vehicles available (%)
Vehicles available in renter-occupied houses - 3 Vehicles available (%)
Vehicles available in renter-occupied houses - 4 Vehicles available (%)
Vehicles available in renter-occupied houses - 5+ Vehicles available (%)
Housing units in structures - 1, detached (%)
Housing units in structures - 1, attached (%)
Housing units in structures - 2 (%)
Housing units in structures - 3 or 4 (%)
Housing units in structures - 5 to 9 (%)
Housing units in structures - 10 to 19 (%)
Housing units in structures - 20 to 49 (%)
Housing units in structures - 50 or more (%)
Housing units in structures - Mobile home (%)
Housing units in structures - Boat, RV, van, etc. (%)
Housing units in structures - Owners - 1, detached (%)
Housing units in structures - Owners - 1, attached (%)
Housing units in structures - Owners - 2 (%)
Housing units in structures - Owners - 3 or 4 (%)
Housing units in structures - Owners - 5 to 9 (%)
Housing units in structures - Owners - 10 to 19 (%)
Housing units in structures - Owners - 20 to 49 (%)
Housing units in structures - Owners - 50 or more (%)
Housing units in structures - Owners - Mobile home (%)
Housing units in structures - Owners - Boat, RV, van, etc. (%)
Housing units in structures - Renters - 1, detached (%)
Housing units in structures - Renters - 1, attached (%)
Housing units in structures - Renters - 2 (%)
Housing units in structures - Renters - 3 or 4 (%)
Housing units in structures - Renters - 5 to 9 (%)
Housing units in structures - Renters - 10 to 19 (%)
Housing units in structures - Renters - 20 to 49 (%)
Housing units in structures - Renters - 50 or more (%)
Housing units in structures - Renters - Mobile home (%)
Housing units in structures - Renters - Boat, RV, van, etc. (%)
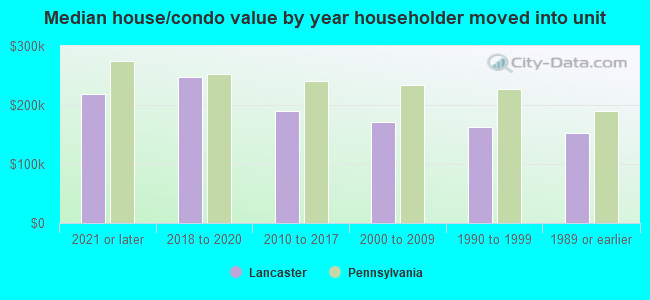
House/condo owner moved in on average (years ago)
Renter moved in on average (years ago)
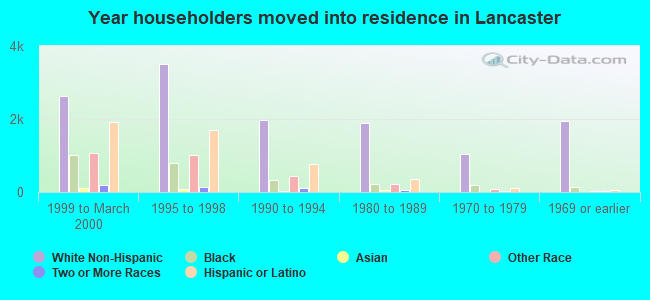
Year householder moved into unit - Moved in 1999 to March 2000 (%)
Year householder moved into unit - Moved in 1999 to March 2000 (%) - White
Year householder moved into unit - Moved in 1999 to March 2000 (%) - Black or African American
Year householder moved into unit - Moved in 1999 to March 2000 (%) - Asian
Year householder moved into unit - Moved in 1999 to March 2000 (%) - Hispanic or Latino
Year householder moved into unit - Moved in 1999 to March 2000 (%) - American Indian and Alaska Native
Year householder moved into unit - Moved in 1999 to March 2000 (%) - Multirace
Year householder moved into unit - Moved in 1999 to March 2000 (%) - Other Race
Year householder moved into unit - Moved in 1995 to 1998 (%)
Year householder moved into unit - Moved in 1995 to 1998 (%) - White
Year householder moved into unit - Moved in 1995 to 1998 (%) - Black or African American
Year householder moved into unit - Moved in 1995 to 1998 (%) - Asian
Year householder moved into unit - Moved in 1995 to 1998 (%) - Hispanic or Latino
Year householder moved into unit - Moved in 1995 to 1998 (%) - American Indian and Alaska Native
Year householder moved into unit - Moved in 1995 to 1998 (%) - Multirace
Year householder moved into unit - Moved in 1995 to 1998 (%) - Other Race
Year householder moved into unit - Moved in 1990 to 1994 (%)
Year householder moved into unit - Moved in 1990 to 1994 (%) - White
Year householder moved into unit - Moved in 1990 to 1994 (%) - Black or African American
Year householder moved into unit - Moved in 1990 to 1994 (%) - Asian
Year householder moved into unit - Moved in 1990 to 1994 (%) - Hispanic or Latino
Year householder moved into unit - Moved in 1990 to 1994 (%) - American Indian and Alaska Native
Year householder moved into unit - Moved in 1990 to 1994 (%) - Multirace
Year householder moved into unit - Moved in 1990 to 1994 (%) - Other Race
Year householder moved into unit - Moved in 1980 to 1989 (%)
Year householder moved into unit - Moved in 1980 to 1989 (%) - White
Year householder moved into unit - Moved in 1980 to 1989 (%) - Black or African American
Year householder moved into unit - Moved in 1980 to 1989 (%) - Asian
Year householder moved into unit - Moved in 1980 to 1989 (%) - Hispanic or Latino
Year householder moved into unit - Moved in 1980 to 1989 (%) - American Indian and Alaska Native
Year householder moved into unit - Moved in 1980 to 1989 (%) - Multirace
Year householder moved into unit - Moved in 1980 to 1989 (%) - Other Race
Year householder moved into unit - Moved in 1970 to 1979 (%)
Year householder moved into unit - Moved in 1970 to 1979 (%) - White
Year householder moved into unit - Moved in 1970 to 1979 (%) - Black or African American
Year householder moved into unit - Moved in 1970 to 1979 (%) - Asian
Year householder moved into unit - Moved in 1970 to 1979 (%) - Hispanic or Latino
Year householder moved into unit - Moved in 1970 to 1979 (%) - American Indian and Alaska Native
Year householder moved into unit - Moved in 1970 to 1979 (%) - Multirace
Year householder moved into unit - Moved in 1970 to 1979 (%) - Other Race
Year householder moved into unit - Moved in 1969 or earlier (%)
Year householder moved into unit - Moved in 1969 or earlier (%) - White
Year householder moved into unit - Moved in 1969 or earlier (%) - Black or African American
Year householder moved into unit - Moved in 1969 or earlier (%) - Asian
Year householder moved into unit - Moved in 1969 or earlier (%) - Hispanic or Latino
Year householder moved into unit - Moved in 1969 or earlier (%) - American Indian and Alaska Native
Year householder moved into unit - Moved in 1969 or earlier (%) - Multirace
Year householder moved into unit - Moved in 1969 or earlier (%) - Other Race
Housing units lacking complete plumbing facilities (%)
Housing units lacking complete kitchen facilities (%)
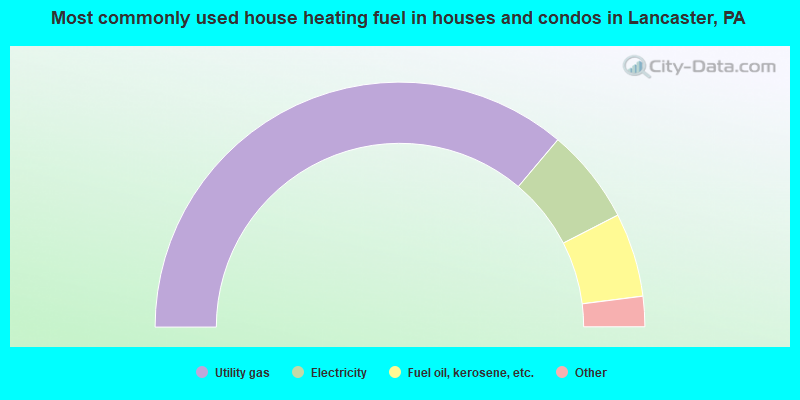
House heating fuel used in houses and condos - Utility gas (%)
House heating fuel used in houses and condos - Bottled, tank, or LP gas (%)
House heating fuel used in houses and condos - Electricity (%)
House heating fuel used in houses and condos - Fuel oil, kerosene, etc. (%)
House heating fuel used in houses and condos - Coal or coke (%)
House heating fuel used in houses and condos - Wood (%)
House heating fuel used in houses and condos - Solar energy (%)
House heating fuel used in houses and condos - Other fuel (%)
House heating fuel used in houses and condos - No fuel used (%)
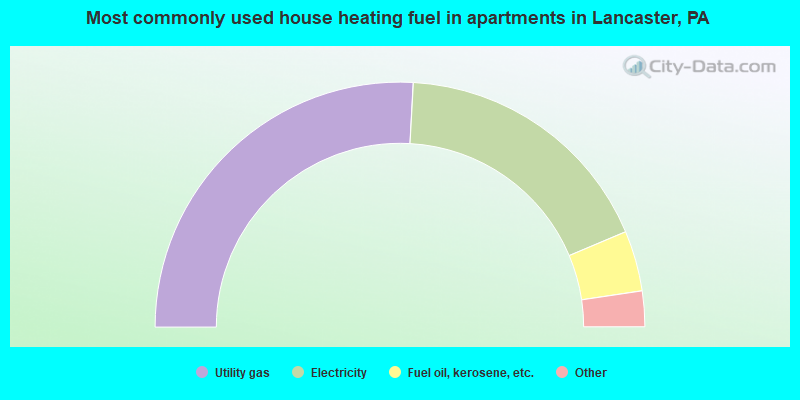
House heating fuel used in apartments - Utility gas (%)
House heating fuel used in apartments - Bottled, tank, or LP gas (%)
House heating fuel used in apartments - Electricity (%)
House heating fuel used in apartments - Fuel oil, kerosene, etc. (%)
House heating fuel used in apartments - Coal or coke (%)
House heating fuel used in apartments - Wood (%)
House heating fuel used in apartments - Solar energy (%)
House heating fuel used in apartments - Other fuel (%)
House heating fuel used in apartments - No fuel used (%)
Latest news about housing in Lancaster, PA collected exclusively by city-data.com from local newspapers, TV, and radio stations
Median year house/condo built: 1939Median year apartment built: 1951Household type by relationship:
Households: 58,329
Male householders: 9,419 (2,841 living alone ), Female householders: 11,945 (3,850 living alone )7,196 spouses (7,114 opposite-sex spouses ), 2,447 unmarried partners , (2,166 opposite-sex unmarried partners ), 17,212 children (16,172 natural , 261 adopted , 778 stepchildren ), 1,285 grandchildren , 758 brothers or sisters , 770 parents , 14 foster children , 1,201 other relatives , 2,353 non-relatives In group quarters: 3,722
Size of family households: 4,183 2-persons , 3,354 3-persons , 2,568 4-persons , 1,113 5-persons , 586 6-persons , 453 7-or-more-persons .
Size of nonfamily households: 6,961 1-person , 2,035 2-persons , 386 3-persons , 54 4-persons .
6,013 married couples with children. single-parent households (1,076 men , 4,408 women ).
67.7% of residents of Lancaster speak English at home. of residents speak Spanish at home (58% speak English very well , 20% speak English well , 10% speak English not well , 12% don't speak English at all ).of residents speak other Indo-European language at home (38% speak English very well , 43% speak English well , 15% speak English not well , 4% don't speak English at all ).of residents speak Asian or Pacific Island language at home (36% speak English very well , 36% speak English well , 20% speak English not well , 9% don't speak English at all ).of residents speak other language at home (31% speak English very well , 24% speak English well , 14% speak English not well , 31% don't speak English at all ).
Foreign born population: 6,285 (10.8%)of them are naturalized citizens )
Median number of rooms in houses and condos:
Median number of rooms in apartments
Owner-occupied Renter-occupied
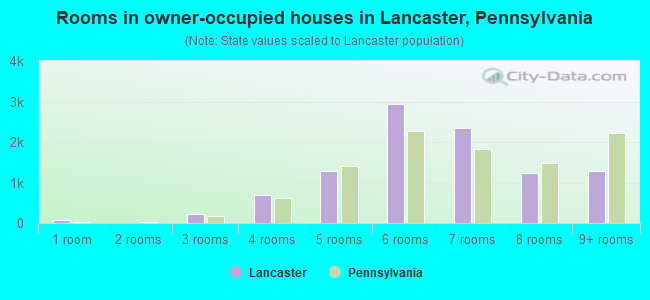
Rooms in owner-occupied houses in Lancaster, Pennsylvania
63 1 room 0 2 rooms 217 3 rooms 698 4 rooms 1,276 5 rooms 2,947 6 rooms 2,348 7 rooms 1,229 8 rooms 1,279 9+ rooms
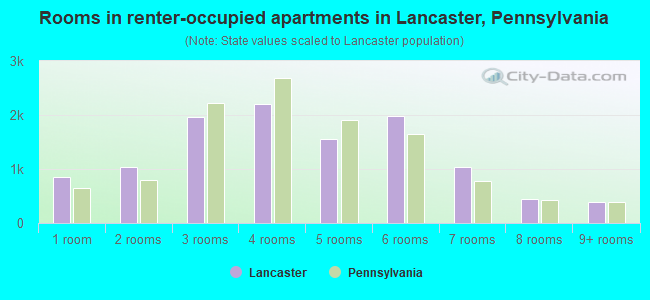
Rooms in renter-occupied apartments in Lancaster, Pennsylvania
856 1 room 1,035 2 rooms 1,971 3 rooms 2,198 4 rooms 1,562 5 rooms 1,990 6 rooms 1,034 7 rooms 452 8 rooms 386 9+ rooms
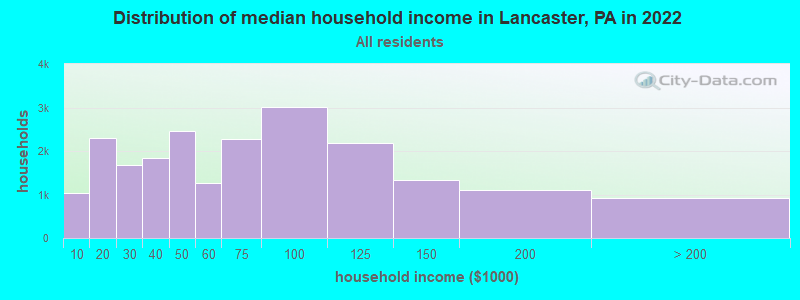
Lancaster, PA household income distribution 1,042 Less than $10,0002,291 $10,000 to $19,9991,667 $20,000 to $29,9991,850 $30,000 to $39,9992,450 $40,000 to $49,9991,257 $50,000 to $59,9992,277 $60,000 to $74,9993,022 $75,000 to $99,9992,174 $100,000 to $124,9991,325 $125,000 to $149,9991,093 $150,000 to $199,999916 $200,000 or more
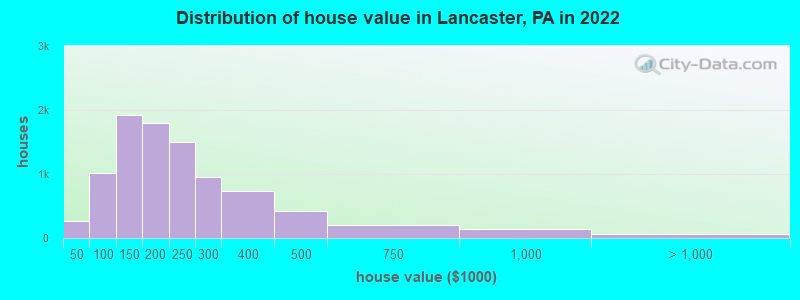
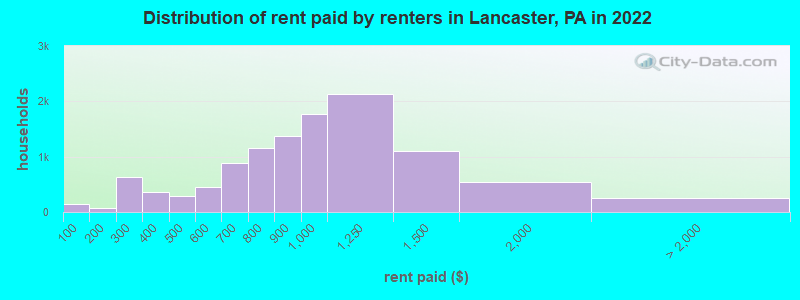
Home value of owner - occupied houses in 2022 in Lancaster, PA 21 Less than $10,000147 $10,000 to $14,99960 $20,000 to $24,9996 $25,000 to $29,99911 $30,000 to $34,99922 $40,000 to $49,99963 $50,000 to $59,999133 $60,000 to $69,999268 $70,000 to $79,999276 $80,000 to $89,999252 $90,000 to $99,9991,064 $100,000 to $124,999855 $125,000 to $149,999999 $150,000 to $174,999794 $175,000 to $199,9991,498 $200,000 to $249,999946 $250,000 to $299,999735 $300,000 to $399,999426 $400,000 to $499,999208 $500,000 to $749,999140 $750,000 to $999,9997 $1,000,000 to $1,499,99953 $2,000,000 or moreRent paid by renters in 2022 in Lancaster, PA 147 Less than $10033 $100 to $14947 $150 to $199200 $200 to $249439 $250 to $299215 $300 to $349145 $350 to $399160 $400 to $449130 $450 to $499319 $500 to $549123 $550 to $599506 $600 to $649382 $650 to $699520 $700 to $749641 $750 to $7991,375 $800 to $8991,764 $900 to $9992,128 $1,000 to $1,2491,109 $1,250 to $1,499548 $1,500 to $1,99959 $2,000 to $2,499191 No cash rent
Percentage of workers working in this county: 90.3%Number of people working at home: 2,448 (8.4% of all workers )
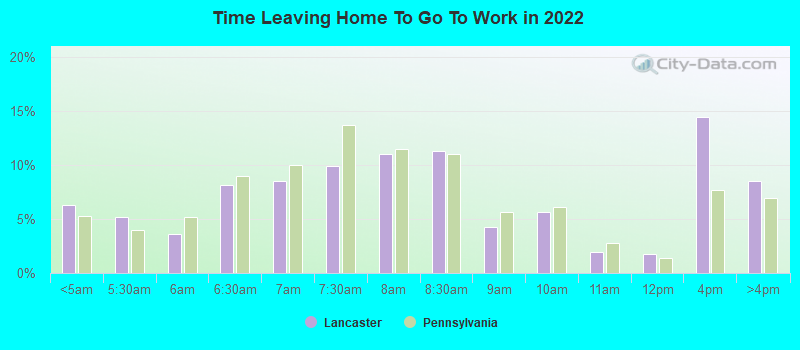
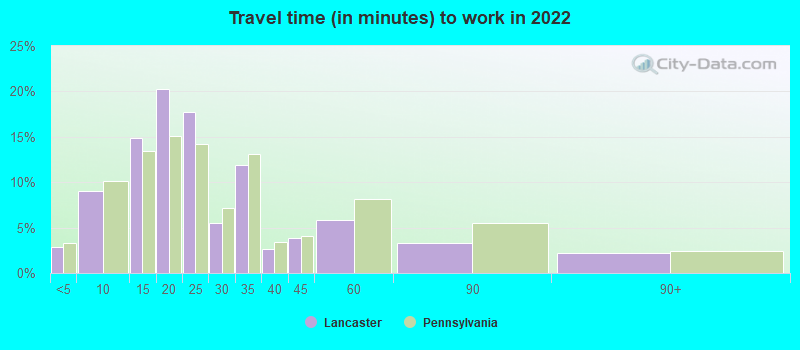
Travel time to work (commute)
Less than 5 minutes: 6725 to 9 minutes: 2,91610 to 14 minutes: 4,76315 to 19 minutes: 5,49520 to 24 minutes: 3,16425 to 29 minutes: 1,49730 to 34 minutes: 3,24235 to 39 minutes: 1,14340 to 44 minutes: 86245 to 59 minutes: 1,32460 to 89 minutes: 85290 or more minutes: 531
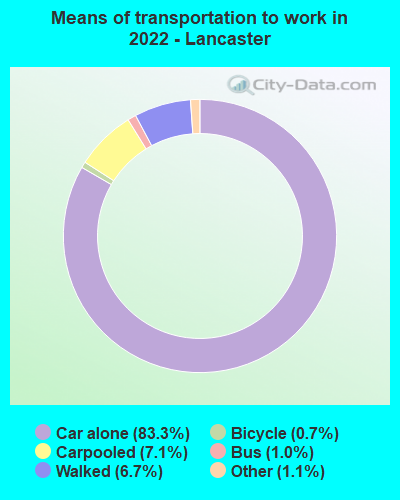
Means of transportation to work:
Drove a car alone: 34,204 (77.3%)Carpooled: 2,879 (6.5%)Bus : 485 (1.1%)Subway or elevated rail : 4 (0.0%)Long-distance train or commuter rail : 37 (0.1%)Taxi: 647 (1.5%)Bicycle: 351 (0.8%)Walked: 3,260 (7.4%)Worked at home: 2,448 (5.5%)
Unemployment by race in 2022
Unemployment rate for White non-Hispanic residents 4.3% Males2.9% FemalesUnemployment rate for Black residents 4.8% Males20.6% FemalesUnemployment rate for other race residents 11.1% Males11.7% FemalesUnemployment rate for two or more race residents 6.5% Males12.8% FemalesUnemployment rate for Hispanic or Latino residents 10.0% Males5.9% Females
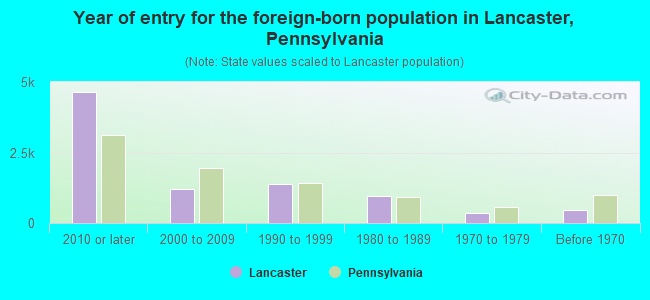
Year of entry for the foreign-born population in Lancaster, Pennsylvania
4,662 2010 or later 1,206 2000 to 2009 1,371 1990 to 1999 947 1980 to 1989 344 1970 to 1979 470 Before 1970
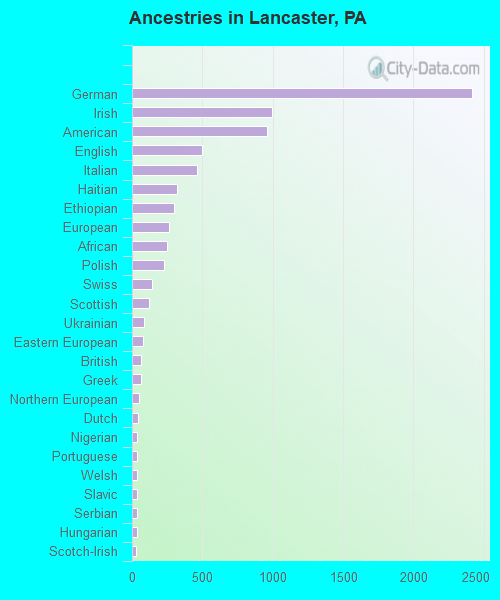
First ancestries reported:
German: 2,416 (9.1%)
Irish: 998 (3.8%)
American: 958 (3.6%)
English: 498 (1.9%)
Italian: 459 (1.7%)
Haitian: 322 (1.2%)
Ethiopian: 299 (1.1%)
European: 262 (1.0%)
African: 247 (0.9%)
Polish: 227 (0.9%)
Swiss: 141 (0.5%)
Scottish: 121 (0.5%)
Ukrainian: 87 (0.3%)
Eastern European: 79 (0.3%)
British: 64 (0.2%)
Greek: 64 (0.2%)
Northern European: 48 (0.2%)
Dutch: 44 (0.2%)
Nigerian: 39 (0.1%)
Portuguese: 39 (0.1%)
Welsh: 39 (0.1%)
Slavic: 38 (0.1%)
Serbian: 36 (0.1%)
Hungarian: 34 (0.1%)
Scotch-Irish: 31 (0.1%)
Swedish: 22 (0.08%)
Jamaican: 20 (0.08%)
Norwegian: 19 (0.07%)
French Canadian: 19 (0.07%)
French: 19 (0.07%)
Pennsylvania German: 18 (0.07%)
Slovak: 15 (0.06%)
Russian: 14 (0.05%)
Turkish: 14 (0.05%)
Canadian: 11 (0.04%)
Palestinian: 9 (0.03%)
Finnish: 8 (0.03%)
Romanian: 8 (0.03%)
Croatian: 7 (0.03%)
Yugoslavian: 4 (0.02%)
Israeli: 3 (0.01%)
Scandinavian: 2 (0.01%)
Dutch West Indian: 2 (0.01%) Most common places of birth for foreign-born residents (%): Dominican Republic Lancaster:
29.2% (2,251)Pennsylvania:
9.2% (86,544)
Cuba Lancaster:
15.8% (1,217)Pennsylvania:
0.6% (6,036)
Congo Lancaster:
7.0% (540)Pennsylvania:
0.1% (731)
Colombia Lancaster:
4.8% (371)Pennsylvania:
1.5% (13,823)
Vietnam Lancaster:
4.6% (355)Pennsylvania:
3.3% (31,542)
Korea Lancaster:
3.8% (291)Pennsylvania:
2.9% (27,433)
Peru Lancaster:
3.7% (284)Pennsylvania:
0.7% (6,690)
China, excluding Hong Kong and Taiwan Lancaster:
3.6% (280)Pennsylvania:
7.2% (67,704)
Ethiopia Lancaster:
3.6% (274)Pennsylvania:
0.5% (4,658)
Nepal Lancaster:
3.5% (272)Pennsylvania:
0.7% (6,855)
Haiti Lancaster:
3.4% (260)Pennsylvania:
1.6% (15,224)
Mexico Lancaster:
3.2% (249)Pennsylvania:
5.8% (54,190)
Tanzania Lancaster:
2.6% (203)Pennsylvania:
0.1% (1,263)
Democratic Republic of Congo (Zaire) Lancaster:
2.5% (191)Pennsylvania:
0.1% (1,033)
Guatemala Lancaster:
1.7% (128)Pennsylvania:
1.4% (13,268)
Place of birth for U.S.-born residents:
This state: 33,760Other state: 11,749Northeast: 6,265Midwest: 1,272South: 3,142West: 1,228 83.3% of Lancaster residents lived in the same house 1 years ago.
Out of people who lived in different houses, 31.9% lived in this county.
Out of people who lived in different counties, 57.3% lived in Pennsylvania.
Lancaster:
83.3%State average:
89.3%
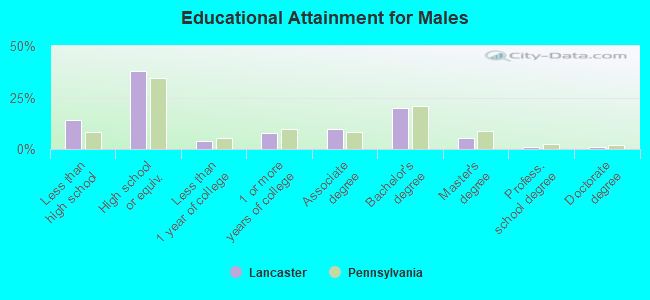
Education attainment for males 25 years and older:
No schooling: 325Nursery to 4th grade: 1405th and 6th grade: 1127th and 8th grade: 2529th grade: 11710th grade: 35611th grade: 37812th grade, no diploma: 712High school graduate (or equivalency): 6,458Less than 1 year of college: 656Some college more than 1 year, no degree: 1,348Associate degree: 1,665Bachelor's degree: 3,375Master's degree: 890Professional school degree: 141Doctorate degree: 174
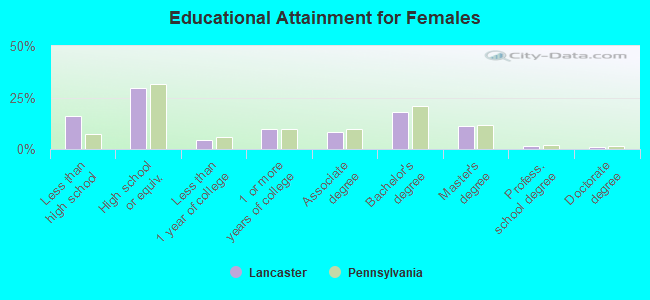
Education attainment for females 25 years and older:
No schooling: 737Nursery to 4th grade: 3415th and 6th grade: 3557th and 8th grade: 2979th grade: 42410th grade: 35811th grade: 41612th grade, no diploma: 276High school graduate (or equivalency): 5,894Less than 1 year of college: 860Some college more than 1 year, no degree: 1,931Associate degree: 1,645Bachelor's degree: 3,590Master's degree: 2,184Professional school degree: 282Doctorate degree: 183
Housing units in structures:
One, detached: 2,781One, attached: 11,893Two: 1,7413 or 4: 2,1215 to 9: 1,66910 to 19: 46920 to 49: 86550 or more: 1,059Mobile homes: 61Median worth of mobile homes: $53,176
Housing units lacking complete plumbing facilities in 2022: 0.8%Housing units lacking complete kitchen facilities in 2022: 1.6%House/condo owner moved in on average 10 years ago
Renter moved in on average 3 years ago
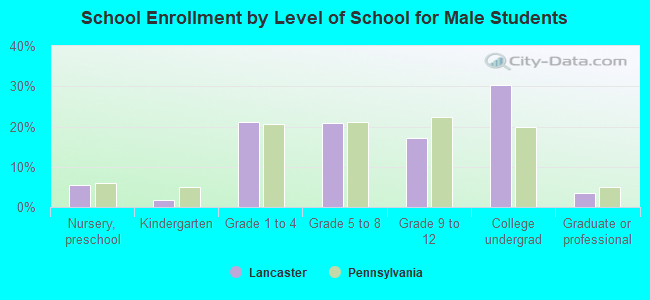
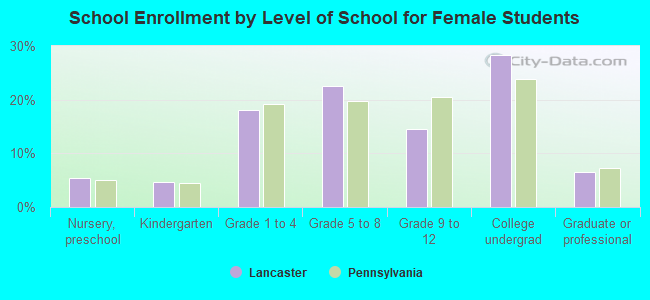
Private vs. public school enrollment:
Students in private schools in grades 1 to 8 (elementary and middle school): 899 Here:
13.8%Pennsylvania:
15.7%
Students in private schools in grades 9 to 12 (high school): 192 Here:
7.8%Pennsylvania:
13.4%
Students in private undergraduate colleges: 2,066 Here:
46.3%Pennsylvania:
39.8%