Estimated zip code population in 2022: 43,251 Zip code population in 2010: 44,661 Zip code population in 2000: 46,478
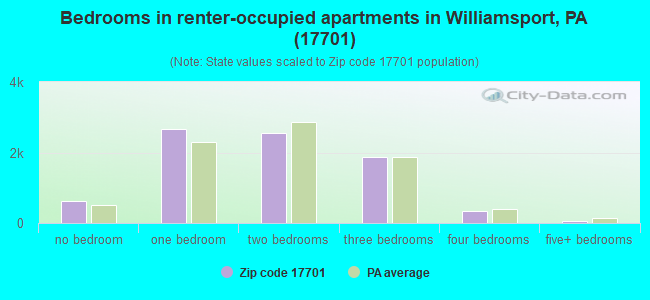
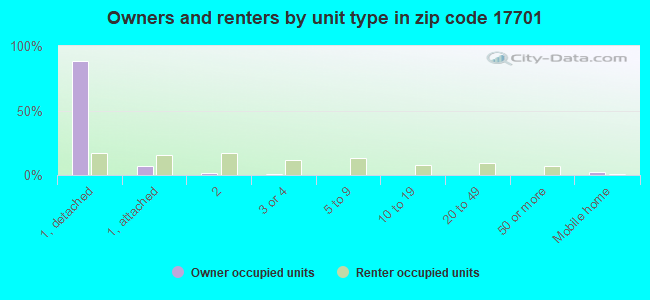
Houses and condos: 20,874 Renter-occupied apartments: 8,100
% of renters here:
45%
State:
31%
March 2022 cost of living index in zip code 17701: 92.1 (less than average, U.S. average is 100)
Land area: 89.4 sq. mi. Water area: 1.5 sq. mi.
Population density: 484 people per square mile
(low).
OSM Map
General Map
Google Map
MSN Map
OSM Map
General Map
Google Map
MSN Map
OSM Map
General Map
Google Map
MSN Map
OSM Map
General Map
Google Map
MSN Map
Please wait while loading the map...
Real estate property taxes paid for housing units in 2022:
This zip code:
1.5% ($2,667)
Pennsylvania:
1.3% ($3,094)
Median real estate property taxes paid for housing units with mortgages in 2022: $2,729 (1.5%) Median real estate property taxes paid for housing units with no mortgage in 2022: $2,579 (1.5%)
Averages for the 2020 tax year for zip code 17701, filed in 2021:
Average Adjusted Gross Income (AGI) in 2020: $54,997 (Individual Income Tax Returns)
Here:
$54,997
State:
$75,707
Salary/wage: $44,204 (reported on 82.4% of returns)
Here:
$44,204
State:
$62,806
(% of AGI for various income ranges: 1070.3% for AGIs below $25k, 3288.9% for AGIs $25k-50k, 6177.9% for AGIs $50k-75k, 8998.9% for AGIs $75k-100k, 15248.9% for AGIs $100k-200k, 76283.3% for AGIs over 200k)
Taxable interest for individuals: $1,404 (reported on 25.5% of returns)
This zip code:
$1,404
Pennsylvania:
$1,633
(% of AGI for various income ranges: 10.7% for AGIs below $25k, 14.5% for AGIs $25k-50k, 35.1% for AGIs $50k-75k, 46.9% for AGIs $75k-100k, 151.1% for AGIs $100k-200k, 1918.7% for AGIs over 200k)
Ordinary dividends: $6,274 (reported on 16.5% of returns)
Here:
$6,274
State:
$7,382
(% of AGI for various income ranges: 24.1% for AGIs below $25k, 30.2% for AGIs $25k-50k, 83.0% for AGIs $50k-75k, 141.3% for AGIs $75k-100k, 463.6% for AGIs $100k-200k, 6174.0% for AGIs over 200k)
Net capital gain/loss in AGI: +$13,896 (reported on 13.5% of returns)
Here:
+$13,896
State:
+$23,522
(% of AGI for various income ranges: 9.1% for AGIs below $25k, 23.1% for AGIs $25k-50k, 78.7% for AGIs $50k-75k, 145.0% for AGIs $75k-100k, 600.2% for AGIs $100k-200k, 16836.7% for AGIs over 200k)
Profit/loss from business: +$13,290 (reported on 9.8% of returns)
Here:
+$13,290
State:
+$16,274
(% of AGI for various income ranges: 41.5% for AGIs below $25k, 76.2% for AGIs $25k-50k, 143.0% for AGIs $50k-75k, 197.7% for AGIs $75k-100k, 569.9% for AGIs $100k-200k, 5676.0% for AGIs over 200k)
Taxable individual retirement arrangement distribution: $15,356 (reported on 10.1% of returns)
17701:
$15,356
Pennsylvania:
$18,583
(% of AGI for various income ranges: 55.7% for AGIs below $25k, 86.4% for AGIs $25k-50k, 208.0% for AGIs $50k-75k, 326.0% for AGIs $75k-100k, 878.1% for AGIs $100k-200k, 4073.3% for AGIs over 200k)
Self-employed (Keogh) retirement plans: $20,414 (reported on 0.4% of returns)
17701:
$20,414
Pennsylvania:
$25,407
(% of AGI for various income ranges: 57.3% for AGIs $100k-200k, 544.0% for AGIs over 200k)
Total itemized deductions: $36,562 (reported on 4.0% of returns)
Here:
$36,562
State:
$34,850
(% of AGI for various income ranges: 27.2% for AGIs below $25k, 63.3% for AGIs $25k-50k, 146.8% for AGIs $50k-75k, 268.1% for AGIs $75k-100k, 612.8% for AGIs $100k-200k, 7794.7% for AGIs over 200k)
Charity contributions: $15,819 (reported on 3.2% of returns)
Here:
$15,819
State:
$12,392
(% of AGI for various income ranges: 0.9% for AGIs below $25k, 6.2% for AGIs $25k-50k, 30.9% for AGIs $50k-75k, 59.2% for AGIs $75k-100k, 200.7% for AGIs $100k-200k, 4034.0% for AGIs over 200k)
Taxes paid: $7,687 (reported on 4.0% of returns)
17701:
$7,687
State:
$8,200
(% of AGI for various income ranges: 2.5% for AGIs below $25k, 9.3% for AGIs $25k-50k, 37.3% for AGIs $50k-75k, 74.6% for AGIs $75k-100k, 176.1% for AGIs $100k-200k, 1318.0% for AGIs over 200k)
Earned income credit: $2,198 (reported on 19.8% of returns)
Here:
$2,198
State:
$2,100
(% of AGI for various income ranges: 95.8% for AGIs below $25k, 71.4% for AGIs $25k-50k, 1.2% for AGIs $50k-75k)
Percentage of individuals using paid preparers for their 2020 taxes: 94.2%
Here:
94%
State:
92%
(% for various income ranges: 94.0% for AGIs below $25k, 95.4% for AGIs $25k-50k, 93.3% for AGIs $50k-75k, 93.6% for AGIs $75k-100k, 93.3% for AGIs $100k-200k, 96.0% for AGIs over 200k)
Averages for the 2012 tax year for zip code 17701, filed in 2013:
Average Adjusted Gross Income (AGI) in 2012: $45,380 (Individual Income Tax Returns)
Here:
$45,380
State:
$61,346
Salary/wage: $37,610 (reported on 84.6% of returns)
Here:
$37,610
State:
$51,902
(% of AGI for various income ranges: 76.3% for AGIs below $25k, 80.8% for AGIs $25k-50k, 78.6% for AGIs $50k-75k, 77.4% for AGIs $75k-100k, 70.7% for AGIs $100k-200k, 41.6% for AGIs over 200k)
Taxable interest for individuals: $1,323 (reported on 28.6% of returns)
This zip code:
$1,323
Pennsylvania:
$1,588
(% of AGI for various income ranges: 1.0% for AGIs below $25k, 0.7% for AGIs $25k-50k, 0.6% for AGIs $50k-75k, 0.6% for AGIs $75k-100k, 0.6% for AGIs $100k-200k, 1.5% for AGIs over 200k)
Ordinary dividends: $6,373 (reported on 18.9% of returns)
Here:
$6,373
State:
$5,827
(% of AGI for various income ranges: 1.8% for AGIs below $25k, 1.1% for AGIs $25k-50k, 1.5% for AGIs $50k-75k, 1.9% for AGIs $75k-100k, 2.4% for AGIs $100k-200k, 6.6% for AGIs over 200k)
Net capital gain/loss in AGI: +$8,313 (reported on 12.8% of returns)
Here:
+$8,313
State:
+$14,495
(% of AGI for various income ranges: 0.5% for AGIs $25k-50k, 0.7% for AGIs $50k-75k, 0.6% for AGIs $75k-100k, 1.7% for AGIs $100k-200k, 9.2% for AGIs over 200k)
Profit/loss from business: +$15,864 (reported on 9.6% of returns)
Here:
+$15,864
State:
+$16,268
(% of AGI for various income ranges: 3.4% for AGIs below $25k, 2.1% for AGIs $25k-50k, 1.7% for AGIs $50k-75k, 2.5% for AGIs $75k-100k, 4.2% for AGIs $100k-200k, 5.9% for AGIs over 200k)
Taxable individual retirement arrangement distribution: $12,693 (reported on 10.4% of returns)
17701:
$12,693
Pennsylvania:
$14,550
(% of AGI for various income ranges: 2.9% for AGIs below $25k, 2.4% for AGIs $25k-50k, 2.4% for AGIs $50k-75k, 3.2% for AGIs $75k-100k, 3.6% for AGIs $100k-200k, 3.1% for AGIs over 200k)
Self-employment retirement plans: $16,990 (reported on 0.5% of returns)
17701:
$16,990
Pennsylvania:
$20,922
(% of AGI for various income ranges: 0.1% for AGIs $25k-50k, 0.3% for AGIs $100k-200k, 0.6% for AGIs over 200k)
Total itemized deductions: $20,272 (19% of AGI, reported on 21.0% of returns)
Here:
$20,272
State:
$23,538
Here:
18.9% of AGI
State:
18.4% of AGI
(% of AGI for various income ranges: 4.9% for AGIs below $25k, 7.1% for AGIs $25k-50k, 9.1% for AGIs $50k-75k, 10.9% for AGIs $75k-100k, 12.5% for AGIs $100k-200k, 10.9% for AGIs over 200k)
Charity contributions: $4,793 (reported on 16.2% of returns)
Here:
$4,793
State:
$4,025
(% of AGI for various income ranges: 0.4% for AGIs below $25k, 0.8% for AGIs $25k-50k, 1.3% for AGIs $50k-75k, 1.8% for AGIs $75k-100k, 2.4% for AGIs $100k-200k, 3.0% for AGIs over 200k)
Taxes paid: $8,288 (reported on 20.9% of returns)
17701:
$8,288
State:
$9,982
(% of AGI for various income ranges: 1.1% for AGIs below $25k, 2.5% for AGIs $25k-50k, 3.0% for AGIs $50k-75k, 4.1% for AGIs $75k-100k, 5.7% for AGIs $100k-200k, 5.7% for AGIs over 200k)
Earned income credit: $2,070 (reported on 21.5% of returns)
Here:
$2,070
State:
$2,106
(% of AGI for various income ranges: 6.4% for AGIs below $25k, 1.0% for AGIs $25k-50k)
Percentage of individuals using paid preparers for their 2012 taxes: 53.0%
Here:
53%
State:
53%
(% for various income ranges: 48.2% for AGIs below $25k, 51.1% for AGIs $25k-50k, 60.2% for AGIs $50k-75k, 58.7% for AGIs $75k-100k, 65.1% for AGIs $100k-200k, 85.3% for AGIs over 200k)
Averages for the 2004 tax year for zip code 17701, filed in 2005:
Average Adjusted Gross Income (AGI) in 2004: $38,956 (Individual Income Tax Returns)
Here:
$38,956
State:
$48,049
Salary/wage: $31,095 (reported on 83.9% of returns)
Here:
$31,095
State:
$42,646
(% of AGI for various income ranges: 99.1% for AGIs below $10k, 75.9% for AGIs $10k-25k, 81.4% for AGIs $25k-50k, 82.3% for AGIs $50k-75k, 77.8% for AGIs $75k-100k, 41.4% for AGIs over 100k)
Taxable interest for individuals: $1,676 (reported on 43.4% of returns)
This zip code:
$1,676
Pennsylvania:
$1,657
(% of AGI for various income ranges: 4.7% for AGIs below $10k, 2.4% for AGIs $10k-25k, 1.7% for AGIs $25k-50k, 1.2% for AGIs $50k-75k, 1.5% for AGIs $75k-100k, 2.0% for AGIs over 100k)
Taxable dividends: $4,851 (reported on 24.5% of returns)
Here:
$4,851
State:
$3,566
(% of AGI for various income ranges: 6.2% for AGIs below $10k, 2.0% for AGIs $10k-25k, 1.5% for AGIs $25k-50k, 1.4% for AGIs $50k-75k, 2.4% for AGIs $75k-100k, 5.2% for AGIs over 100k)
Net capital gain/loss: +$18,037 (reported on 18.1% of returns)
Here:
+$18,037
State:
+$9,716
(% of AGI for various income ranges: -2.0% for AGIs below $10k, 0.4% for AGIs $10k-25k, 0.7% for AGIs $25k-50k, 0.9% for AGIs $50k-75k, 2.3% for AGIs $75k-100k, 22.6% for AGIs over 100k)
Profit/loss from business: +$13,738 (reported on 10.5% of returns)
Here:
+$13,738
State:
+$14,267
(% of AGI for various income ranges: 4.0% for AGIs below $10k, 3.4% for AGIs $10k-25k, 2.3% for AGIs $25k-50k, 2.2% for AGIs $50k-75k, 3.2% for AGIs $75k-100k, 5.6% for AGIs over 100k)
IRA payment deduction: $2,696 (reported on 2.5% of returns)
17701:
$2,696
Pennsylvania:
$2,903
(% of AGI for various income ranges: 0.1% for AGIs below $10k, 0.2% for AGIs $10k-25k, 0.3% for AGIs $25k-50k, 0.2% for AGIs $50k-75k, 0.2% for AGIs $75k-100k, 0.1% for AGIs over 100k)
Self-employed pension: $16,015 (reported on 0.7% of returns)
Here:
$16,015
Pennsylvania:
$14,674
(% of AGI for various income ranges: 0.1% for AGIs $25k-50k, 0.1% for AGIs $50k-75k, 0.1% for AGIs $75k-100k, 0.7% for AGIs over 100k)
Total itemized deductions: $17,147 (18% of AGI, reported on 22.7% of returns)
Here:
$17,147
State:
$18,804
Here:
17.7% of AGI
State:
19.5% of AGI
(% of AGI for various income ranges: 8.5% for AGIs below $10k, 6.1% for AGIs $10k-25k, 9.0% for AGIs $25k-50k, 11.7% for AGIs $50k-75k, 14.3% for AGIs $75k-100k, 10.0% for AGIs over 100k)
Charity contributions deductions: $4,141 (4% of AGI, reported on 19.8% of returns)
Here:
$4,141
State:
$3,337
Here:
4.0% of AGI
State:
3.3% of AGI
(% of AGI for various income ranges: 0.4% for AGIs below $10k, 0.7% for AGIs $10k-25k, 1.2% for AGIs $25k-50k, 1.9% for AGIs $50k-75k, 2.3% for AGIs $75k-100k, 3.4% for AGIs over 100k)
Total tax: $6,736 (reported on 67.0% of returns)
17701:
$6,736
State:
$8,008
(% of AGI for various income ranges: 2.0% for AGIs below $10k, 3.8% for AGIs $10k-25k, 6.7% for AGIs $25k-50k, 8.7% for AGIs $50k-75k, 10.4% for AGIs $75k-100k, 20.0% for AGIs over 100k)
Earned income credit: $1,706 (reported on 20.2% of returns)
Here:
$1,706
State:
$1,643
Percentage of individuals using paid preparers for their 2004 taxes: 56.4%
Here:
56%
State:
56%
(% for various income ranges: 51.1% for AGIs below $10k, 57.1% for AGIs $10k-25k, 55.9% for AGIs $25k-50k, 60.4% for AGIs $50k-75k, 57.6% for AGIs $75k-100k, 71.4% for AGIs over 100k)
Likely homosexual households (counted as self-reported same-sex unmarried-partner households)
Lesbian couples: 0.2% of all households
Gay men: 0.3% of all households
Household received Food Stamps/SNAP in the past 12 months: 3,936 Household did not receive Food Stamps/SNAP in the past 12 months: 14,234
Women who had a birth in the past 12 months: 542 (222 now married, 285 unmarried) Women who did not have a birth in the past 12 months: 9,502 (2,814 now married, 6,720 unmarried)
Housing units in zip code 17701 with a mortgage: 6,189 (670 second mortgage, 14 home equity loan, 587 both second mortgage and home equity loan) Houses without a mortgage: 558
Median monthly owner costs for units with a mortgage: $1,316 Median monthly owner costs for units without a mortgage: $543
Residents with income below the poverty level in 2022:
This zip code:
18.6%
Whole state:
11.8%
Residents with income below 50% of the poverty level in 2022:
This zip code:
8.6%
Whole state:
6.1%
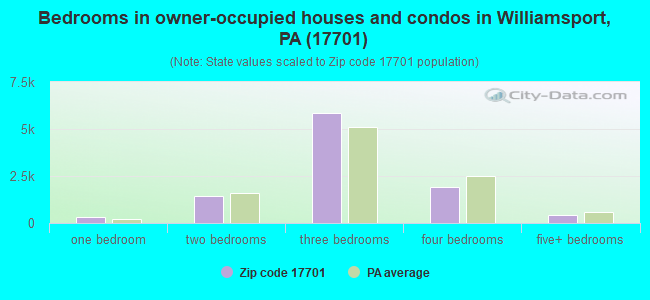
Median number of rooms in houses and condos:
Here:
6.6
State:
6.8
Median number of rooms in apartments:
Here:
4.4
State:
4.3
Notable locations in this zip code not listed on our city pages
Streams, rivers, and creeks: Reibsan Run (A), Plunketts Creek (B), Noon Branch (C), King Run (D), Mock Creek (E), Hessler Branch (F), Wolf Run (G), Grandad Run (H), Wallis Run (I). Display/hide their locations on the map
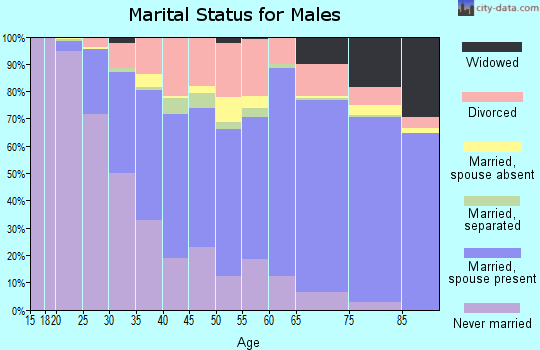
3,770 married couples with children.
3,549 single-parent households (895 men, 2,654 women).
95.1% of residents of 17701 zip code speak English at home.
1.8% of residents speak Spanish at home (86% very well, 8% well, 6% not well).
2.0% of residents speak other Indo-European language at home (69% very well, 27% well, 1% not well, 3% not at all).
0.5% of residents speak Asian or Pacific Island language at home (83% very well, 17% well).
0.2% of residents speak other language at home (100% very well).
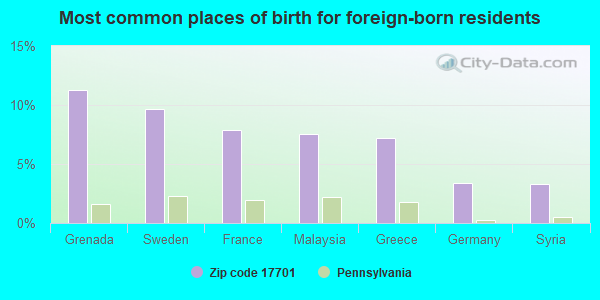
Foreign born population: 1,029 (2.4%) (50.1% of them are naturalized citizens)
Major facilities with environmental interests located in this zip code:
ALCAN CABLE WILLIAMSPORT PLANT (409 REIGHARD AVENUE in WILLIAMSPORT, PA)
AIR MINOR (AIRS/AFS) CRITERIA AND HAZARDOUS AIR POLLUTANT INVENTORY (Inventory of air pollution sources) STATE MASTER (Pennsylvania database) - AFS-41-2098324-1, AIR PROGRAM, RCRIS-PAD003057965, HAZARDOUS WASTE PROGRAM National Pollutant Discharge Elimination System NON-MAJOR (Tracking pollutant discharge elimination systems) - permit (Resource Conservation and Recovery Act (tracking hazardous waste)) TRI REPORTER (Tracking of toxic chemicals releasing facilities) Business SIC classification: DRAWING AND INSULATING OF NONFERROUS WIRE Organizations: OPERNAME (CONTACT/OPERATOR)
, OWNERNAME (CONTACT/OWNER)
, ALCAN ALUMINUM CORP (OWNER/OPERATOR)
Alternative names: WILLIAMSPORT CABLE PLANT
ARATEX SVC (1699 FREDERICK AVE in WILLIAMSPORT, PA)
STATE MASTER (Pennsylvania database) - RCRIS-PAD987266590, HAZARDOUS WASTE PROGRAM (Resource Conservation and Recovery Act (tracking hazardous waste)) Organizations: OPERNAME (CONTACT/OPERATOR)
, ARATEX SERVICES INC (CONTACT/OWNER)
BETHLEHEM STEEL CORP (FOOT OF CAMPBELL STREET in WILLIAMSPORT, PA)
(Integrated Compliance Information System) - ICIS-03-1981-0284, FORMAL ENFORCEMENT ACTION Large Quantity Generators, more that 1000 kg of hazardous waste/month (Resource Conservation and Recovery Act (tracking hazardous waste)) - notification TSD (Resource Conservation and Recovery Act (tracking hazardous waste)) - notification Business SIC classification: STEEL WIREDRAWING AND STEEL NAILS AND SPIKES Business NAICS classification: STEEL WIRE DRAWING.
BAKER DIV WMSPT PLT A806 (340 ARCH STREET in WILLIAMSPORT, PA)
AIR MINOR (AIRS/AFS) STATE MASTER (Pennsylvania database) - AFS-57-0248420-3, AIR PROGRAM Business SIC classification: FABRICATED METAL PRODUCTS Organizations: SONOCO PRODUCTS CO (OWNER/OPERATOR)
Alternative names: SONOCO PROD/BAKER DIV WMSPT PLT A806
ALLEGHENY AUTO ALIGNMENT (2512 E 3RD ST in WILLIAMSPORT, PA)
STATE MASTER (Pennsylvania database) - RCRIS-PAD981733884, HAZARDOUS WASTE PROGRAM Small Quantity Generators, between 100 kg and 1000 kg of hazardous waste/month (Resource Conservation and Recovery Act (tracking hazardous waste)) - notification Organizations: OPERNAME (CONTACT/OPERATOR)
, ALLEGHENY AUTO ALIGNMENT INC (CONTACT/OWNER)
BARR MOTORS (1820 E 3RD ST in WILLIAMSPORT, PA)
STATE MASTER (Pennsylvania database) - RCRIS-PAD987400876, HAZARDOUS WASTE PROGRAM Conditionally Exempt Small Quantity Generators, less than 100 kg/month of hazardous waste (Resource Conservation and Recovery Act (tracking hazardous waste)) - notification TRANSPORTER (Resource Conservation and Recovery Act (tracking hazardous waste)) - notification Business NAICS classification: ALL OTHER MOTOR VEHICLE DEALERS.; PASSENGER CAR RENTAL. Organizations: BARR JAMES (CONTACT/OWNER)
ANCHOR FORD (435 RIVER AVE in WILLIAMSPORT, PA)
STATE MASTER (Pennsylvania database) - RCRIS-PAD987283009, HAZARDOUS WASTE PROGRAM Conditionally Exempt Small Quantity Generators, less than 100 kg/month of hazardous waste (Resource Conservation and Recovery Act (tracking hazardous waste)) Business NAICS classification: ALL OTHER MOTOR VEHICLE DEALERS. Organizations: OPERNAME (CONTACT/OPERATOR)
Alternative names: ANCHOR FORD JEEP EAGLE
ANCHOR NISSAN (633 W THIRD ST in WILLIAMSPORT, PA)
STATE MASTER (Pennsylvania database) - RCRIS-PAD982662843, HAZARDOUS WASTE PROGRAM Conditionally Exempt Small Quantity Generators, less than 100 kg/month of hazardous waste (Resource Conservation and Recovery Act (tracking hazardous waste)) Business NAICS classification: ALL OTHER MOTOR VEHICLE DEALERS.; AUTOMOTIVE BODY, PAINT, AND INTERIOR REPAIR AND MAINTENANCE. Organizations: OPERNAME (CONTACT/OPERATOR)
Alternative names: ANCHOR LINCOLN-MERCURY-NISSAN
BECHT EL SCH ( in WILLIAMSPORT, PA)
(National Center for Education Statistics) - STATE ID-3035 Organizations: LOYALSOCK TOWNSHIP SD (SCHOOL DISTRICT)
321 HIGH STREET (321 HIGH STREET in WILLIAMSPORT, PA)
ENFORCEMENT/COMPLIANCE ACTIVITY (Integrated Compliance Information System) COMPLIANCE ACTIVITY (Tracking inspections of insecticide, fungicide, and rodenticide, and toxic substances) Alternative names: CRYSTAL CARLTON APT#2, 321 HIGH STREET 3RD FLR., CRYSTAL CARLSON, CRYSTAL CARLTON APT#2, ELIZABETH GOOLSBY, TENANT, MILLISA SNYDER, TENANT
BAILEY CONTROLS CO (2300 REACH ROAD in WILLIAMSPORT, PA)
AIR MINOR (AIRS/AFS) Small Quantity Generators, between 100 kg and 1000 kg of hazardous waste/month (Resource Conservation and Recovery Act (tracking hazardous waste)) - notification TRI REPORTER (Tracking of toxic chemicals releasing facilities) Business SIC classification: RELAYS AND INDUSTRIAL CONTROLS; INDUSTRIAL INSTRUMENTS FOR MEASUREMENT, DISPLAY, AND CONTROL OF PROCESS VARIABLES; AND RELATED PRODUCTS Organizations: PRIMUS TCHNOLOGIES CORP (CONTACT/OWNER)
Alternative names: ELSAG BAILEY ELECTRONICS
BAILLIE LUMBER CO INC (3301 LYCOMING CREEK RD in WILLIAMSPORT, PA)
National Pollutant Discharge Elimination System NON-MAJOR (Tracking pollutant discharge elimination systems) - permit Business SIC classification: SAWMILLS AND PLANING MILLS, GENERAL
BASTIAN TIRE SALES (430 WASHINGTON BOULEVARD in WILLIAMSPORT, PA)
AIR MINOR (AIRS/AFS) Business SIC classification: TIRES AND TUBES
Housing units lacking complete plumbing facilities: 2.1% Housing units lacking complete kitchen facilities: 3.5%
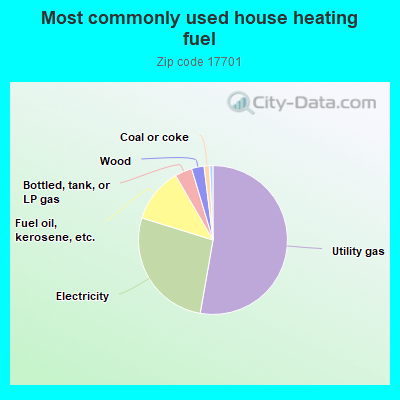
52.5%Utility gas
26.9%Electricity
11.8%Fuel oil, kerosene, etc.
3.7%Bottled, tank, or LP gas
2.7%Wood
1.2%Coal or coke
0.7%No fuel used
Population in 1990: 58,844.
Place of birth for U.S.-born residents:
This state: 34,101
Northeast: 3,626
Midwest: 896
South: 2,487
West: 546
54% of the 17701 zip code residents lived in the same house 5 years ago. Out of people who lived in different houses, 64% lived in this county. Out of people who lived in different counties, 50% lived in Pennsylvania.
87% of the 17701 zip code residents lived in the same house 1 year ago. Out of people who lived in different houses, 64% moved from this county. Out of people who lived in different houses, 21% moved from different county within same state. Out of people who lived in different houses, 11% moved from different state. Out of people who lived in different houses, 2% moved from abroad.
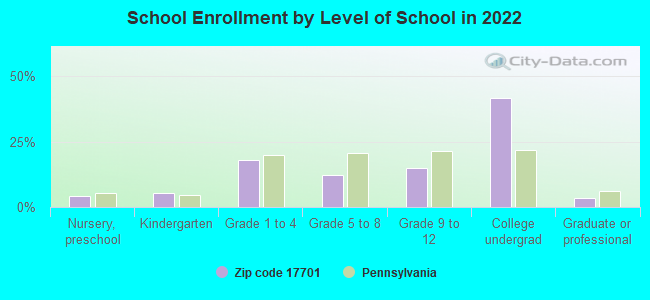
Private vs. public school enrollment:
Students in private schools in grades 1 to 8 (elementary and middle school): 306
Here:
8.9%
Pennsylvania:
15.7%
Students in private schools in grades 9 to 12 (high school): 212
Here:
12.4%
Pennsylvania:
13.4%
Students in private undergraduate colleges: 1,352
Here:
28.9%
Pennsylvania:
39.8%
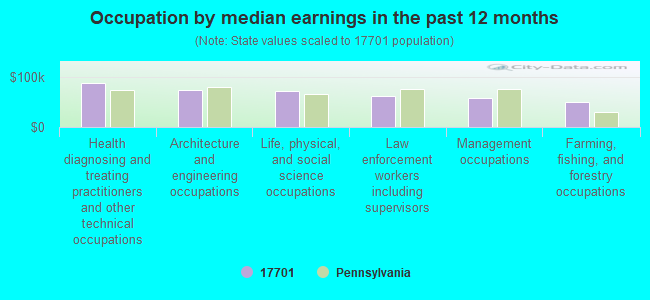
Occupation by median earnings in the past 12 months ($)
87,418Health diagnosing and treating practitioners and other technical occupations
73,657Architecture and engineering occupations
70,897Life, physical, and social science occupations
62,361Law enforcement workers including supervisors
57,358Management occupations
49,544Farming, fishing, and forestry occupations
Companies with biggest federal contracts located in this zip code (WILLIAMSPORT, PA):
L-3 COMMUNICATIONS CORPORATION (1035 WESTMINSTER DR) : $107,456,428 in 320 contractsfrom 1999 to 2006
Contracts for Electron Tubes and Associated Hardware, Maintenance, Repair and Rebuilding of Equipment -- Electrical and Electronic Equipment Components, Maintenance, Repair and Rebuilding of Equipment -- Miscellaneous, Miscellaneous Communication Equipment, and moreby Navy, Air Force, Army, Defense Logistics Agency, and others Signed by year:2000: $14,685,130; 2001: $13,481,116; 2002: $18,679,484; 2003: $22,210,841; 2004: $17,724,885; 2005: $9,683,450; 2006: $7,481,536.
Biggest contracts:
$3,972,456 with Navy for Electron Tubes and Associated Hardware. Signed on 2003-03-04. Completion date: 2004-11-04.
$3,829,022 with Air Force for Electron Tubes and Associated Hardware. Signed on 2005-11-16. Completion date: 2008-12-31.
$3,684,268 with Navy for Electron Tubes and Associated Hardware. Taking place in CA. Signed on 2006-02-28. Completion date: 2008-06-30.
$3,285,504 with Navy for Electron Tubes and Associated Hardware. Signed on 2002-09-10. Completion date: 2004-05-15.
FLOWSERVE CORPORATION (701 1ST ST; small business) : $4,519,852 in 31 contractsfrom 1999 to 2006
Contracts for Valves, Nonpowered, Valves, Powered, Diesel Engines and Components, Maintenance, Repair and Rebuilding of Equipment -- Pumps and Compressors, and moreby Navy, Tennessee Valley Authority Signed by year:2000: $1,042,844; 2001: $296,317; 2002: $177,286; 2003: $2,236,225; 2004: $129,717; 2005: $376,172; 2006: $67,320.
Biggest contracts:
$2,181,325 with Navy for Valves, Nonpowered. Taking place in NC. Signed on 2003-11-19. Completion date: 2004-11-19.
$300,000 with Tennessee Valley Authority for Valves, Nonpowered. Taking place in TN. Signed on 2000-06-15. Completion date: 2001-10-15.
$284,600 with Navy for Valves, Nonpowered. Signed on 2000-04-05. Completion date: 2001-04-10.
$224,680, same as above.Signed on 2005-03-08. Completion date: 2006-02-02.
BRODART CO (500 ARCH ST) : $4,434,473 in 276 contractsfrom 1999 to 2006
Contracts for Books and Pamphlets, Other ADP and Telecommunications Services (includes data storage on tapes, compact disks, etc.), Library Services, Newspapers and Periodicals, and moreby Army, Air Force, Department of State, Navy, and others Signed by year:2000: $357,270; 2001: $931,671; 2002: $741,135; 2003: $339,560; 2004: $750,065; 2005: $1,001,194; 2006: $162,509.
Biggest contracts:
$376,200 with Army for Books and Pamphlets. Signed on 2001-09-07. Completion date: 2002-02-28.
$374,976, same as above.Signed on 2002-03-12. Completion date: 2003-02-28.
$371,070, same as above.Signed on 2001-04-23. Completion date: 2002-02-28.
$324,756, same as above.Signed on 2000-04-06. Completion date: 2001-04-06.
DISCOVERY MACHINE, INC (SUITE 3C; small business) : $4,396,107 in 22 contractsfrom 2000 to 2006
Contracts for Other Defense -- Applied Research and Exploratory Development (R&D), Services -- Applied Research and Exploratory Development (R&D), Mathematical and Computer Sciences -- Basic Research (R&D), Space Operations (Tracking and Data Acquisition) -- Basic Research (R&D) by Army, Navy, NASA Signed by year:2000: $110,000; 2001: $558,125; 2002: $720,986; 2003: $1,024,996; 2004: $1,323,026; 2005: $473,974; 2006: $185,000.
Biggest contracts:
$621,250 with Army for Other Defense -- Applied Research and Exploratory Development (R&D). Signed on 2001-02-05. Completion date: 2002-09-23.
$375,000, same as above.Signed on 2005-04-20. Completion date: 2006-06-24.
$375,000, same as above.Signed on 2004-03-11. Completion date: 2006-06-24.
$375,000, same as above.Signed on 2004-06-23. Completion date: 2006-01-10.
LYCOMING SUPPLY INC (801 BEEBER STREET; small business) : $1,997,602 in 10 contractsfrom 2000 to 2004
Contracts for Maintenance, Repair or Alteration of Real Property -- Other Residential Buildings, Maintenance, Repair or Alteration of Real Property -- Highways, Roads, Streets, Bridges, and Railways (includes resurfacing) by Army Signed by year:2000: $188,651; 2001: $646,214; 2002: $536,189; 2003: $525,524; 2004: $101,024; 2005: $0; 2006: $0.
Biggest contracts:
$523,899 with Army for Maintenance, Repair or Alteration of Real Property -- Other Residential Buildings. Signed on 2003-08-06. Completion date: 2004-07-31.
$335,155, same as above.Signed on 2001-09-28. Completion date: 2004-09-27.
$293,460, same as above.Signed on 2001-09-29. Completion date: 2004-09-28.
$259,777, same as above.Signed on 2002-09-27. Completion date: 2003-07-31.
HOPE ENTERPRISES INC (136 CATAWISSA AVE) : $823,887 in 18 contractsfrom 2000 to 2006
Contracts for Custodial Janitorial Services, Snow Removal/Salt Service (also spreading aggregate or other snow melting material), , Maintenance, Repair or Alteration of Real Property -- Office Buildings by Public Buildings Service, Army Signed by year:2000: $125,000; 2001: $135,000; 2002: $147,000; 2003: $22,622; 2004: $186,502; 2005: $192,557; 2006: $15,206.
Biggest contracts:
$168,313 with Public Buildings Service for Custodial Janitorial Services. Signed on 2005-01-18. Effective on 2005-02-07. Completion date: 2006-02-06.
$158,307, same as above.Signed on 2004-01-22. Effective on 2004-02-07. Completion date: 2005-02-06.
$147,000, same as above.Signed on 2002-01-15. Completion date: 2003-02-15.
$135,000, same as above.Signed on 2001-02-15. Completion date: 2002-02-15.
PRIMUS TECHNOLOGIES CORP (2333 REACH RD; small business) : $475,212 in 19 contractsfrom 1999 to 2006
Contracts for Defense Electronics and Communication Equipment -- Applied Research and Exploratory Development (R&D), Electronic Modules, Electrical and Electronic assemblies, Boards, Cards, and Associated Hardware, Microcircuits, Electronic by Navy, Army Signed by year:2000: $0; 2001: $0; 2002: $187,920; 2003: $0; 2004: $7,235; 2005: $142,643; 2006: $68,865.
Biggest contracts:
$168,120 with Navy for Defense Electronics and Communication Equipment -- Applied Research and Exploratory Development (R&D). Signed on 2002-11-25. Completion date: 2003-05-30.
$88,529 with Navy for Electronic Modules. Signed on 2005-06-10. Completion date: 2005-06-10.
$68,549, same as above.Signed on 1999-10-20. Completion date: 2000-03-22.
$64,520, same as above.Signed on 2006-03-01. Completion date: 2006-03-01.
REGSCAN INC (800 W 4TH ST; small business) : $308,386 in 12 contractsfrom 2002 to 2006
Contracts for Data Analyses (other than scientific), Newspapers and Periodicals, Cost Benefit AnalyseS, , and moreby Army, NASA, Department of Veterans Affairs, Navy, and others Signed by year:2000: $0; 2001: $0; 2002: $2,960; 2003: $92,900; 2004: $118,960; 2005: $93,259; 2006: $307.
Biggest contracts:
$90,000 with Army for Data Analyses (other than scientific). Signed on 2005-06-22. Effective on 2005-06-24. Completion date: 2009-06-23.
$90,000 with Army for Newspapers and Periodicals. Signed on 2003-04-02. Completion date: 2003-03-28.
$45,000, same as above.Signed on 2004-11-10. Effective on 2004-11-09. Completion date: 2005-05-31.
$45,000, same as above.Signed on 2004-05-19. Completion date: 2004-11-30.
LYCOMING COLLEGE (700 COLLEGE PL) : $271,500 in 3 contractsfrom 2003 to 2005
$110,000 with Army for Educational Services. Signed on 2005-08-08. Completion date: 2005-08-08.
$85,000, same as above.Signed on 2003-05-30. Completion date: 2003-05-30.
$76,500, same as above.Signed on 2004-04-01. Completion date: 2004-04-01.
QORTEK INC (1965 LYCOMING CREEK RD; small business)
$98,778 with Army for Other Defense -- Applied Research and Exploratory Development (R&D). Signed on 2005-11-07. Completion date: 2006-07-15.
Top industries in this zip code by the number of employees in 2005:
Health Care and Social Assistance: General Medical and Surgical Hospitals (over 1000 employees: 1 establishment, 250-499 employees: 1 establishment)
Educational Services: Colleges, Universities, and Professional Schools (500-999: 1)
Health Care and Social Assistance: Offices of Physicians (except Mental Health Specialists) (250-499: 1, 20-49: 5, 10-19: 4, 5-9: 14, 1-4: 19)
Administrative and Support and Waste Management and Remediation Services: Temporary Help Services (250-499: 1, 100-249: 1, 50-99: 1, 20-49: 1, 10-19: 1, 1-4: 2)
People in group quarters in 2010:
2,211 people in college/university student housing
482 people in nursing facilities/skilled-nursing facilities
208 people in local jails and other municipal confinement facilities
107 people in other noninstitutional facilities
88 people in group homes intended for adults
54 people in emergency and transitional shelters (with sleeping facilities) for people experiencing homelessness
33 people in correctional residential facilities
20 people in mental (psychiatric) hospitals and psychiatric units in other hospitals
20 people in residential treatment centers for adults
16 people in workers' group living quarters and job corps centers
4 people in in-patient hospice facilities
People in group quarters in 2000:
1,734 people in college dormitories (includes college quarters off campus)
531 people in nursing homes
311 people in local jails and other confinement facilities (including police lockups)
222 people in other noninstitutional group quarters
108 people in homes for the mentally retarded
35 people in other group homes
26 people in halfway houses
22 people in mental (psychiatric) hospitals or wards
16 people in religious group quarters
12 people in homes for the mentally ill
8 people in training schools for juvenile delinquents
5 people in residential treatment centers for emotionally disturbed children
Fatal accident statistics in 2012:
Fatal accident count: 1
Vehicles involved in fatal accidents: 1
Fatal accidents caused by drunken drivers: 0
Fatalities: 1
Persons involved in fatal accidents: 1
Pedestrians involved in fatal accidents: 0
Fatal accident statistics in 2011:
Fatal accident count: 1
Vehicles involved in fatal accidents: 2
Fatal accidents caused by drunken drivers: 0
Fatalities: 1
Persons involved in fatal accidents: 5
Pedestrians involved in fatal accidents: 0
Home Mortgage Disclosure Act Aggregated Statistics For Year 2009 (Based on 6 full and 14 partial tracts)
A) FHA, FSA/RHS & VA Home Purchase Loans
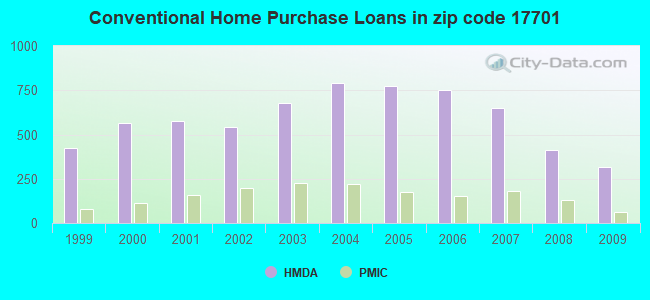
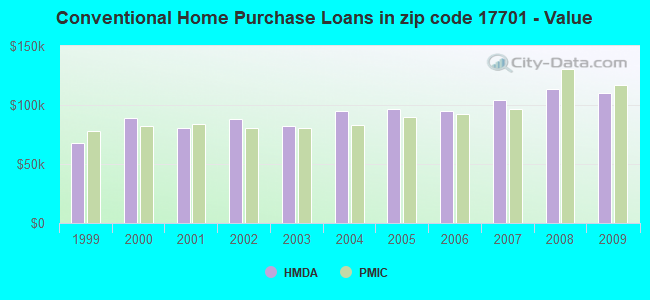
B) Conventional Home Purchase Loans
C) Refinancings
D) Home Improvement Loans
E) Loans on Dwellings For 5+ Families
F) Non-occupant Loans on < 5 Family Dwellings (A B C & D)
G) Loans On Manufactured Home Dwelling (A B C & D)
Number
Average Value
Number
Average Value
Number
Average Value
Number
Average Value
Number
Average Value
Number
Average Value
Number
Average Value
LOANS ORIGINATED
132
$107,554
315
$110,192
676
$124,323
180
$49,230
16
$533,774
117
$107,772
9
$36,147
APPLICATIONS APPROVED, NOT ACCEPTED
9
$85,572
18
$117,724
57
$111,329
20
$50,294
1
$2,267,520
5
$109,710
1
$9,660
APPLICATIONS DENIED
12
$93,118
46
$96,419
303
$113,915
80
$29,508
6
$586,360
21
$89,076
7
$55,827
APPLICATIONS WITHDRAWN
10
$110,910
27
$160,293
217
$126,560
13
$97,349
0
$0
11
$173,636
3
$113,223
FILES CLOSED FOR INCOMPLETENESS
2
$75,040
1
$147,500
34
$113,493
1
$160,320
0
$0
2
$65,780
0
$0
Aggregated Statistics For Year 2008 (Based on 6 full and 14 partial tracts)
A) FHA, FSA/RHS & VA Home Purchase Loans
B) Conventional Home Purchase Loans
C) Refinancings
D) Home Improvement Loans
E) Loans on Dwellings For 5+ Families
F) Non-occupant Loans on < 5 Family Dwellings (A B C & D)
G) Loans On Manufactured Home Dwelling (A B C & D)
Number
Average Value
Number
Average Value
Number
Average Value
Number
Average Value
Number
Average Value
Number
Average Value
Number
Average Value
LOANS ORIGINATED
98
$114,343
411
$113,899
473
$108,287
217
$38,348
24
$757,255
166
$82,818
8
$58,180
APPLICATIONS APPROVED, NOT ACCEPTED
10
$111,890
45
$95,628
85
$95,479
36
$30,356
5
$98,098
16
$88,248
5
$30,784
APPLICATIONS DENIED
5
$87,300
70
$116,764
439
$106,671
139
$32,802
3
$530,333
30
$75,178
6
$39,840
APPLICATIONS WITHDRAWN
8
$117,894
44
$112,888
170
$120,033
13
$77,556
4
$1,332,558
28
$89,573
1
$74,190
FILES CLOSED FOR INCOMPLETENESS
0
$0
5
$140,488
33
$140,938
5
$26,440
3
$4,177,367
3
$69,683
0
$0
Aggregated Statistics For Year 2007 (Based on 6 full and 14 partial tracts)
A) FHA, FSA/RHS & VA Home Purchase Loans
B) Conventional Home Purchase Loans
C) Refinancings
D) Home Improvement Loans
E) Loans on Dwellings For 5+ Families
F) Non-occupant Loans on < 5 Family Dwellings (A B C & D)
G) Loans On Manufactured Home Dwelling (A B C & D)
Number
Average Value
Number
Average Value
Number
Average Value
Number
Average Value
Number
Average Value
Number
Average Value
Number
Average Value
LOANS ORIGINATED
60
$101,508
650
$104,224
611
$86,081
311
$33,194
19
$379,588
175
$85,200
11
$43,633
APPLICATIONS APPROVED, NOT ACCEPTED
4
$124,430
50
$102,369
117
$94,675
50
$54,673
1
$275,000
9
$71,872
6
$44,505
APPLICATIONS DENIED
3
$86,847
121
$80,594
601
$85,052
171
$41,429
1
$20,000
45
$56,482
12
$50,511
APPLICATIONS WITHDRAWN
3
$123,337
59
$101,582
231
$96,700
26
$74,008
0
$0
19
$110,877
1
$131,100
FILES CLOSED FOR INCOMPLETENESS
1
$89,000
27
$84,801
77
$98,907
4
$81,472
0
$0
7
$110,779
0
$0
Aggregated Statistics For Year 2006 (Based on 6 full and 14 partial tracts)
A) FHA, FSA/RHS & VA Home Purchase Loans
B) Conventional Home Purchase Loans
C) Refinancings
D) Home Improvement Loans
E) Loans on Dwellings For 5+ Families
F) Non-occupant Loans on < 5 Family Dwellings (A B C & D)
G) Loans On Manufactured Home Dwelling (A B C & D)
Number
Average Value
Number
Average Value
Number
Average Value
Number
Average Value
Number
Average Value
Number
Average Value
Number
Average Value
LOANS ORIGINATED
51
$97,387
752
$94,712
715
$82,211
319
$36,483
25
$233,348
212
$82,168
16
$41,652
APPLICATIONS APPROVED, NOT ACCEPTED
4
$92,528
67
$95,926
148
$70,584
41
$31,882
1
$640,000
13
$39,561
6
$61,028
APPLICATIONS DENIED
7
$77,300
158
$78,191
754
$79,367
205
$30,598
3
$35,313
67
$56,547
14
$43,935
APPLICATIONS WITHDRAWN
2
$58,000
96
$87,924
366
$87,695
33
$48,782
2
$2,822,000
22
$63,562
3
$89,090
FILES CLOSED FOR INCOMPLETENESS
0
$0
16
$125,328
90
$102,228
10
$62,895
0
$0
8
$71,961
2
$65,220
Aggregated Statistics For Year 2005 (Based on 6 full and 14 partial tracts)
A) FHA, FSA/RHS & VA Home Purchase Loans
B) Conventional Home Purchase Loans
C) Refinancings
D) Home Improvement Loans
E) Loans on Dwellings For 5+ Families
F) Non-occupant Loans on < 5 Family Dwellings (A B C & D)
G) Loans On Manufactured Home Dwelling (A B C & D)
Number
Average Value
Number
Average Value
Number
Average Value
Number
Average Value
Number
Average Value
Number
Average Value
Number
Average Value
LOANS ORIGINATED
39
$98,730
773
$96,349
817
$79,646
228
$35,907
22
$194,270
236
$77,716
16
$38,989
APPLICATIONS APPROVED, NOT ACCEPTED
5
$78,458
52
$77,123
183
$74,818
50
$44,035
0
$0
23
$59,663
15
$39,365
APPLICATIONS DENIED
5
$51,800
167
$85,708
896
$80,067
193
$35,122
3
$114,580
47
$62,587
33
$39,434
APPLICATIONS WITHDRAWN
4
$92,350
78
$94,320
512
$91,116
53
$77,807
2
$130,000
24
$89,048
5
$111,798
FILES CLOSED FOR INCOMPLETENESS
1
$92,000
11
$113,105
75
$107,856
4
$49,538
0
$0
5
$78,614
0
$0
Aggregated Statistics For Year 2004 (Based on 6 full and 14 partial tracts)
A) FHA, FSA/RHS & VA Home Purchase Loans
B) Conventional Home Purchase Loans
C) Refinancings
D) Home Improvement Loans
E) Loans on Dwellings For 5+ Families
F) Non-occupant Loans on < 5 Family Dwellings (A B C & D)
G) Loans On Manufactured Home Dwelling (A B C & D)
Number
Average Value
Number
Average Value
Number
Average Value
Number
Average Value
Number
Average Value
Number
Average Value
Number
Average Value
LOANS ORIGINATED
39
$97,540
791
$94,548
986
$81,030
279
$34,121
20
$239,879
252
$72,864
14
$41,415
APPLICATIONS APPROVED, NOT ACCEPTED
6
$80,903
55
$88,865
211
$77,981
58
$36,601
2
$55,610
18
$44,384
6
$19,420
APPLICATIONS DENIED
3
$66,317
125
$71,896
864
$76,870
202
$25,551
1
$144,000
72
$58,394
23
$46,320
APPLICATIONS WITHDRAWN
3
$60,427
59
$73,594
444
$89,224
32
$52,955
3
$74,577
20
$66,655
2
$68,080
FILES CLOSED FOR INCOMPLETENESS
0
$0
17
$84,394
73
$94,499
8
$45,732
0
$0
7
$85,546
2
$63,450
Aggregated Statistics For Year 2003 (Based on 6 full and 14 partial tracts)
A) FHA, FSA/RHS & VA Home Purchase Loans
B) Conventional Home Purchase Loans
C) Refinancings
D) Home Improvement Loans
E) Loans on Dwellings For 5+ Families
F) Non-occupant Loans on < 5 Family Dwellings (A B C & D)
Number
Average Value
Number
Average Value
Number
Average Value
Number
Average Value
Number
Average Value
Number
Average Value
LOANS ORIGINATED
52
$79,332
679
$82,517
1,642
$92,989
214
$27,374
16
$436,473
223
$70,208
APPLICATIONS APPROVED, NOT ACCEPTED
5
$70,354
54
$75,848
273
$73,917
33
$23,358
1
$120,000
15
$89,718
APPLICATIONS DENIED
11
$75,365
104
$67,934
709
$82,385
122
$21,809
0
$0
44
$56,484
APPLICATIONS WITHDRAWN
2
$117,990
55
$81,913
390
$85,645
14
$43,336
0
$0
21
$48,670
FILES CLOSED FOR INCOMPLETENESS
1
$180,000
13
$71,522
79
$95,359
10
$28,586
0
$0
5
$73,828
Aggregated Statistics For Year 2002 (Based on 6 full and 14 partial tracts)
A) FHA, FSA/RHS & VA Home Purchase Loans
B) Conventional Home Purchase Loans
C) Refinancings
D) Home Improvement Loans
E) Loans on Dwellings For 5+ Families
F) Non-occupant Loans on < 5 Family Dwellings (A B C & D)
Number
Average Value
Number
Average Value
Number
Average Value
Number
Average Value
Number
Average Value
Number
Average Value
LOANS ORIGINATED
69
$76,272
541
$88,088
1,080
$87,490
271
$24,777
22
$590,910
181
$65,146
APPLICATIONS APPROVED, NOT ACCEPTED
5
$61,934
47
$83,306
192
$72,836
62
$19,327
0
$0
18
$72,421
APPLICATIONS DENIED
9
$63,767
97
$58,474
557
$73,580
124
$15,814
2
$125,000
32
$80,211
APPLICATIONS WITHDRAWN
4
$20,894,660
42
$76,846
269
$72,358
20
$29,081
0
$0
8
$49,386
FILES CLOSED FOR INCOMPLETENESS
0
$0
9
$63,633
51
$93,394
2
$13,330
0
$0
4
$87,488
Aggregated Statistics For Year 2001 (Based on 6 full and 14 partial tracts)
A) FHA, FSA/RHS & VA Home Purchase Loans
B) Conventional Home Purchase Loans
C) Refinancings
D) Home Improvement Loans
E) Loans on Dwellings For 5+ Families
F) Non-occupant Loans on < 5 Family Dwellings (A B C & D)
Number
Average Value
Number
Average Value
Number
Average Value
Number
Average Value
Number
Average Value
Number
Average Value
LOANS ORIGINATED
84
$72,330
578
$80,437
966
$79,666
265
$19,924
15
$327,701
205
$57,217
APPLICATIONS APPROVED, NOT ACCEPTED
1
$82,040
82
$51,575
164
$75,783
39
$31,027
0
$0
23
$57,141
APPLICATIONS DENIED
12
$72,963
160
$49,375
544
$59,337
89
$18,190
1
$96,010
38
$72,521
APPLICATIONS WITHDRAWN
1
$95,000
31
$73,883
216
$67,533
33
$25,632
3
$110,843
7
$81,679
FILES CLOSED FOR INCOMPLETENESS
0
$0
3
$66,667
34
$71,368
1
$7,290
0
$0
0
$0
Aggregated Statistics For Year 2000 (Based on 6 full and 14 partial tracts)
A) FHA, FSA/RHS & VA Home Purchase Loans
B) Conventional Home Purchase Loans
C) Refinancings
D) Home Improvement Loans
E) Loans on Dwellings For 5+ Families
F) Non-occupant Loans on < 5 Family Dwellings (A B C & D)
Number
Average Value
Number
Average Value
Number
Average Value
Number
Average Value
Number
Average Value
Number
Average Value
LOANS ORIGINATED
78
$75,060
567
$88,741
442
$57,779
401
$17,376
16
$99,590
174
$61,981
APPLICATIONS APPROVED, NOT ACCEPTED
5
$52,620
53
$56,922
142
$49,636
58
$19,885
0
$0
6
$42,253
APPLICATIONS DENIED
4
$73,000
244
$46,566
429
$53,861
165
$25,170
3
$195,907
47
$62,529
APPLICATIONS WITHDRAWN
1
$75,000
44
$70,699
239
$58,040
33
$21,886
0
$0
25
$66,306
FILES CLOSED FOR INCOMPLETENESS
0
$0
9
$56,272
54
$56,509
1
$51,000
0
$0
3
$47,360
Aggregated Statistics For Year 1999 (Based on 6 full and 8 partial tracts)
A) FHA, FSA/RHS & VA Home Purchase Loans
B) Conventional Home Purchase Loans
C) Refinancings
D) Home Improvement Loans
E) Loans on Dwellings For 5+ Families
F) Non-occupant Loans on < 5 Family Dwellings (A B C & D)
2005 - 2018 National Fire Incident Reporting System (NFIRS) incidents
Based on the data from the years 2005 - 2018 the average number of fire incidents per year is 134. The highest number of fires - 204 took place in 2007, and the least - 61 in 2018. The data has a decreasing trend.
When looking into fire subcategories, the most reports belonged to: Structure Fires (49.6%), and Outside Fires (25.1%).
Fire incident types reported to NFIRS in Zip Code 17701

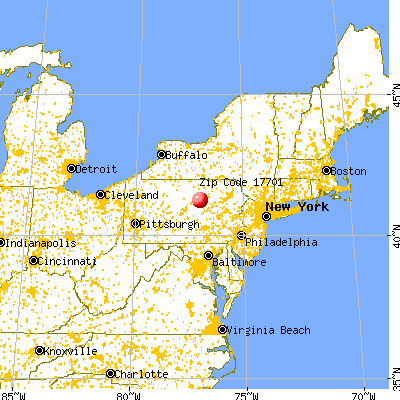


 Nearest zip codes: 17754, 17762, 17737, 17752, 17756, 18619.


 Based on the data from the years 2005 - 2018 the average number of fire incidents per year is 134. The highest number of fires - 204 took place in 2007, and the least - 61 in 2018. The data has a decreasing trend.
 When looking into fire subcategories, the most reports belonged to: Structure Fires (49.6%), and Outside Fires (25.1%).