Estimated zip code population in 2022: 12,398 Zip code population in 2010: 12,408 Zip code population in 2000: 11,955
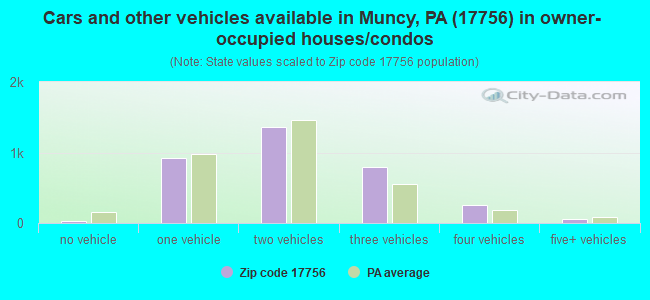
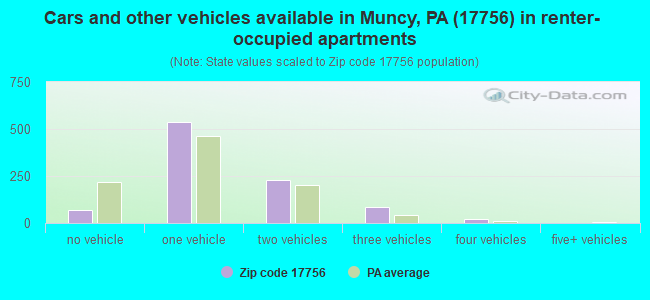
Houses and condos: 4,602 Renter-occupied apartments: 937
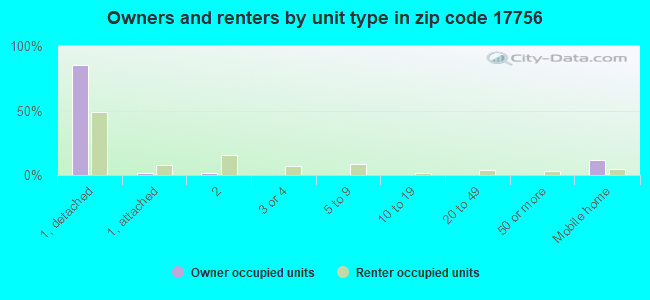
% of renters here:
21%
State:
31%
March 2022 cost of living index in zip code 17756: 92.2 (less than average, U.S. average is 100)
Land area: 112.4 sq. mi. Water area: 1.6 sq. mi.
Population density: 110 people per square mile
(very low).
OSM Map
General Map
Google Map
MSN Map
OSM Map
General Map
Google Map
MSN Map
OSM Map
General Map
Google Map
MSN Map
OSM Map
General Map
Google Map
MSN Map
Please wait while loading the map...
Real estate property taxes paid for housing units in 2022:
This zip code:
1.2% ($2,590)
Pennsylvania:
1.3% ($3,094)
Median real estate property taxes paid for housing units with mortgages in 2022: $2,818 (1.2%) Median real estate property taxes paid for housing units with no mortgage in 2022: $2,032 (1.0%)
Business Search- 14 Million verified businesses
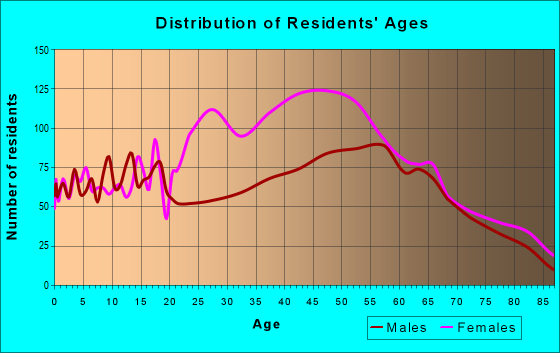
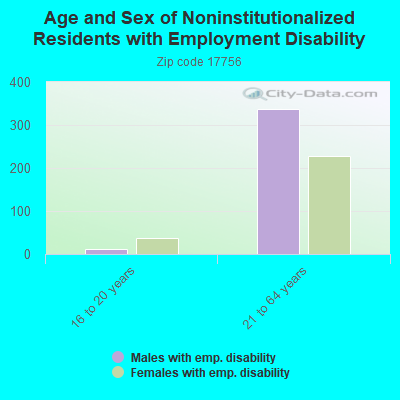
Males: 5,727
(46.2%)
Females: 6,671
(53.8%)
For population 25 years and over in 17756:
High school or higher: 89.2%
Bachelor's degree or higher: 23.1%
Graduate or professional degree: 7.3%
Unemployed: 3.8%
Mean travel time to work (commute): 23.5 minutes
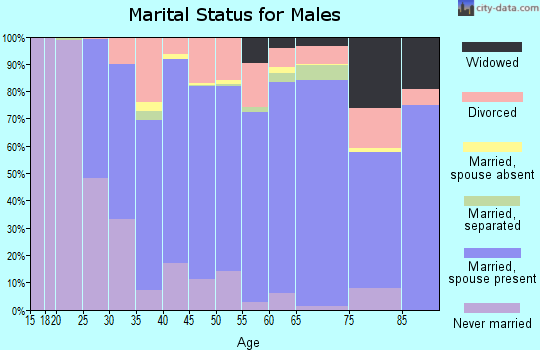
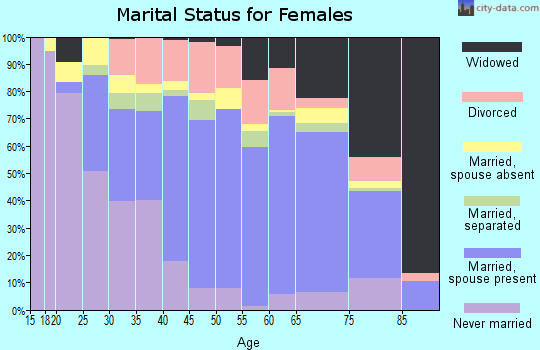
For population 15 years and over in 17756:
Never married: 30.0%
Now married: 52.0%
Separated: 2.6%
Widowed: 6.0%
Divorced: 9.4%
Zip code 17756 compared to state average:
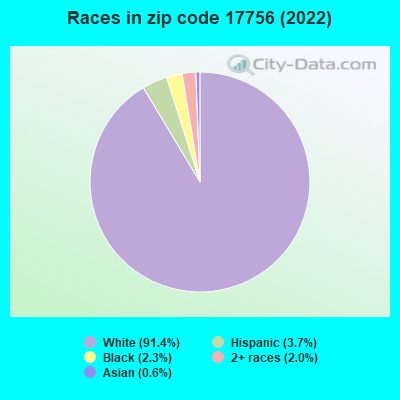
Black race population percentage significantly below state average.
Hispanic race population percentage below state average.
Foreign-born population percentage below state average.
Averages for the 2020 tax year for zip code 17756, filed in 2021:
Average Adjusted Gross Income (AGI) in 2020: $61,686 (Individual Income Tax Returns)
Here:
$61,686
State:
$75,707
Salary/wage: $50,522 (reported on 79.6% of returns)
Here:
$50,522
State:
$62,806
(% of AGI for various income ranges: 1130.5% for AGIs below $25k, 3418.6% for AGIs $25k-50k, 6142.6% for AGIs $50k-75k, 8808.8% for AGIs $75k-100k, 15706.7% for AGIs $100k-200k, 56252.5% for AGIs over 200k)
Taxable interest for individuals: $1,167 (reported on 33.3% of returns)
This zip code:
$1,167
Pennsylvania:
$1,633
(% of AGI for various income ranges: 28.6% for AGIs below $25k, 34.2% for AGIs $25k-50k, 45.7% for AGIs $50k-75k, 40.2% for AGIs $75k-100k, 97.9% for AGIs $100k-200k, 1352.5% for AGIs over 200k)
Ordinary dividends: $4,421 (reported on 20.8% of returns)
Here:
$4,421
State:
$7,382
(% of AGI for various income ranges: 38.4% for AGIs below $25k, 45.6% for AGIs $25k-50k, 87.5% for AGIs $50k-75k, 114.7% for AGIs $75k-100k, 250.0% for AGIs $100k-200k, 4862.5% for AGIs over 200k)
Net capital gain/loss in AGI: +$10,970 (reported on 14.7% of returns)
Here:
+$10,970
State:
+$23,522
(% of AGI for various income ranges: 15.4% for AGIs below $25k, 25.6% for AGIs $25k-50k, 108.2% for AGIs $50k-75k, 83.7% for AGIs $75k-100k, 633.8% for AGIs $100k-200k, 11107.5% for AGIs over 200k)
Profit/loss from business: +$13,475 (reported on 10.9% of returns)
Here:
+$13,475
State:
+$16,274
(% of AGI for various income ranges: 65.8% for AGIs below $25k, 107.5% for AGIs $25k-50k, 155.4% for AGIs $50k-75k, 198.6% for AGIs $75k-100k, 521.2% for AGIs $100k-200k, 4910.0% for AGIs over 200k)
Taxable individual retirement arrangement distribution: $13,955 (reported on 13.8% of returns)
17756:
$13,955
Pennsylvania:
$18,583
(% of AGI for various income ranges: 120.4% for AGIs below $25k, 178.8% for AGIs $25k-50k, 209.7% for AGIs $50k-75k, 395.8% for AGIs $75k-100k, 919.2% for AGIs $100k-200k)
Total itemized deductions: $31,462 (reported on 3.8% of returns)
Here:
$31,462
State:
$34,850
(% of AGI for various income ranges: 72.3% for AGIs $25k-50k, 158.8% for AGIs $50k-75k, 202.1% for AGIs $75k-100k, 365.4% for AGIs $100k-200k, 5465.0% for AGIs over 200k)
Charity contributions: $10,957 (reported on 2.5% of returns)
Here:
$10,957
State:
$12,392
(% of AGI for various income ranges: 6.6% for AGIs below $25k, 24.6% for AGIs $50k-75k, 38.6% for AGIs $75k-100k, 76.2% for AGIs $100k-200k, 1917.5% for AGIs over 200k)
Taxes paid: $7,038 (reported on 3.8% of returns)
17756:
$7,038
State:
$8,200
(% of AGI for various income ranges: 12.6% for AGIs $25k-50k, 30.3% for AGIs $50k-75k, 49.3% for AGIs $75k-100k, 112.7% for AGIs $100k-200k, 985.0% for AGIs over 200k)
Earned income credit: $2,017 (reported on 11.6% of returns)
Here:
$2,017
State:
$2,100
(% of AGI for various income ranges: 61.8% for AGIs below $25k, 57.2% for AGIs $25k-50k)
Percentage of individuals using paid preparers for their 2020 taxes: 92.8%
Here:
93%
State:
92%
(% for various income ranges: 88.2% for AGIs below $25k, 94.9% for AGIs $25k-50k, 94.3% for AGIs $50k-75k, 96.6% for AGIs $75k-100k, 94.9% for AGIs $100k-200k, 100.0% for AGIs over 200k)
Averages for the 2012 tax year for zip code 17756, filed in 2013:
Average Adjusted Gross Income (AGI) in 2012: $52,730 (Individual Income Tax Returns)
Here:
$52,730
State:
$61,346
Salary/wage: $42,732 (reported on 83.8% of returns)
Here:
$42,732
State:
$51,902
(% of AGI for various income ranges: 71.1% for AGIs below $25k, 77.0% for AGIs $25k-50k, 79.5% for AGIs $50k-75k, 78.6% for AGIs $75k-100k, 76.2% for AGIs $100k-200k, 24.3% for AGIs over 200k)
Taxable interest for individuals: $1,090 (reported on 38.0% of returns)
This zip code:
$1,090
Pennsylvania:
$1,588
(% of AGI for various income ranges: 1.6% for AGIs below $25k, 0.9% for AGIs $25k-50k, 0.5% for AGIs $50k-75k, 0.5% for AGIs $75k-100k, 0.6% for AGIs $100k-200k, 1.1% for AGIs over 200k)
Ordinary dividends: $3,806 (reported on 22.9% of returns)
Here:
$3,806
State:
$5,827
(% of AGI for various income ranges: 2.1% for AGIs below $25k, 1.1% for AGIs $25k-50k, 0.7% for AGIs $50k-75k, 0.8% for AGIs $75k-100k, 1.2% for AGIs $100k-200k, 4.4% for AGIs over 200k)
Net capital gain/loss in AGI: +$9,566 (reported on 12.9% of returns)
Here:
+$9,566
State:
+$14,495
(% of AGI for various income ranges: 0.3% for AGIs below $25k, 0.4% for AGIs $25k-50k, 0.2% for AGIs $50k-75k, 0.9% for AGIs $75k-100k, 1.5% for AGIs $100k-200k, 9.8% for AGIs over 200k)
Profit/loss from business: +$12,576 (reported on 11.5% of returns)
Here:
+$12,576
State:
+$16,268
(% of AGI for various income ranges: 3.4% for AGIs below $25k, 2.9% for AGIs $25k-50k, 1.9% for AGIs $50k-75k, 1.8% for AGIs $75k-100k, 2.7% for AGIs $100k-200k, 4.2% for AGIs over 200k)
Taxable individual retirement arrangement distribution: $9,942 (reported on 12.0% of returns)
17756:
$9,942
Pennsylvania:
$14,550
(% of AGI for various income ranges: 4.6% for AGIs below $25k, 2.7% for AGIs $25k-50k, 2.2% for AGIs $50k-75k, 1.9% for AGIs $75k-100k, 3.2% for AGIs $100k-200k)
Total itemized deductions: $18,923 (20% of AGI, reported on 24.2% of returns)
Here:
$18,923
State:
$23,538
Here:
19.6% of AGI
State:
18.4% of AGI
(% of AGI for various income ranges: 6.7% for AGIs below $25k, 6.5% for AGIs $25k-50k, 8.0% for AGIs $50k-75k, 9.2% for AGIs $75k-100k, 11.8% for AGIs $100k-200k, 8.0% for AGIs over 200k)
Charity contributions: $3,729 (reported on 17.8% of returns)
Here:
$3,729
State:
$4,025
(% of AGI for various income ranges: 0.5% for AGIs below $25k, 0.7% for AGIs $25k-50k, 0.9% for AGIs $50k-75k, 1.2% for AGIs $75k-100k, 2.0% for AGIs $100k-200k, 1.7% for AGIs over 200k)
Taxes paid: $7,542 (reported on 24.2% of returns)
17756:
$7,542
State:
$9,982
(% of AGI for various income ranges: 1.1% for AGIs below $25k, 1.9% for AGIs $25k-50k, 2.6% for AGIs $50k-75k, 3.7% for AGIs $75k-100k, 5.3% for AGIs $100k-200k, 4.6% for AGIs over 200k)
Earned income credit: $1,873 (reported on 13.6% of returns)
Here:
$1,873
State:
$2,106
(% of AGI for various income ranges: 4.2% for AGIs below $25k, 0.9% for AGIs $25k-50k)
Percentage of individuals using paid preparers for their 2012 taxes: 60.5%
Here:
61%
State:
53%
(% for various income ranges: 52.6% for AGIs below $25k, 62.6% for AGIs $25k-50k, 65.2% for AGIs $50k-75k, 66.1% for AGIs $75k-100k, 68.8% for AGIs $100k-200k, 88.9% for AGIs over 200k)
Averages for the 2004 tax year for zip code 17756, filed in 2005:
Average Adjusted Gross Income (AGI) in 2004: $40,841 (Individual Income Tax Returns)
Here:
$40,841
State:
$48,049
Salary/wage: $34,415 (reported on 84.7% of returns)
Here:
$34,415
State:
$42,646
(% of AGI for various income ranges: 85.9% for AGIs below $10k, 71.7% for AGIs $10k-25k, 83.1% for AGIs $25k-50k, 83.7% for AGIs $50k-75k, 79.0% for AGIs $75k-100k, 43.2% for AGIs over 100k)
Taxable interest for individuals: $1,016 (reported on 50.9% of returns)
This zip code:
$1,016
Pennsylvania:
$1,657
(% of AGI for various income ranges: 5.5% for AGIs below $10k, 2.3% for AGIs $10k-25k, 1.3% for AGIs $25k-50k, 0.9% for AGIs $50k-75k, 1.2% for AGIs $75k-100k, 0.9% for AGIs over 100k)
Taxable dividends: $2,250 (reported on 28.3% of returns)
Here:
$2,250
State:
$3,566
(% of AGI for various income ranges: 5.2% for AGIs below $10k, 2.0% for AGIs $10k-25k, 1.1% for AGIs $25k-50k, 1.0% for AGIs $50k-75k, 1.6% for AGIs $75k-100k, 2.0% for AGIs over 100k)
Net capital gain/loss: +$4,711 (reported on 16.8% of returns)
Here:
+$4,711
State:
+$9,716
(% of AGI for various income ranges: -3.4% for AGIs below $10k, 0.6% for AGIs $10k-25k, 0.6% for AGIs $25k-50k, 1.2% for AGIs $50k-75k, 1.9% for AGIs $75k-100k, 4.9% for AGIs over 100k)
Profit/loss from business: +$9,729 (reported on 13.8% of returns)
Here:
+$9,729
State:
+$14,267
(% of AGI for various income ranges: 3.0% for AGIs below $10k, 5.1% for AGIs $10k-25k, 2.3% for AGIs $25k-50k, 1.7% for AGIs $50k-75k, 2.6% for AGIs $75k-100k, 5.3% for AGIs over 100k)
IRA payment deduction: $2,814 (reported on 2.7% of returns)
17756:
$2,814
Pennsylvania:
$2,903
(% of AGI for various income ranges: 0.2% for AGIs $10k-25k, 0.3% for AGIs $25k-50k, 0.2% for AGIs $50k-75k, 0.2% for AGIs $75k-100k, 0.1% for AGIs over 100k)
Self-employed pension: $10,370 (reported on 0.5% of returns)
Here:
$10,370
Pennsylvania:
$14,674
Total itemized deductions: $16,432 (20% of AGI, reported on 25.0% of returns)
Here:
$16,432
State:
$18,804
Here:
19.5% of AGI
State:
19.5% of AGI
(% of AGI for various income ranges: 7.8% for AGIs below $10k, 5.8% for AGIs $10k-25k, 7.6% for AGIs $25k-50k, 10.7% for AGIs $50k-75k, 12.4% for AGIs $75k-100k, 12.2% for AGIs over 100k)
Charity contributions deductions: $2,681 (3% of AGI, reported on 20.9% of returns)
Here:
$2,681
State:
$3,337
Here:
3.0% of AGI
State:
3.3% of AGI
(% of AGI for various income ranges: 0.4% for AGIs below $10k, 0.7% for AGIs $10k-25k, 0.8% for AGIs $25k-50k, 1.3% for AGIs $50k-75k, 2.0% for AGIs $75k-100k, 1.9% for AGIs over 100k)
Total tax: $4,756 (reported on 75.0% of returns)
17756:
$4,756
State:
$8,008
(% of AGI for various income ranges: 2.4% for AGIs below $10k, 4.2% for AGIs $10k-25k, 6.5% for AGIs $25k-50k, 8.4% for AGIs $50k-75k, 10.6% for AGIs $75k-100k, 12.5% for AGIs over 100k)
Earned income credit: $1,424 (reported on 12.9% of returns)
Here:
$1,424
State:
$1,643
Percentage of individuals using paid preparers for their 2004 taxes: 57.3%
Here:
57%
State:
56%
(% for various income ranges: 48.5% for AGIs below $10k, 57.7% for AGIs $10k-25k, 60.7% for AGIs $25k-50k, 59.5% for AGIs $50k-75k, 56.9% for AGIs $75k-100k, 70.0% for AGIs over 100k)
Likely homosexual households (counted as self-reported same-sex unmarried-partner households)
Lesbian couples: 0.3% of all households
Gay men: 0.0% of all households
Household received Food Stamps/SNAP in the past 12 months: 425 Household did not receive Food Stamps/SNAP in the past 12 months: 3,933
Women who had a birth in the past 12 months: 121 (103 now married, 20 unmarried) Women who did not have a birth in the past 12 months: 3,164 (1,220 now married, 1,945 unmarried)
Housing units in zip code 17756 with a mortgage: 1,918 (168 second mortgage, 158 both second mortgage and home equity loan) Houses without a mortgage: 241
Median monthly owner costs for units with a mortgage: $1,400 Median monthly owner costs for units without a mortgage: $575
Residents with income below the poverty level in 2022:
This zip code:
9.4%
Whole state:
11.8%
Residents with income below 50% of the poverty level in 2022:
This zip code:
6.4%
Whole state:
6.1%
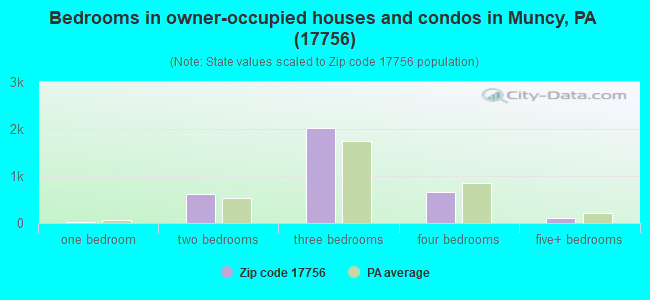
Median number of rooms in houses and condos:
Here:
6.8
State:
6.8
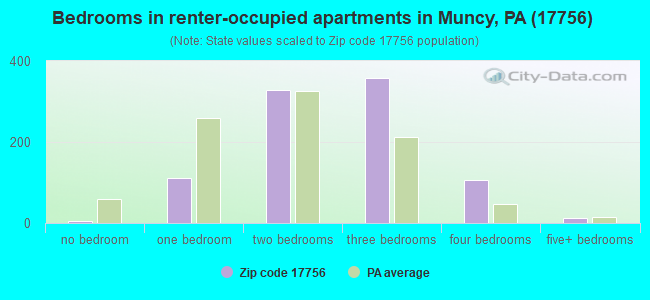
Median number of rooms in apartments:
Here:
5.6
State:
4.3
Notable locations in this zip code not listed on our city pages
Notable locations in zip code 17756: Halls Station (A), Halls (B), Muncy Station (C), Opp (D), Keystone Hook and Ladder Company 1 (E), Muncy Township Volunteer Fire Company (F), Muncy Industrial Home for Women (G), Muncy Creek Community Fire Company Clarkstown (H), Lairdsville Community Volunteer Fire Company (I). Display/hide their locations on the map
Churches in zip code 17756 include: Van Dine Church (A), Pleasant View Church (B), Trinity Church (C), Moreland Community Church (D), Saint James Church (E), Muney Church (F), Immanuel Church (G). Display/hide their locations on the map
Streams, rivers, and creeks: Oak Run (A), Wolf Run (B), Sugar Run (C), Jakes Run (D), Twin Run (E), Gregs Run (F), Glade Run (G), German Run (H), Derr Run (I). Display/hide their locations on the map
1,586 married couples with children.
630 single-parent households (219 men, 411 women).
94.5% of residents of 17756 zip code speak English at home.
3.6% of residents speak Spanish at home (20% very well, 11% well, 24% not well, 46% not at all).
1.1% of residents speak other Indo-European language at home (48% very well, 44% well, 8% not well).
0.6% of residents speak Asian or Pacific Island language at home (48% very well, 41% well, 11% not well).
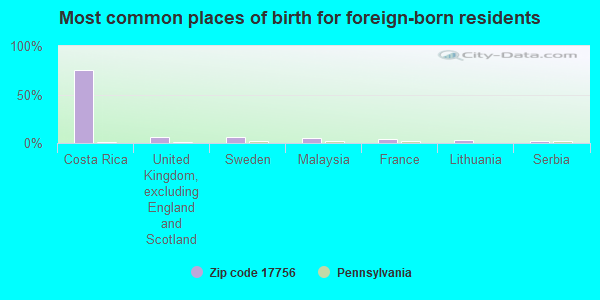
Foreign born population: 433 (3.5%) (34.6% of them are naturalized citizens)
This zip code:
3.5%
Whole state:
7.5%
76%Costa Rica
6%United Kingdom, excluding England and Scotland
6%Sweden
5%Malaysia
4%France
3%Lithuania
3%Serbia
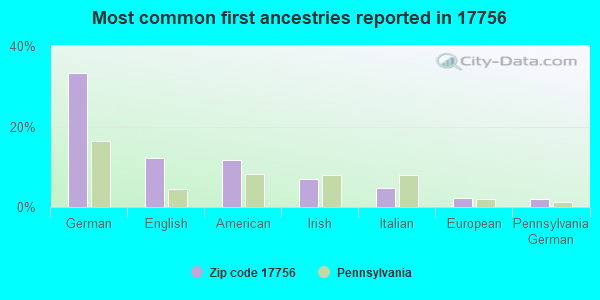
33%German
12%English
12%American
7%Irish
5%Italian
2%European
2%Pennsylvania German
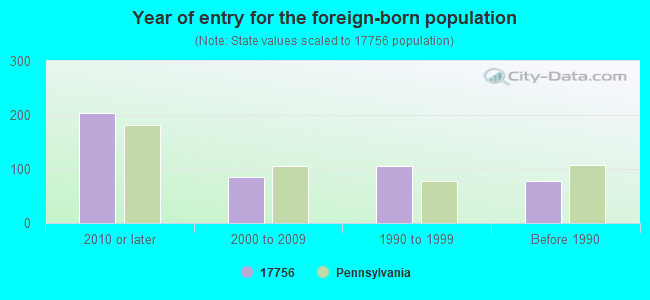
Year of entry for the foreign-born population
2032010 or later
852000 to 2009
1061990 to 1999
78Before 1990
Facilities with environmental interests located in this zip code:
ANDRITZ MFG (35 SHERMAN STREET in MUNCY, PA)
AIR MAJOR (AIRS/AFS) ENFORCEMENT/COMPLIANCE ACTIVITY (Integrated Compliance Information System) CRITERIA AND HAZARDOUS AIR POLLUTANT INVENTORY (Inventory of air pollution sources) STATE MASTER (Pennsylvania database) - AFS-14-1438713-1, AIR PROGRAM, RCRIS-PAD003031903, HAZARDOUS WASTE PROGRAM STATE MASTER (Pennsylvania database) - PCS-PAR114801, National Pollutant Discharge Elimination System Permit National Pollutant Discharge Elimination System NON-MAJOR (Tracking pollutant discharge elimination systems) - permit HAZARDOUS WASTE BIENNIAL REPORTER (Resource Conservation and Recovery Act (tracking hazardous waste)) Large Quantity Generators, more that 1000 kg of hazardous waste/month (Resource Conservation and Recovery Act (tracking hazardous waste)) TSD (Resource Conservation and Recovery Act (tracking hazardous waste)) - notification TRI REPORTER (Tracking of toxic chemicals releasing facilities) Business SIC classification: SILVER ORES; CONVEYORS AND CONVEYING EQUIPMENT; PAPER INDUSTRIES MACHINERY; SPECIAL INDUSTRY MACHINERY; GENERAL INDUSTRIAL MACHINERY AND EQUIPMENT Organizations: ANDRITZ INC (CONTACT/OPERATOR)
, ANDRITZ INC. (CONTACT/OWNER)
Alternative names: ANDRITZ INC, ANDRITZ FOUNDRY, ANDRITZ SPROUT-BAUER
ALEXANDER NISSAN (125 LYCOMING MALL RD in MUNCY, PA)
AIR MINOR (AIRS/AFS) STATE MASTER (Pennsylvania database) - PWSID-4411016, DRINKING WATER PROGRAM
ACE PAINT & BODY SHOP (OLD RT 147 1 MI NW OF MUNCY in MUNCY, PA)
AIR MINOR (AIRS/AFS) Conditionally Exempt Small Quantity Generators, less than 100 kg/month of hazardous waste (Resource Conservation and Recovery Act (tracking hazardous waste)) - notification Business SIC classification: TOP, BODY, AND UPHOLSTERY REPAIR SHOPS AND PAINT SHOPS; AUTOMOTIVE REPAIR SHOPS Organizations: ROTHERMEL JAMES (CONTACT/OWNER)
ADVANCE DRAINAGE SYSTEMS (MUNCY INDUST PARK in MUNCY, PA)
National Pollutant Discharge Elimination System NON-MAJOR (Tracking pollutant discharge elimination systems) - permit Business SIC classification: PLASTICS PIPE
BEAMERS BODY SHOP (NORTH OF MUNCY ON SR 2014 in MUNCY, PA)
Conditionally Exempt Small Quantity Generators, less than 100 kg/month of hazardous waste (Resource Conservation and Recovery Act (tracking hazardous waste)) - notification Organizations: RALPH C BEAMER JR (CONTACT/OWNER)
ABB SPROUT-BAUER, INC. (SHERMAN STREET in MUNCY, PA)
COMPLIANCE ACTIVITY (Tracking inspections of insecticide, fungicide, and rodenticide, and toxic substances)
Housing units lacking complete plumbing facilities: 2.2% Housing units lacking complete kitchen facilities: 2.8%
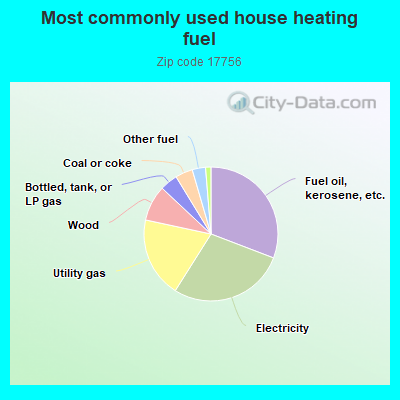
30.8%Fuel oil, kerosene, etc.
28.1%Electricity
19.4%Utility gas
8.6%Wood
4.3%Bottled, tank, or LP gas
4.2%Coal or coke
3.2%Other fuel
1.3%No fuel used
Population in 1990: 8,627. Population change in the 1990s: +3,328 (+38.6%).
Place of birth for U.S.-born residents:
This state: 9,962
Northeast: 988
Midwest: 155
South: 667
West: 105
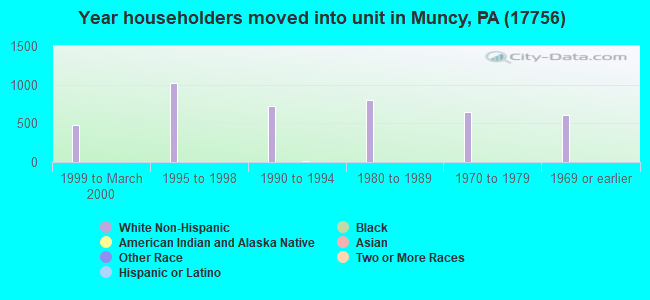
66% of the 17756 zip code residents lived in the same house 5 years ago. Out of people who lived in different houses, 61% lived in this county. Out of people who lived in different counties, 50% lived in Pennsylvania.
89% of the 17756 zip code residents lived in the same house 1 year ago. Out of people who lived in different houses, 41% moved from this county. Out of people who lived in different houses, 44% moved from different county within same state. Out of people who lived in different houses, 10% moved from different state. Out of people who lived in different houses, 4% moved from abroad.
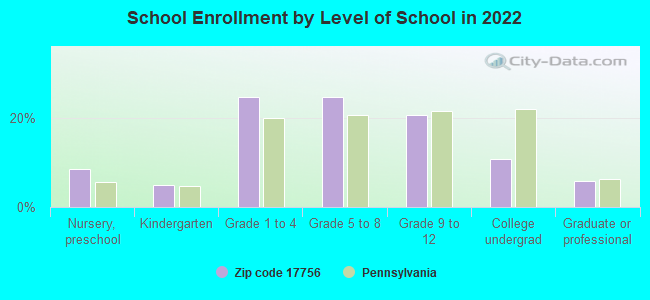
Private vs. public school enrollment:
Students in private schools in grades 1 to 8 (elementary and middle school): 81
Here:
7.5%
Pennsylvania:
15.7%
Students in private schools in grades 9 to 12 (high school): 33
Here:
7.5%
Pennsylvania:
13.4%
Students in private undergraduate colleges: 42
Here:
17.8%
Pennsylvania:
39.8%
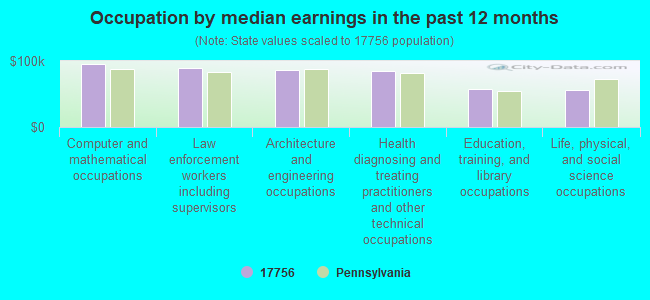
Occupation by median earnings in the past 12 months ($)
94,905Computer and mathematical occupations
89,731Law enforcement workers including supervisors
86,412Architecture and engineering occupations
84,967Health diagnosing and treating practitioners and other technical occupations
57,476Education, training, and library occupations
55,445Life, physical, and social science occupations
Companies with federal contracts located in this zip code:
FIELD-TEC SERVICES INC (2040 LIME BLUFF ROAD in MUNCY, PA; small business) : $71,634 in 5 contractsfrom 2000 to 2003
Contracts for Maintenance, Repair and Rebuilding of Equipment -- Construction, Mining, Excavating, and Highway Maintenance Equipment, Maintenance, Repair and Rebuilding of Equipment -- Materials Handling Equipment by Army Signed by year:2000: $36,600; 2001: $5,239; 2002: $0; 2003: $29,795; 2004: $0; 2005: $0; 2006: $0.
Biggest contracts:
$36,600 with Army for Maintenance, Repair and Rebuilding of Equipment -- Construction, Mining, Excavating, and Highway Maintenance Equipment. Signed on 2000-12-22. Completion date: 2001-02-28.
$24,980, same as above.Signed on 2003-03-14. Completion date: 2003-04-14.
$5,239, same as above.Signed on 2001-04-10. Completion date: 2001-03-30.
$2,940 with Army for Maintenance, Repair and Rebuilding of Equipment -- Materials Handling Equipment. Signed on 2003-03-27. Completion date: 2003-04-07.
Top industries in this zip code by the number of employees in 2005:
Health Care and Social Assistance: General Medical and Surgical Hospitals (250-499 employees: 1 establishment)
Administrative and Support and Waste Management and Remediation Services: Security Guards and Patrol Services (100-249: 1, 20-49: 1)
People in group quarters in 2010:
1,456 people in state prisons
118 people in nursing facilities/skilled-nursing facilities
25 people in group homes for juveniles (non-correctional)
3 people in other noninstitutional facilities
2 people in group homes intended for adults
People in group quarters in 2000:
868 people in state prisons
121 people in nursing homes
26 people in other noninstitutional group quarters
Fatal accident statistics in 2014:
Fatal accident count: 3
Vehicles involved in fatal accidents: 5
Fatal accidents caused by drunken drivers: 1
Fatalities: 3
Persons involved in fatal accidents: 6
Pedestrians involved in fatal accidents: 0
Fatal accident statistics in 2013:
Fatal accident count: 1
Vehicles involved in fatal accidents: 1
Fatal accidents caused by drunken drivers: 0
Fatalities: 1
Persons involved in fatal accidents: 1
Pedestrians involved in fatal accidents: 0
Home Mortgage Disclosure Act Aggregated Statistics For Year 2009 (Based on 2 full and 10 partial tracts)
A) FHA, FSA/RHS & VA Home Purchase Loans
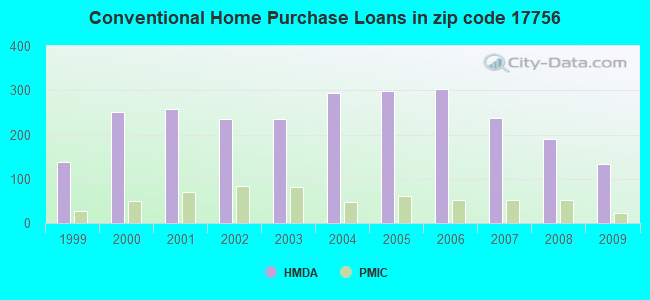
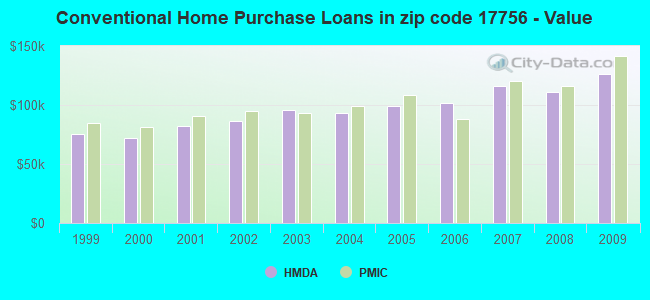
B) Conventional Home Purchase Loans
C) Refinancings
D) Home Improvement Loans
E) Loans on Dwellings For 5+ Families
F) Non-occupant Loans on < 5 Family Dwellings (A B C & D)
G) Loans On Manufactured Home Dwelling (A B C & D)
Number
Average Value
Number
Average Value
Number
Average Value
Number
Average Value
Number
Average Value
Number
Average Value
Number
Average Value
LOANS ORIGINATED
46
$126,775
133
$126,060
377
$115,952
84
$54,797
2
$493,635
27
$146,841
42
$70,252
APPLICATIONS APPROVED, NOT ACCEPTED
4
$142,225
7
$62,910
26
$127,277
0
$0
0
$0
1
$156,520
4
$36,168
APPLICATIONS DENIED
4
$128,197
24
$100,170
153
$116,214
18
$28,674
0
$0
10
$104,658
12
$34,540
APPLICATIONS WITHDRAWN
1
$92,760
9
$184,689
104
$125,563
8
$69,361
0
$0
1
$51,200
4
$75,938
FILES CLOSED FOR INCOMPLETENESS
0
$0
0
$0
8
$146,401
0
$0
0
$0
0
$0
0
$0
Aggregated Statistics For Year 2008 (Based on 2 full and 10 partial tracts)
A) FHA, FSA/RHS & VA Home Purchase Loans
B) Conventional Home Purchase Loans
C) Refinancings
D) Home Improvement Loans
E) Loans on Dwellings For 5+ Families
F) Non-occupant Loans on < 5 Family Dwellings (A B C & D)
G) Loans On Manufactured Home Dwelling (A B C & D)
Number
Average Value
Number
Average Value
Number
Average Value
Number
Average Value
Number
Average Value
Number
Average Value
Number
Average Value
LOANS ORIGINATED
35
$109,329
189
$110,647
244
$98,100
151
$36,765
3
$338,307
41
$86,190
45
$55,285
APPLICATIONS APPROVED, NOT ACCEPTED
3
$133,177
19
$99,180
39
$95,064
14
$40,981
0
$0
6
$67,138
2
$36,600
APPLICATIONS DENIED
7
$87,794
33
$69,491
187
$113,693
40
$34,108
0
$0
11
$91,631
19
$46,015
APPLICATIONS WITHDRAWN
3
$93,217
24
$108,485
82
$119,591
14
$49,899
0
$0
2
$111,990
3
$32,317
FILES CLOSED FOR INCOMPLETENESS
0
$0
6
$84,657
3
$127,557
2
$68,425
0
$0
1
$16,410
2
$98,725
Aggregated Statistics For Year 2007 (Based on 2 full and 10 partial tracts)
A) FHA, FSA/RHS & VA Home Purchase Loans
B) Conventional Home Purchase Loans
C) Refinancings
D) Home Improvement Loans
E) Loans on Dwellings For 5+ Families
F) Non-occupant Loans on < 5 Family Dwellings (A B C & D)
G) Loans On Manufactured Home Dwelling (A B C & D)
Number
Average Value
Number
Average Value
Number
Average Value
Number
Average Value
Number
Average Value
Number
Average Value
Number
Average Value
LOANS ORIGINATED
19
$118,947
237
$116,252
310
$86,906
171
$34,820
2
$185,725
42
$102,463
54
$62,332
APPLICATIONS APPROVED, NOT ACCEPTED
2
$119,610
21
$108,281
52
$91,235
11
$53,719
0
$0
2
$130,295
5
$45,818
APPLICATIONS DENIED
3
$108,093
57
$107,834
261
$100,864
66
$52,635
0
$0
13
$54,112
27
$44,678
APPLICATIONS WITHDRAWN
0
$0
22
$125,534
101
$102,472
10
$70,616
0
$0
2
$95,795
2
$52,785
FILES CLOSED FOR INCOMPLETENESS
0
$0
7
$144,803
33
$105,362
0
$0
0
$0
1
$110,210
0
$0
Aggregated Statistics For Year 2006 (Based on 2 full and 10 partial tracts)
A) FHA, FSA/RHS & VA Home Purchase Loans
B) Conventional Home Purchase Loans
C) Refinancings
D) Home Improvement Loans
E) Loans on Dwellings For 5+ Families
F) Non-occupant Loans on < 5 Family Dwellings (A B C & D)
G) Loans On Manufactured Home Dwelling (A B C & D)
Number
Average Value
Number
Average Value
Number
Average Value
Number
Average Value
Number
Average Value
Number
Average Value
Number
Average Value
LOANS ORIGINATED
19
$136,655
302
$101,712
411
$82,249
170
$33,467
1
$153,200
58
$101,196
35
$54,328
APPLICATIONS APPROVED, NOT ACCEPTED
1
$169,440
20
$82,060
68
$72,170
27
$37,067
0
$0
5
$56,566
3
$70,877
APPLICATIONS DENIED
0
$0
94
$77,361
298
$97,710
67
$38,449
0
$0
16
$76,628
45
$53,755
APPLICATIONS WITHDRAWN
1
$41,030
36
$97,765
183
$89,308
4
$107,270
0
$0
4
$43,695
7
$61,081
FILES CLOSED FOR INCOMPLETENESS
0
$0
5
$69,330
48
$104,808
3
$19,603
0
$0
0
$0
2
$47,900
Aggregated Statistics For Year 2005 (Based on 2 full and 10 partial tracts)
A) FHA, FSA/RHS & VA Home Purchase Loans
B) Conventional Home Purchase Loans
C) Refinancings
D) Home Improvement Loans
E) Loans on Dwellings For 5+ Families
F) Non-occupant Loans on < 5 Family Dwellings (A B C & D)
G) Loans On Manufactured Home Dwelling (A B C & D)
Number
Average Value
Number
Average Value
Number
Average Value
Number
Average Value
Number
Average Value
Number
Average Value
Number
Average Value
LOANS ORIGINATED
12
$134,225
298
$99,275
463
$82,962
157
$33,189
1
$84,830
45
$71,818
37
$46,728
APPLICATIONS APPROVED, NOT ACCEPTED
1
$24,620
41
$68,940
85
$97,409
21
$20,060
0
$0
2
$86,020
21
$47,163
APPLICATIONS DENIED
4
$115,825
95
$67,212
354
$96,557
72
$42,871
0
$0
9
$72,529
44
$41,872
APPLICATIONS WITHDRAWN
0
$0
47
$107,256
209
$110,206
15
$86,317
0
$0
7
$132,539
8
$66,254
FILES CLOSED FOR INCOMPLETENESS
0
$0
4
$90,002
22
$113,588
9
$45,620
0
$0
0
$0
0
$0
Aggregated Statistics For Year 2004 (Based on 2 full and 10 partial tracts)
A) FHA, FSA/RHS & VA Home Purchase Loans
B) Conventional Home Purchase Loans
C) Refinancings
D) Home Improvement Loans
F) Non-occupant Loans on < 5 Family Dwellings (A B C & D)
G) Loans On Manufactured Home Dwelling (A B C & D)
Number
Average Value
Number
Average Value
Number
Average Value
Number
Average Value
Number
Average Value
Number
Average Value
LOANS ORIGINATED
9
$108,374
293
$93,093
593
$80,744
167
$32,897
56
$90,410
54
$50,476
APPLICATIONS APPROVED, NOT ACCEPTED
2
$71,360
23
$96,684
109
$79,123
29
$32,586
2
$80,830
22
$43,655
APPLICATIONS DENIED
1
$90,560
73
$89,091
399
$89,705
89
$29,152
18
$77,174
41
$46,029
APPLICATIONS WITHDRAWN
2
$179,860
41
$105,466
251
$89,446
33
$68,724
12
$88,092
2
$59,370
FILES CLOSED FOR INCOMPLETENESS
0
$0
2
$90,865
38
$93,932
2
$128,210
1
$41,620
0
$0
Aggregated Statistics For Year 2003 (Based on 2 full and 10 partial tracts)
A) FHA, FSA/RHS & VA Home Purchase Loans
B) Conventional Home Purchase Loans
C) Refinancings
D) Home Improvement Loans
E) Loans on Dwellings For 5+ Families
F) Non-occupant Loans on < 5 Family Dwellings (A B C & D)
Number
Average Value
Number
Average Value
Number
Average Value
Number
Average Value
Number
Average Value
Number
Average Value
LOANS ORIGINATED
17
$98,339
236
$95,876
887
$86,895
126
$25,314
3
$181,087
42
$62,888
APPLICATIONS APPROVED, NOT ACCEPTED
3
$86,943
26
$93,187
121
$79,461
10
$36,069
0
$0
0
$0
APPLICATIONS DENIED
4
$70,870
63
$55,317
332
$87,324
55
$25,506
0
$0
12
$62,701
APPLICATIONS WITHDRAWN
4
$107,372
29
$84,127
205
$95,665
7
$115,819
0
$0
3
$70,373
FILES CLOSED FOR INCOMPLETENESS
1
$43,380
4
$61,190
26
$102,074
4
$34,210
0
$0
1
$55,770
Aggregated Statistics For Year 2002 (Based on 2 full and 10 partial tracts)
A) FHA, FSA/RHS & VA Home Purchase Loans
B) Conventional Home Purchase Loans
C) Refinancings
D) Home Improvement Loans
F) Non-occupant Loans on < 5 Family Dwellings (A B C & D)
Number
Average Value
Number
Average Value
Number
Average Value
Number
Average Value
Number
Average Value
LOANS ORIGINATED
19
$95,667
234
$86,303
570
$87,048
107
$24,009
28
$71,682
APPLICATIONS APPROVED, NOT ACCEPTED
2
$118,545
35
$71,868
108
$69,403
25
$20,090
4
$151,948
APPLICATIONS DENIED
3
$50,653
97
$64,550
288
$82,738
40
$15,330
15
$81,405
APPLICATIONS WITHDRAWN
2
$67,450
44
$76,460
126
$93,494
12
$23,205
4
$79,170
FILES CLOSED FOR INCOMPLETENESS
0
$0
2
$91,610
16
$84,238
0
$0
0
$0
Aggregated Statistics For Year 2001 (Based on 2 full and 10 partial tracts)
A) FHA, FSA/RHS & VA Home Purchase Loans
B) Conventional Home Purchase Loans
C) Refinancings
D) Home Improvement Loans
F) Non-occupant Loans on < 5 Family Dwellings (A B C & D)
Number
Average Value
Number
Average Value
Number
Average Value
Number
Average Value
Number
Average Value
LOANS ORIGINATED
22
$95,891
258
$82,226
496
$73,267
162
$25,581
20
$67,272
APPLICATIONS APPROVED, NOT ACCEPTED
1
$134,780
46
$52,736
77
$66,706
15
$27,637
6
$52,410
APPLICATIONS DENIED
2
$73,490
102
$59,979
277
$73,095
59
$19,278
3
$122,303
APPLICATIONS WITHDRAWN
2
$86,340
37
$75,316
126
$72,389
8
$38,116
6
$88,878
FILES CLOSED FOR INCOMPLETENESS
1
$90,370
4
$77,712
20
$83,734
1
$29,200
0
$0
Aggregated Statistics For Year 2000 (Based on 2 full and 10 partial tracts)
A) FHA, FSA/RHS & VA Home Purchase Loans
B) Conventional Home Purchase Loans
C) Refinancings
D) Home Improvement Loans
E) Loans on Dwellings For 5+ Families
F) Non-occupant Loans on < 5 Family Dwellings (A B C & D)
Number
Average Value
Number
Average Value
Number
Average Value
Number
Average Value
Number
Average Value
Number
Average Value
LOANS ORIGINATED
23
$84,140
251
$71,925
213
$60,417
242
$19,995
0
$0
65
$57,018
APPLICATIONS APPROVED, NOT ACCEPTED
3
$60,253
37
$46,896
59
$56,612
29
$18,354
0
$0
2
$27,370
APPLICATIONS DENIED
5
$86,960
133
$43,235
193
$62,967
74
$28,915
0
$0
7
$64,640
APPLICATIONS WITHDRAWN
0
$0
22
$84,332
88
$60,257
16
$23,572
1
$21,180
6
$55,218
FILES CLOSED FOR INCOMPLETENESS
0
$0
0
$0
26
$74,851
2
$14,660
0
$0
0
$0
Aggregated Statistics For Year 1999 (Based on 1 full and 5 partial tracts)
A) FHA, FSA/RHS & VA Home Purchase Loans
B) Conventional Home Purchase Loans
C) Refinancings
D) Home Improvement Loans
E) Loans on Dwellings For 5+ Families
F) Non-occupant Loans on < 5 Family Dwellings (A B C & D)
2005 - 2018 National Fire Incident Reporting System (NFIRS) incidents
According to the data from the years 2005 - 2018 the average number of fire incidents per year is 21. The highest number of reported fires - 46 took place in 2018, and the least - 3 in 2005. The data has an increasing trend.
When looking into fire subcategories, the most reports belonged to: Structure Fires (54.5%), and Outside Fires (25.7%).
Fire incident types reported to NFIRS in Zip Code 17756


 Nearest zip codes: 17762, 17772, 17737, 17777, 17742, 17749.
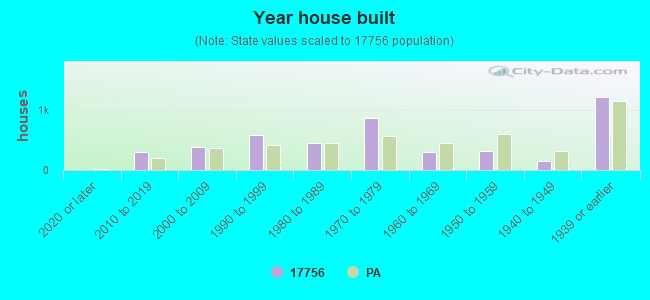


 According to the data from the years 2005 - 2018 the average number of fire incidents per year is 21. The highest number of reported fires - 46 took place in 2018, and the least - 3 in 2005. The data has an increasing trend.
 When looking into fire subcategories, the most reports belonged to: Structure Fires (54.5%), and Outside Fires (25.7%).