Estimated zip code population in 2022: 3,112 Zip code population in 2010: 3,034 Zip code population in 2000: 2,974
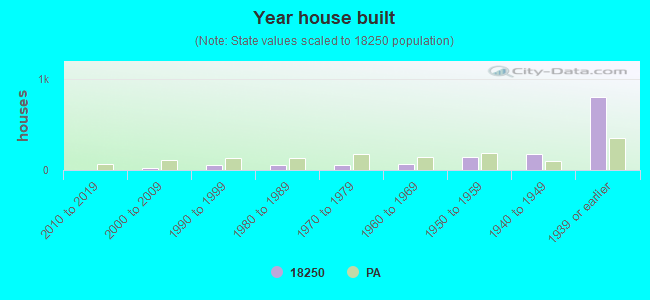
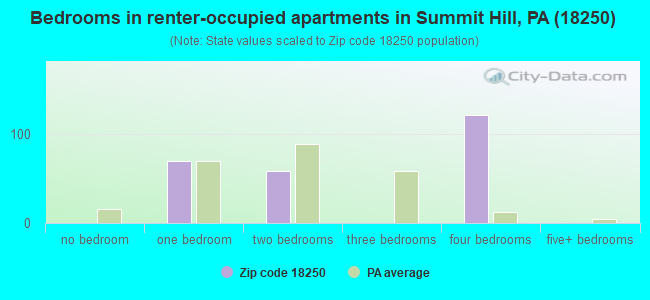
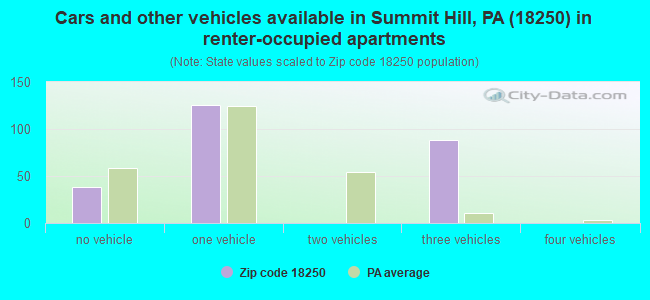
Houses and condos: 1,426 Renter-occupied apartments: 253
% of renters here:
19%
State:
31%
March 2022 cost of living index in zip code 18250: 96.3 (near average, U.S. average is 100)
Land area: 8.7 sq. mi. Water area: 0.4 sq. mi.
Population density: 358 people per square mile
(very low).
OSM Map
General Map
Google Map
MSN Map
OSM Map
General Map
Google Map
MSN Map
OSM Map
General Map
Google Map
MSN Map
OSM Map
General Map
Google Map
MSN Map
Please wait while loading the map...
Real estate property taxes paid for housing units in 2022:
This zip code:
2.2% ($2,148)
Pennsylvania:
1.3% ($3,094)
Median real estate property taxes paid for housing units with mortgages in 2022: $1,967 (1.8%) Median real estate property taxes paid for housing units with no mortgage in 2022: $2,338 (2.6%)
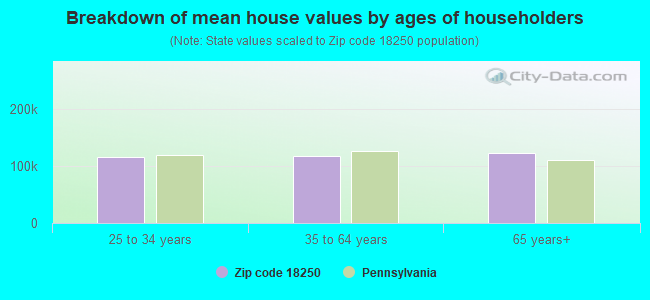
Estimated median house/condo value in 2022: $98,873
18250:
$98,873
Pennsylvania:
$245,500
According to our research of Pennsylvania and other state lists, there were 3 registered sex offenders living in 18250 zip code as of April 27, 2024. The ratio of all residents to sex offenders in zip code 18250 is 1,006 to 1. The ratio of registered sex offenders to all residents in this zip code is lower than the state average.
Median resident age:
This zip code:
40.8 years
Pennsylvania median age:
40.9 years
Average household size:
This zip code:
2.3 people
Pennsylvania:
2.4 people
Averages for the 2020 tax year for zip code 18250, filed in 2021:
Average Adjusted Gross Income (AGI) in 2020: $53,027 (Individual Income Tax Returns)
Here:
$53,027
State:
$75,707
Salary/wage: $49,690 (reported on 76.7% of returns)
Here:
$49,690
State:
$62,806
(% of AGI for various income ranges: 761.3% for AGIs below $25k, 3022.9% for AGIs $25k-50k, 6120.0% for AGIs $50k-75k, 8195.0% for AGIs $75k-100k, 19268.3% for AGIs $100k-200k)
Taxable interest for individuals: $961 (reported on 25.3% of returns)
This zip code:
$961
Pennsylvania:
$1,633
(% of AGI for various income ranges: 28.9% for AGIs below $25k, 27.6% for AGIs $25k-50k, 28.9% for AGIs $50k-75k, 25.0% for AGIs $75k-100k, 65.8% for AGIs $100k-200k)
Ordinary dividends: $2,130 (reported on 18.0% of returns)
Here:
$2,130
State:
$7,382
(% of AGI for various income ranges: 35.3% for AGIs below $25k, 33.2% for AGIs $25k-50k, 6.7% for AGIs $50k-75k, 47.5% for AGIs $75k-100k, 215.8% for AGIs $100k-200k)
Net capital gain/loss in AGI: +$5,437 (reported on 12.7% of returns)
Here:
+$5,437
State:
+$23,522
(% of AGI for various income ranges: 6.3% for AGIs below $25k, 44.4% for AGIs $25k-50k, 26.1% for AGIs $50k-75k, 141.7% for AGIs $75k-100k, 534.2% for AGIs $100k-200k)
Profit/loss from business: +$8,977 (reported on 8.7% of returns)
Here:
+$8,977
State:
+$16,274
(% of AGI for various income ranges: 62.9% for AGIs below $25k, 125.9% for AGIs $25k-50k, 213.9% for AGIs $50k-75k, 95.8% for AGIs $100k-200k)
Taxable individual retirement arrangement distribution: $11,612 (reported on 10.7% of returns)
18250:
$11,612
Pennsylvania:
$18,583
(% of AGI for various income ranges: 88.9% for AGIs below $25k, 167.6% for AGIs $25k-50k, 310.0% for AGIs $75k-100k, 481.7% for AGIs $100k-200k)
Total itemized deductions: $28,900 (reported on 1.3% of returns)
Here:
$28,900
State:
$34,850
(% of AGI for various income ranges: 321.1% for AGIs $50k-75k)
Taxes paid: $8,450 (reported on 1.3% of returns)
18250:
$8,450
State:
$8,200
(% of AGI for various income ranges: 93.9% for AGIs $50k-75k)
Earned income credit: $1,833 (reported on 16.0% of returns)
Here:
$1,833
State:
$2,100
(% of AGI for various income ranges: 66.6% for AGIs below $25k, 55.0% for AGIs $25k-50k)
Percentage of individuals using paid preparers for their 2020 taxes: 94.7%
Here:
95%
State:
92%
(% for various income ranges: 94.4% for AGIs below $25k, 95.0% for AGIs $25k-50k, 95.7% for AGIs $50k-75k, 93.3% for AGIs $75k-100k, 106.2% for AGIs $100k-200k, 0.0% for AGIs over 200k)
Averages for the 2012 tax year for zip code 18250, filed in 2013:
Average Adjusted Gross Income (AGI) in 2012: $42,251 (Individual Income Tax Returns)
Here:
$42,251
State:
$61,346
Salary/wage: $40,062 (reported on 79.5% of returns)
Here:
$40,062
State:
$51,902
(% of AGI for various income ranges: 61.0% for AGIs below $25k, 80.4% for AGIs $25k-50k, 80.6% for AGIs $50k-75k, 80.5% for AGIs $75k-100k, 69.1% for AGIs $100k-200k)
Taxable interest for individuals: $876 (reported on 31.5% of returns)
This zip code:
$876
Pennsylvania:
$1,588
(% of AGI for various income ranges: 2.0% for AGIs below $25k, 0.7% for AGIs $25k-50k, 0.7% for AGIs $50k-75k, 0.2% for AGIs $75k-100k, 0.3% for AGIs $100k-200k)
Ordinary dividends: $1,747 (reported on 20.5% of returns)
Here:
$1,747
State:
$5,827
(% of AGI for various income ranges: 2.1% for AGIs below $25k, 0.5% for AGIs $25k-50k, 0.7% for AGIs $50k-75k, 0.4% for AGIs $75k-100k, 1.0% for AGIs $100k-200k)
Net capital gain/loss in AGI: +$800 (reported on 9.6% of returns)
Here:
+$800
State:
+$14,495
(% of AGI for various income ranges: 0.4% for AGIs $50k-75k, 0.3% for AGIs $100k-200k)
Profit/loss from business: +$8,100 (reported on 8.9% of returns)
Here:
+$8,100
State:
+$16,268
(% of AGI for various income ranges: 3.5% for AGIs below $25k, 2.4% for AGIs $25k-50k, 1.3% for AGIs $50k-75k, 2.8% for AGIs $75k-100k)
Taxable individual retirement arrangement distribution: $8,933 (reported on 10.3% of returns)
18250:
$8,933
Pennsylvania:
$14,550
(% of AGI for various income ranges: 3.6% for AGIs below $25k, 1.2% for AGIs $25k-50k, 2.2% for AGIs $50k-75k, 5.7% for AGIs $75k-100k)
Total itemized deductions: $16,090 (21% of AGI, reported on 19.9% of returns)
Here:
$16,090
State:
$23,538
Here:
20.8% of AGI
State:
18.4% of AGI
(% of AGI for various income ranges: 8.3% for AGIs $25k-50k, 7.4% for AGIs $50k-75k, 7.6% for AGIs $75k-100k, 10.4% for AGIs $100k-200k)
Charity contributions: $2,514 (reported on 14.4% of returns)
Here:
$2,514
State:
$4,025
(% of AGI for various income ranges: 0.8% for AGIs $25k-50k, 0.7% for AGIs $50k-75k, 0.8% for AGIs $75k-100k, 1.4% for AGIs $100k-200k)
Taxes paid: $7,011 (reported on 19.2% of returns)
18250:
$7,011
State:
$9,982
(% of AGI for various income ranges: 2.6% for AGIs $25k-50k, 2.8% for AGIs $50k-75k, 3.4% for AGIs $75k-100k, 5.3% for AGIs $100k-200k)
Earned income credit: $2,124 (reported on 17.1% of returns)
Here:
$2,124
State:
$2,106
(% of AGI for various income ranges: 5.7% for AGIs below $25k, 1.0% for AGIs $25k-50k)
Percentage of individuals using paid preparers for their 2012 taxes: 53.4%
Here:
53%
State:
53%
(% for various income ranges: 50.8% for AGIs below $25k, 48.7% for AGIs $25k-50k, 56.5% for AGIs $50k-75k, 66.7% for AGIs $75k-100k, 63.6% for AGIs $100k-200k)
Averages for the 2004 tax year for zip code 18250, filed in 2005:
Average Adjusted Gross Income (AGI) in 2004: $34,082 (Individual Income Tax Returns)
Here:
$34,082
State:
$48,049
Salary/wage: $33,579 (reported on 81.8% of returns)
Here:
$33,579
State:
$42,646
(% of AGI for various income ranges: 71.2% for AGIs below $10k, 67.8% for AGIs $10k-25k, 81.8% for AGIs $25k-50k, 87.1% for AGIs $50k-75k, 92.9% for AGIs $75k-100k, 66.4% for AGIs over 100k)
Taxable interest for individuals: $1,625 (reported on 46.7% of returns)
This zip code:
$1,625
Pennsylvania:
$1,657
(% of AGI for various income ranges: 6.8% for AGIs below $10k, 4.6% for AGIs $10k-25k, 2.5% for AGIs $25k-50k, 0.9% for AGIs $50k-75k, 1.9% for AGIs $75k-100k, 1.3% for AGIs over 100k)
Taxable dividends: $1,365 (reported on 23.3% of returns)
Here:
$1,365
State:
$3,566
(% of AGI for various income ranges: 3.5% for AGIs below $10k, 1.3% for AGIs $10k-25k, 1.4% for AGIs $25k-50k, 0.2% for AGIs $50k-75k, 0.2% for AGIs $75k-100k, 1.4% for AGIs over 100k)
Net capital gain/loss: +$40 (reported on 12.1% of returns)
Here:
+$40
State:
+$9,716
(% of AGI for various income ranges: 1.9% for AGIs below $10k, -0.2% for AGIs $10k-25k, -0.2% for AGIs $25k-50k, 0.1% for AGIs $50k-75k, -0.1% for AGIs $75k-100k, 0.1% for AGIs over 100k)
Profit/loss from business: +$6,444 (reported on 9.1% of returns)
Here:
+$6,444
State:
+$14,267
(% of AGI for various income ranges: 7.9% for AGIs below $10k, 3.5% for AGIs $10k-25k, 0.8% for AGIs $25k-50k, 0.5% for AGIs $50k-75k, 4.8% for AGIs over 100k)
IRA payment deduction: $2,265 (reported on 2.3% of returns)
18250:
$2,265
Pennsylvania:
$2,903
Total itemized deductions: $14,492 (21% of AGI, reported on 16.4% of returns)
Here:
$14,492
State:
$18,804
Here:
20.6% of AGI
State:
19.5% of AGI
(% of AGI for various income ranges: 3.6% for AGIs $10k-25k, 4.7% for AGIs $25k-50k, 7.2% for AGIs $50k-75k, 11.5% for AGIs $75k-100k, 11.0% for AGIs over 100k)
Charity contributions deductions: $2,223 (3% of AGI, reported on 14.7% of returns)
Here:
$2,223
State:
$3,337
Here:
3.0% of AGI
State:
3.3% of AGI
(% of AGI for various income ranges: 0.1% for AGIs $10k-25k, 0.3% for AGIs $25k-50k, 1.1% for AGIs $50k-75k, 1.3% for AGIs $75k-100k, 2.7% for AGIs over 100k)
Total tax: $4,195 (reported on 72.2% of returns)
18250:
$4,195
State:
$8,008
(% of AGI for various income ranges: 2.0% for AGIs below $10k, 3.6% for AGIs $10k-25k, 7.3% for AGIs $25k-50k, 9.1% for AGIs $50k-75k, 10.4% for AGIs $75k-100k, 17.1% for AGIs over 100k)
Earned income credit: $1,721 (reported on 15.0% of returns)
Here:
$1,721
State:
$1,643
Percentage of individuals using paid preparers for their 2004 taxes: 53.8%
Here:
54%
State:
56%
(% for various income ranges: 48.9% for AGIs below $10k, 56.3% for AGIs $10k-25k, 54.3% for AGIs $25k-50k, 54.3% for AGIs $50k-75k, 52.8% for AGIs $75k-100k, 60.9% for AGIs over 100k)
Household received Food Stamps/SNAP in the past 12 months: 306 Household did not receive Food Stamps/SNAP in the past 12 months: 1,023
Women who had a birth in the past 12 months: 95 (36 now married, 53 unmarried) Women who did not have a birth in the past 12 months: 568 (153 now married, 416 unmarried)
Housing units in zip code 18250 with a mortgage: 621 (10 second mortgage, 10 both second mortgage and home equity loan) Houses without a mortgage: 19
Median monthly owner costs for units with a mortgage: $1,138 Median monthly owner costs for units without a mortgage: $544
Residents with income below the poverty level in 2022:
This zip code:
17.5%
Whole state:
11.8%
Residents with income below 50% of the poverty level in 2022:
This zip code:
12.2%
Whole state:
6.1%
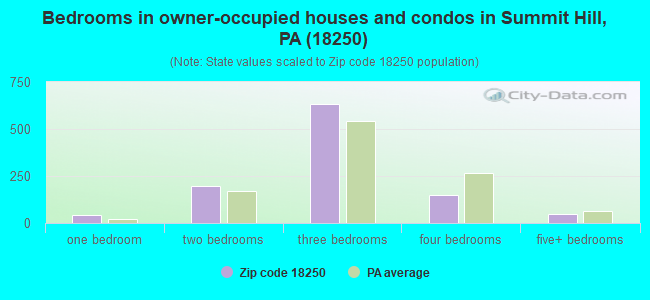
Median number of rooms in houses and condos:
Here:
6.5
State:
6.8
Median number of rooms in apartments:
Here:
6.5
State:
4.3
Notable locations in this zip code not listed on our city pages
In group quarters: 17 (-1 institutionalized population)
Size of family households: 276 2-persons, 169 3-persons, 176 4-persons, 70 5-persons, 10 6-persons
Size of nonfamily households: 320 1-person, 299 2-persons, 11 3-persons
198 married couples with children.
404 single-parent households (212 men, 192 women).
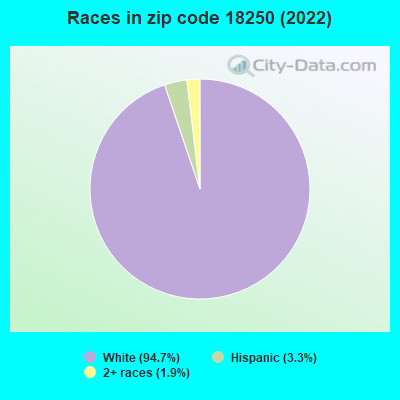
95.3% of residents of 18250 zip code speak English at home.
0.6% of residents speak Spanish at home (100% very well).
3.4% of residents speak other Indo-European language at home (76% very well, 24% well).
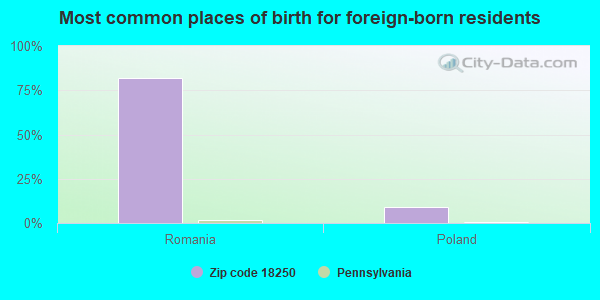
Foreign born population: 11 (0.4%) (100.0% of them are naturalized citizens)
This zip code:
0.4%
Whole state:
7.5%
82%Romania
9%Poland
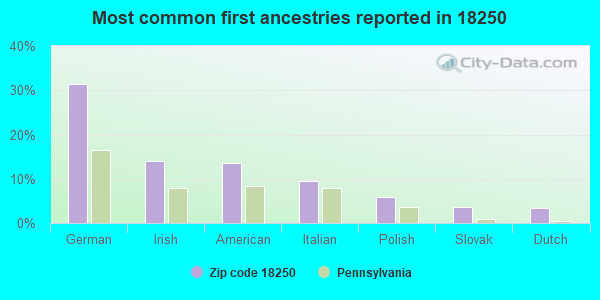
31%German
14%Irish
14%American
9%Italian
6%Polish
4%Slovak
3%Dutch
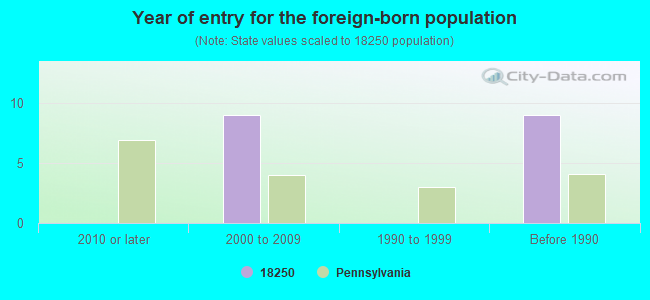
Year of entry for the foreign-born population
02010 or later
92000 to 2009
01990 to 1999
9Before 1990
Housing units lacking complete plumbing facilities: 1.1% Housing units lacking complete kitchen facilities: 3.8%
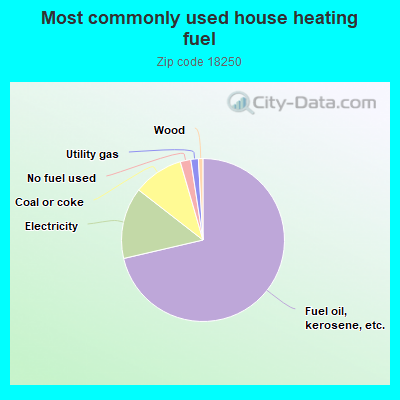
71.5%Fuel oil, kerosene, etc.
14.2%Electricity
10.0%Coal or coke
2.1%No fuel used
1.5%Utility gas
0.9%Wood
Population in 1990: 3,332.
Place of birth for U.S.-born residents:
This state: 2,790
Northeast: 183
Midwest: 66
South: 12
West: 13
73% of the 18250 zip code residents lived in the same house 5 years ago. Out of people who lived in different houses, 58% lived in this county. Out of people who lived in different counties, 50% lived in Pennsylvania.
81% of the 18250 zip code residents lived in the same house 1 year ago. Out of people who lived in different houses, 7% moved from this county. Out of people who lived in different houses, 86% moved from different county within same state. Out of people who lived in different houses, 4% moved from abroad.
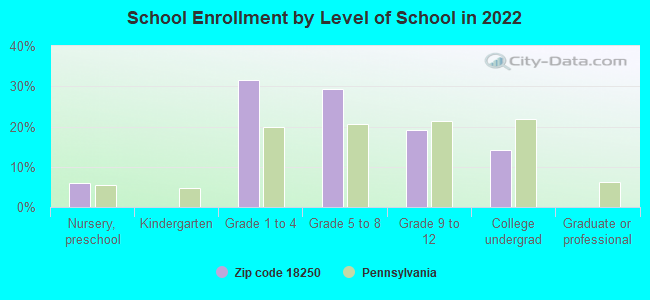
Private vs. public school enrollment:
Students in private schools in grades 1 to 8 (elementary and middle school): 67
Here:
16.0%
Pennsylvania:
15.7%
Students in private schools in grades 9 to 12 (high school):
Here:
0.0%
Pennsylvania:
13.4%
Students in private undergraduate colleges: 18
Here:
18.2%
Pennsylvania:
39.8%
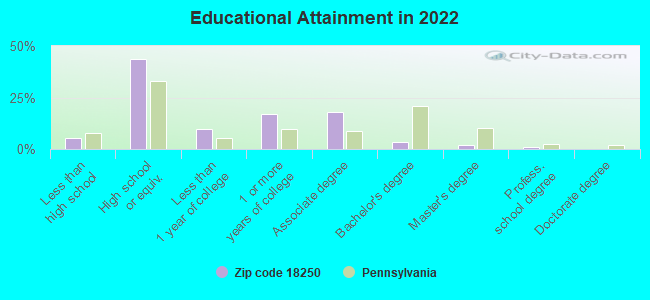
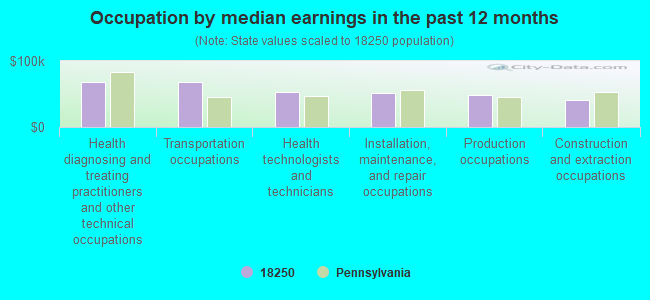
Occupation by median earnings in the past 12 months ($)
68,513Health diagnosing and treating practitioners and other technical occupations
67,864Transportation occupations
53,397Health technologists and technicians
52,001Installation, maintenance, and repair occupations
48,914Production occupations
41,137Construction and extraction occupations
Top industries in this zip code by the number of employees in 2005:
Wholesale Trade: Home Furnishing Merchant Wholesalers (20-49 employees: 1 establishment)
Other Services (except Public Administration): Religious Organizations (5-9: 3, 1-4: 3)
Construction: Plumbing, Heating, and Air-Conditioning Contractors (10-19: 1, 1-4: 1)
Health Care and Social Assistance: Offices of Dentists (10-19: 1, 1-4: 1)
Professional, Scientific, and Technical Services: Offices of Lawyers (5-9: 1, 1-4: 1)
Finance and Insurance: Commercial Banking (5-9: 1)
Accommodation and Food Services: Full-Service Restaurants (5-9: 1)
Construction: Electrical Contractors (1-4: 2)
Health Care and Social Assistance: Services for the Elderly and Persons with Disabilities (1-4: 2)
People in group quarters in 2010:
7 people in nursing facilities/skilled-nursing facilities
People in group quarters in 2000:
8 people in homes for the mentally retarded
Fatal accident statistics in 2013:
Fatal accident count: 1
Vehicles involved in fatal accidents: 1
Fatal accidents caused by drunken drivers: 0
Fatalities: 1
Persons involved in fatal accidents: 1
Pedestrians involved in fatal accidents: 1
Fatal accident statistics in 2012:
Fatal accident count: 1
Vehicles involved in fatal accidents: 1
Fatal accidents caused by drunken drivers: 0
Fatalities: 1
Persons involved in fatal accidents: 1
Pedestrians involved in fatal accidents: 0
Home Mortgage Disclosure Act Aggregated Statistics For Year 2009 (Based on 2 partial tracts)
A) FHA, FSA/RHS & VA Home Purchase Loans
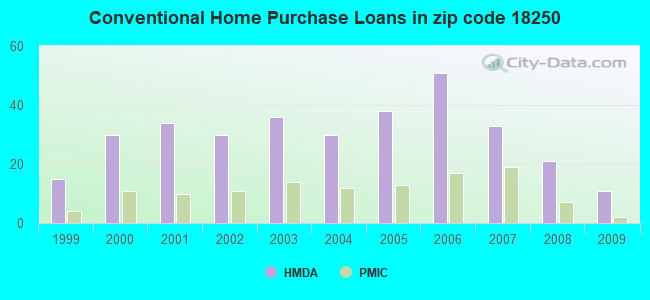
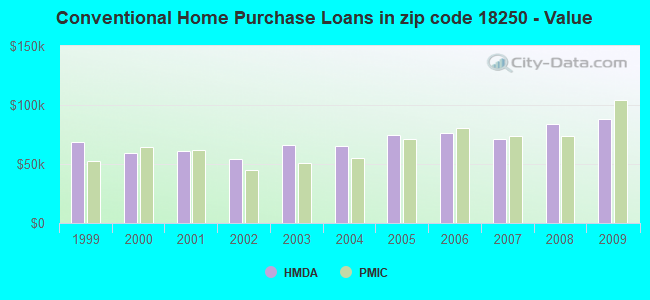
B) Conventional Home Purchase Loans
C) Refinancings
D) Home Improvement Loans
F) Non-occupant Loans on < 5 Family Dwellings (A B C & D)
Number
Average Value
Number
Average Value
Number
Average Value
Number
Average Value
Number
Average Value
LOANS ORIGINATED
19
$73,288
11
$88,023
44
$85,345
10
$17,774
5
$120,982
APPLICATIONS APPROVED, NOT ACCEPTED
0
$0
0
$0
2
$103,845
1
$25,530
1
$24,550
APPLICATIONS DENIED
1
$85,920
2
$49,100
18
$118,249
6
$28,397
1
$207,690
APPLICATIONS WITHDRAWN
2
$94,520
1
$130,610
12
$112,152
1
$28,970
1
$303,440
FILES CLOSED FOR INCOMPLETENESS
0
$0
0
$0
2
$189,770
1
$66,280
1
$136,500
Aggregated Statistics For Year 2008 (Based on 2 partial tracts)
A) FHA, FSA/RHS & VA Home Purchase Loans
B) Conventional Home Purchase Loans
C) Refinancings
D) Home Improvement Loans
F) Non-occupant Loans on < 5 Family Dwellings (A B C & D)
Number
Average Value
Number
Average Value
Number
Average Value
Number
Average Value
Number
Average Value
LOANS ORIGINATED
12
$83,675
21
$84,289
36
$89,076
15
$29,362
10
$84,599
APPLICATIONS APPROVED, NOT ACCEPTED
0
$0
2
$133,305
10
$106,743
3
$15,877
1
$170,870
APPLICATIONS DENIED
2
$82,240
5
$134,534
40
$101,563
9
$18,386
2
$63,340
APPLICATIONS WITHDRAWN
1
$54,990
1
$100,660
12
$99,632
3
$57,773
1
$90,830
FILES CLOSED FOR INCOMPLETENESS
0
$0
1
$59,410
1
$69,720
0
$0
0
$0
Aggregated Statistics For Year 2007 (Based on 2 partial tracts)
A) FHA, FSA/RHS & VA Home Purchase Loans
B) Conventional Home Purchase Loans
C) Refinancings
D) Home Improvement Loans
E) Loans on Dwellings For 5+ Families
F) Non-occupant Loans on < 5 Family Dwellings (A B C & D)
Number
Average Value
Number
Average Value
Number
Average Value
Number
Average Value
Number
Average Value
Number
Average Value
LOANS ORIGINATED
7
$76,246
33
$71,478
40
$88,024
27
$32,824
1
$210,150
11
$76,195
APPLICATIONS APPROVED, NOT ACCEPTED
0
$0
3
$101,147
8
$88,380
1
$61,380
0
$0
2
$71,195
APPLICATIONS DENIED
1
$77,090
13
$320,661
55
$94,299
21
$42,343
0
$0
7
$74,001
APPLICATIONS WITHDRAWN
0
$0
4
$78,928
14
$106,441
1
$26,020
0
$0
1
$59,900
FILES CLOSED FOR INCOMPLETENESS
0
$0
3
$78,397
7
$241,151
1
$19,150
0
$0
0
$0
Aggregated Statistics For Year 2006 (Based on 2 partial tracts)
A) FHA, FSA/RHS & VA Home Purchase Loans
B) Conventional Home Purchase Loans
C) Refinancings
D) Home Improvement Loans
F) Non-occupant Loans on < 5 Family Dwellings (A B C & D)
G) Loans On Manufactured Home Dwelling (A B C & D)
Number
Average Value
Number
Average Value
Number
Average Value
Number
Average Value
Number
Average Value
Number
Average Value
LOANS ORIGINATED
4
$60,392
51
$76,317
45
$76,378
31
$21,572
14
$78,420
0
$0
APPLICATIONS APPROVED, NOT ACCEPTED
0
$0
6
$65,712
12
$105,974
4
$19,395
2
$35,350
0
$0
APPLICATIONS DENIED
1
$97,220
16
$83,685
60
$82,120
32
$44,037
7
$108,441
1
$29,950
APPLICATIONS WITHDRAWN
1
$72,670
6
$74,468
28
$99,761
2
$23,320
1
$108,020
0
$0
FILES CLOSED FOR INCOMPLETENESS
0
$0
2
$101,880
4
$119,312
1
$70,210
1
$87,890
0
$0
Aggregated Statistics For Year 2005 (Based on 2 partial tracts)
A) FHA, FSA/RHS & VA Home Purchase Loans
B) Conventional Home Purchase Loans
C) Refinancings
D) Home Improvement Loans
F) Non-occupant Loans on < 5 Family Dwellings (A B C & D)
G) Loans On Manufactured Home Dwelling (A B C & D)
Number
Average Value
Number
Average Value
Number
Average Value
Number
Average Value
Number
Average Value
Number
Average Value
LOANS ORIGINATED
4
$68,862
38
$74,425
68
$65,000
21
$26,888
13
$63,490
1
$48,120
APPLICATIONS APPROVED, NOT ACCEPTED
0
$0
3
$54,337
8
$63,339
1
$19,640
1
$48,610
0
$0
APPLICATIONS DENIED
0
$0
12
$57,979
47
$86,291
15
$34,763
3
$33,717
0
$0
APPLICATIONS WITHDRAWN
0
$0
4
$56,588
34
$94,402
3
$78,397
0
$0
0
$0
FILES CLOSED FOR INCOMPLETENESS
0
$0
0
$0
6
$96,072
0
$0
0
$0
0
$0
Aggregated Statistics For Year 2004 (Based on 2 partial tracts)
A) FHA, FSA/RHS & VA Home Purchase Loans
B) Conventional Home Purchase Loans
C) Refinancings
D) Home Improvement Loans
F) Non-occupant Loans on < 5 Family Dwellings (A B C & D)
G) Loans On Manufactured Home Dwelling (A B C & D)
Number
Average Value
Number
Average Value
Number
Average Value
Number
Average Value
Number
Average Value
Number
Average Value
LOANS ORIGINATED
7
$63,199
30
$65,516
56
$66,022
15
$31,227
9
$38,134
0
$0
APPLICATIONS APPROVED, NOT ACCEPTED
0
$0
5
$97,512
11
$78,962
1
$39,770
2
$59,900
0
$0
APPLICATIONS DENIED
0
$0
11
$68,472
48
$71,011
14
$47,276
4
$32,653
1
$44,190
APPLICATIONS WITHDRAWN
0
$0
5
$65,302
32
$79,204
2
$20,865
2
$49,345
0
$0
FILES CLOSED FOR INCOMPLETENESS
0
$0
0
$0
6
$88,380
1
$61,380
1
$76,110
0
$0
Aggregated Statistics For Year 2003 (Based on 2 partial tracts)
A) FHA, FSA/RHS & VA Home Purchase Loans
B) Conventional Home Purchase Loans
C) Refinancings
D) Home Improvement Loans
F) Non-occupant Loans on < 5 Family Dwellings (A B C & D)
Number
Average Value
Number
Average Value
Number
Average Value
Number
Average Value
Number
Average Value
LOANS ORIGINATED
5
$52,144
36
$65,780
103
$61,175
26
$24,777
13
$61,337
APPLICATIONS APPROVED, NOT ACCEPTED
0
$0
4
$55,360
19
$86,132
0
$0
2
$28,230
APPLICATIONS DENIED
1
$34,860
11
$53,206
61
$69,875
6
$24,632
1
$66,780
APPLICATIONS WITHDRAWN
0
$0
4
$54,992
32
$69,369
1
$27,500
0
$0
FILES CLOSED FOR INCOMPLETENESS
0
$0
1
$62,850
4
$120,662
0
$0
0
$0
Aggregated Statistics For Year 2002 (Based on 2 partial tracts)
A) FHA, FSA/RHS & VA Home Purchase Loans
B) Conventional Home Purchase Loans
C) Refinancings
D) Home Improvement Loans
F) Non-occupant Loans on < 5 Family Dwellings (A B C & D)
Number
Average Value
Number
Average Value
Number
Average Value
Number
Average Value
Number
Average Value
LOANS ORIGINATED
2
$39,525
30
$54,583
65
$61,398
28
$19,465
12
$48,732
APPLICATIONS APPROVED, NOT ACCEPTED
0
$0
2
$45,910
19
$55,664
4
$21,235
2
$43,210
APPLICATIONS DENIED
0
$0
11
$39,637
45
$62,270
11
$28,389
1
$70,700
APPLICATIONS WITHDRAWN
0
$0
2
$29,705
29
$66,370
1
$70,700
0
$0
FILES CLOSED FOR INCOMPLETENESS
0
$0
1
$18,170
2
$65,795
0
$0
0
$0
Aggregated Statistics For Year 2001 (Based on 2 partial tracts)
A) FHA, FSA/RHS & VA Home Purchase Loans
B) Conventional Home Purchase Loans
C) Refinancings
D) Home Improvement Loans
E) Loans on Dwellings For 5+ Families
F) Non-occupant Loans on < 5 Family Dwellings (A B C & D)
Number
Average Value
Number
Average Value
Number
Average Value
Number
Average Value
Number
Average Value
Number
Average Value
LOANS ORIGINATED
7
$61,304
34
$61,086
42
$61,983
18
$13,993
0
$0
8
$73,528
APPLICATIONS APPROVED, NOT ACCEPTED
0
$0
2
$85,925
12
$60,229
2
$53,765
0
$0
1
$125,700
APPLICATIONS DENIED
0
$0
7
$37,737
51
$50,795
10
$17,676
1
$57,450
3
$34,043
APPLICATIONS WITHDRAWN
0
$0
2
$73,405
17
$64,956
3
$27,660
0
$0
1
$145,340
FILES CLOSED FOR INCOMPLETENESS
0
$0
0
$0
3
$79,377
0
$0
0
$0
0
$0
Aggregated Statistics For Year 2000 (Based on 2 partial tracts)
A) FHA, FSA/RHS & VA Home Purchase Loans
B) Conventional Home Purchase Loans
C) Refinancings
D) Home Improvement Loans
F) Non-occupant Loans on < 5 Family Dwellings (A B C & D)
Number
Average Value
Number
Average Value
Number
Average Value
Number
Average Value
Number
Average Value
LOANS ORIGINATED
7
$44,190
30
$59,673
23
$57,703
17
$12,304
4
$54,500
APPLICATIONS APPROVED, NOT ACCEPTED
0
$0
4
$45,050
8
$48,364
1
$37,810
0
$0
APPLICATIONS DENIED
0
$0
8
$42,165
34
$46,399
9
$22,477
1
$88,380
APPLICATIONS WITHDRAWN
0
$0
7
$45,031
16
$59,718
2
$16,695
0
$0
FILES CLOSED FOR INCOMPLETENESS
0
$0
1
$88,380
6
$65,793
0
$0
0
$0
Aggregated Statistics For Year 1999 (Based on 1 partial tract)
A) FHA, FSA/RHS & VA Home Purchase Loans
B) Conventional Home Purchase Loans
C) Refinancings
D) Home Improvement Loans
F) Non-occupant Loans on < 5 Family Dwellings (A B C & D)

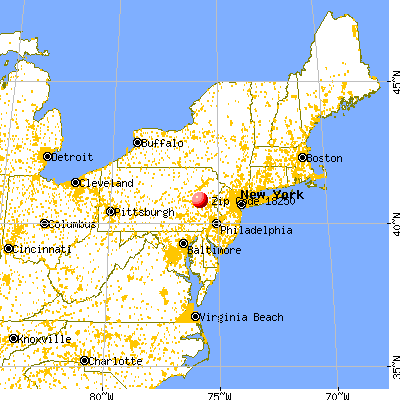


 Nearest zip codes: 18232, 18240, 18218, 18211, 18255, 18216.