Estimated zip code population in 2022: 3,895 Zip code population in 2010: 3,891 Zip code population in 2000: 3,898
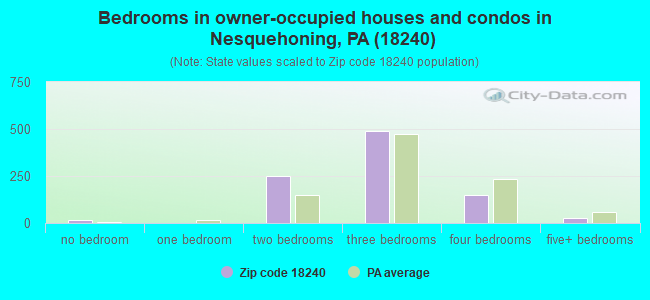
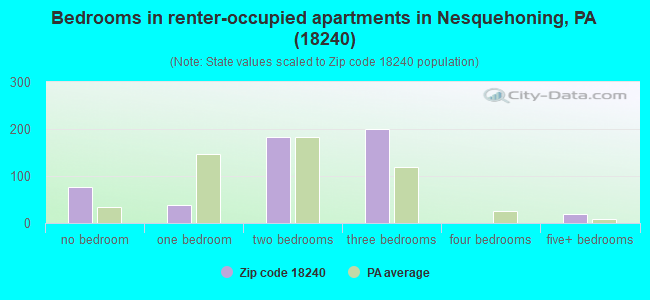
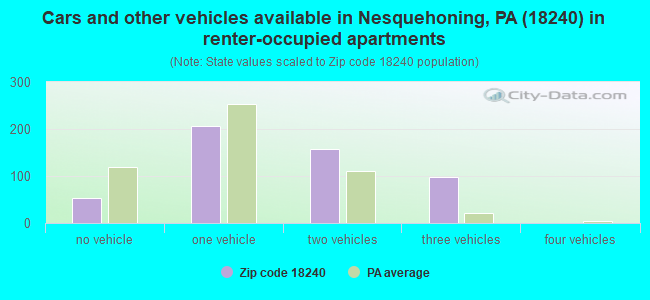
Houses and condos: 1,798 Renter-occupied apartments: 516
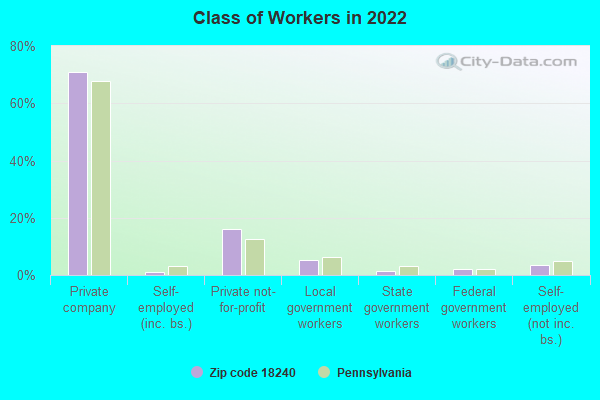
% of renters here:
36%
State:
31%
March 2022 cost of living index in zip code 18240: 91.4 (less than average, U.S. average is 100)
Land area: 29.5 sq. mi. Water area: 1.3 sq. mi.
Population density: 132 people per square mile
(very low).
OSM Map
General Map
Google Map
MSN Map
OSM Map
General Map
Google Map
MSN Map
OSM Map
General Map
Google Map
MSN Map
OSM Map
General Map
Google Map
MSN Map
Please wait while loading the map...
Real estate property taxes paid for housing units in 2022:
This zip code:
2.3% ($3,038)
Pennsylvania:
1.3% ($3,094)
Median real estate property taxes paid for housing units with mortgages in 2022: $2,602 (2.2%) Median real estate property taxes paid for housing units with no mortgage in 2022: $3,439 (2.3%)
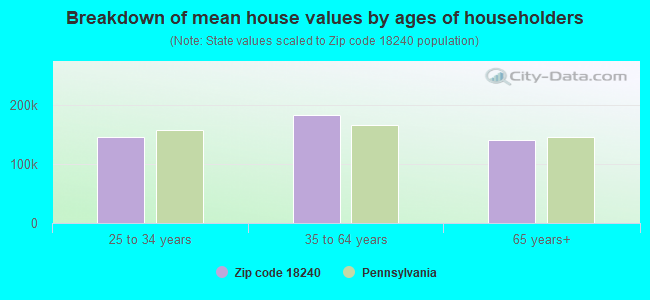
Estimated median house/condo value in 2022: $134,471
18240:
$134,471
Pennsylvania:
$245,500
According to our research of Pennsylvania and other state lists, there were 9 registered sex offenders living in 18240 zip code as of April 28, 2024. The ratio of all residents to sex offenders in zip code 18240 is 429 to 1.
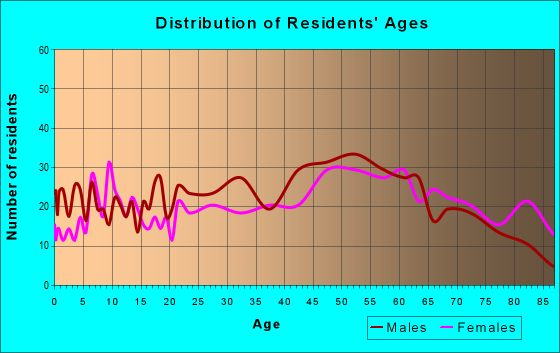
Median resident age:
This zip code:
38.9 years
Pennsylvania median age:
40.9 years
Average household size:
This zip code:
2.5 people
Pennsylvania:
2.4 people
Averages for the 2020 tax year for zip code 18240, filed in 2021:
Average Adjusted Gross Income (AGI) in 2020: $56,327 (Individual Income Tax Returns)
Here:
$56,327
State:
$75,707
Salary/wage: $47,617 (reported on 75.8% of returns)
Here:
$47,617
State:
$62,806
(% of AGI for various income ranges: 920.9% for AGIs below $25k, 3317.2% for AGIs $25k-50k, 5423.5% for AGIs $50k-75k, 8376.7% for AGIs $75k-100k, 14472.9% for AGIs $100k-200k)
Taxable interest for individuals: $1,461 (reported on 30.8% of returns)
This zip code:
$1,461
Pennsylvania:
$1,633
(% of AGI for various income ranges: 30.9% for AGIs below $25k, 28.6% for AGIs $25k-50k, 24.3% for AGIs $50k-75k, 52.5% for AGIs $75k-100k, 172.1% for AGIs $100k-200k)
Ordinary dividends: $5,000 (reported on 21.4% of returns)
Here:
$5,000
State:
$7,382
(% of AGI for various income ranges: 38.0% for AGIs below $25k, 55.0% for AGIs $25k-50k, 63.0% for AGIs $50k-75k, 110.8% for AGIs $75k-100k, 465.7% for AGIs $100k-200k)
Net capital gain/loss in AGI: +$16,281 (reported on 17.0% of returns)
Here:
+$16,281
State:
+$23,522
(% of AGI for various income ranges: 12.5% for AGIs below $25k, 31.9% for AGIs $25k-50k, 47.0% for AGIs $50k-75k, 64.2% for AGIs $75k-100k, 471.4% for AGIs $100k-200k)
Profit/loss from business: +$14,833 (reported on 8.2% of returns)
Here:
+$14,833
State:
+$16,274
(% of AGI for various income ranges: 28.9% for AGIs below $25k, 70.6% for AGIs $25k-50k, 103.9% for AGIs $50k-75k, 1146.4% for AGIs $100k-200k)
Taxable individual retirement arrangement distribution: $16,475 (reported on 13.2% of returns)
18240:
$16,475
Pennsylvania:
$18,583
(% of AGI for various income ranges: 74.3% for AGIs below $25k, 131.4% for AGIs $25k-50k, 254.8% for AGIs $50k-75k, 390.8% for AGIs $75k-100k, 1499.3% for AGIs $100k-200k)
Total itemized deductions: $28,500 (reported on 3.8% of returns)
Here:
$28,500
State:
$34,850
(% of AGI for various income ranges: 469.6% for AGIs $50k-75k, 653.6% for AGIs $100k-200k)
Charity contributions: $3,200 (reported on 3.3% of returns)
Here:
$3,200
State:
$12,392
(% of AGI for various income ranges: 27.8% for AGIs $50k-75k, 91.4% for AGIs $100k-200k)
Taxes paid: $8,057 (reported on 3.8% of returns)
18240:
$8,057
State:
$8,200
(% of AGI for various income ranges: 124.8% for AGIs $50k-75k, 197.9% for AGIs $100k-200k)
Earned income credit: $2,265 (reported on 14.3% of returns)
Here:
$2,265
State:
$2,100
(% of AGI for various income ranges: 83.0% for AGIs below $25k, 62.2% for AGIs $25k-50k)
Percentage of individuals using paid preparers for their 2020 taxes: 94.0%
Here:
94%
State:
92%
(% for various income ranges: 93.8% for AGIs below $25k, 95.7% for AGIs $25k-50k, 96.6% for AGIs $50k-75k, 94.1% for AGIs $75k-100k, 90.9% for AGIs $100k-200k, 75.0% for AGIs over 200k)
Averages for the 2012 tax year for zip code 18240, filed in 2013:
Average Adjusted Gross Income (AGI) in 2012: $46,368 (Individual Income Tax Returns)
Here:
$46,368
State:
$61,346
Salary/wage: $41,818 (reported on 77.4% of returns)
Here:
$41,818
State:
$51,902
(% of AGI for various income ranges: 59.7% for AGIs below $25k, 76.2% for AGIs $25k-50k, 73.4% for AGIs $50k-75k, 77.9% for AGIs $75k-100k, 62.7% for AGIs $100k-200k)
Taxable interest for individuals: $1,459 (reported on 35.6% of returns)
This zip code:
$1,459
Pennsylvania:
$1,588
(% of AGI for various income ranges: 2.6% for AGIs below $25k, 1.2% for AGIs $25k-50k, 0.8% for AGIs $50k-75k, 0.9% for AGIs $75k-100k, 0.9% for AGIs $100k-200k)
Ordinary dividends: $2,911 (reported on 26.0% of returns)
Here:
$2,911
State:
$5,827
(% of AGI for various income ranges: 3.6% for AGIs below $25k, 0.7% for AGIs $25k-50k, 1.4% for AGIs $50k-75k, 0.7% for AGIs $75k-100k, 2.2% for AGIs $100k-200k)
Net capital gain/loss in AGI: +$4,023 (reported on 14.7% of returns)
Here:
+$4,023
State:
+$14,495
(% of AGI for various income ranges: 0.7% for AGIs below $25k, 3.7% for AGIs $100k-200k)
Profit/loss from business: +$11,829 (reported on 7.9% of returns)
Here:
+$11,829
State:
+$16,268
(% of AGI for various income ranges: 3.2% for AGIs below $25k, 1.3% for AGIs $25k-50k, 3.8% for AGIs $50k-75k, 2.1% for AGIs $100k-200k)
Taxable individual retirement arrangement distribution: $10,495 (reported on 11.3% of returns)
18240:
$10,495
Pennsylvania:
$14,550
(% of AGI for various income ranges: 3.2% for AGIs below $25k, 2.5% for AGIs $25k-50k, 2.6% for AGIs $50k-75k, 2.5% for AGIs $75k-100k, 2.4% for AGIs $100k-200k)
Total itemized deductions: $19,474 (20% of AGI, reported on 21.5% of returns)
Here:
$19,474
State:
$23,538
Here:
20.4% of AGI
State:
18.4% of AGI
(% of AGI for various income ranges: 7.3% for AGIs below $25k, 6.9% for AGIs $25k-50k, 9.1% for AGIs $50k-75k, 8.9% for AGIs $75k-100k, 10.8% for AGIs $100k-200k)
Charity contributions: $2,166 (reported on 18.1% of returns)
Here:
$2,166
State:
$4,025
(% of AGI for various income ranges: 0.4% for AGIs below $25k, 0.5% for AGIs $25k-50k, 0.9% for AGIs $50k-75k, 0.7% for AGIs $75k-100k, 1.2% for AGIs $100k-200k)
Taxes paid: $7,795 (reported on 21.5% of returns)
18240:
$7,795
State:
$9,982
(% of AGI for various income ranges: 1.4% for AGIs below $25k, 2.4% for AGIs $25k-50k, 3.1% for AGIs $50k-75k, 3.6% for AGIs $75k-100k, 5.3% for AGIs $100k-200k)
Earned income credit: $1,985 (reported on 14.7% of returns)
Here:
$1,985
State:
$2,106
(% of AGI for various income ranges: 4.7% for AGIs below $25k, 0.8% for AGIs $25k-50k)
Percentage of individuals using paid preparers for their 2012 taxes: 52.5%
Here:
53%
State:
53%
(% for various income ranges: 49.3% for AGIs below $25k, 47.8% for AGIs $25k-50k, 59.3% for AGIs $50k-75k, 50.0% for AGIs $75k-100k, 70.6% for AGIs $100k-200k)
Averages for the 2004 tax year for zip code 18240, filed in 2005:
Average Adjusted Gross Income (AGI) in 2004: $38,841 (Individual Income Tax Returns)
Here:
$38,841
State:
$48,049
Salary/wage: $34,744 (reported on 79.4% of returns)
Here:
$34,744
State:
$42,646
(% of AGI for various income ranges: 74.0% for AGIs below $10k, 63.2% for AGIs $10k-25k, 79.3% for AGIs $25k-50k, 80.0% for AGIs $50k-75k, 84.3% for AGIs $75k-100k, 48.0% for AGIs over 100k)
Taxable interest for individuals: $1,857 (reported on 49.4% of returns)
This zip code:
$1,857
Pennsylvania:
$1,657
(% of AGI for various income ranges: 7.4% for AGIs below $10k, 3.9% for AGIs $10k-25k, 2.6% for AGIs $25k-50k, 1.6% for AGIs $50k-75k, 1.8% for AGIs $75k-100k, 2.0% for AGIs over 100k)
Taxable dividends: $2,547 (reported on 28.2% of returns)
Here:
$2,547
State:
$3,566
(% of AGI for various income ranges: 5.1% for AGIs below $10k, 1.9% for AGIs $10k-25k, 1.1% for AGIs $25k-50k, 1.3% for AGIs $50k-75k, 1.2% for AGIs $75k-100k, 3.2% for AGIs over 100k)
Net capital gain/loss: +$10,850 (reported on 18.5% of returns)
Here:
+$10,850
State:
+$9,716
(% of AGI for various income ranges: -3.1% for AGIs below $10k, 0.4% for AGIs $10k-25k, -0.1% for AGIs $25k-50k, 0.0% for AGIs $50k-75k, 0.9% for AGIs $75k-100k, 22.1% for AGIs over 100k)
Profit/loss from business: +$9,099 (reported on 8.8% of returns)
Here:
+$9,099
State:
+$14,267
(% of AGI for various income ranges: 6.1% for AGIs below $10k, 3.2% for AGIs $10k-25k, 1.6% for AGIs $25k-50k, 2.0% for AGIs $50k-75k, -0.3% for AGIs $75k-100k, 3.3% for AGIs over 100k)
IRA payment deduction: $3,062 (reported on 2.6% of returns)
18240:
$3,062
Pennsylvania:
$2,903
Total itemized deductions: $15,187 (20% of AGI, reported on 22.0% of returns)
Here:
$15,187
State:
$18,804
Here:
19.6% of AGI
State:
19.5% of AGI
(% of AGI for various income ranges: 8.1% for AGIs $10k-25k, 6.8% for AGIs $25k-50k, 8.4% for AGIs $50k-75k, 11.4% for AGIs $75k-100k, 9.8% for AGIs over 100k)
Charity contributions deductions: $2,240 (3% of AGI, reported on 19.8% of returns)
Here:
$2,240
State:
$3,337
Here:
2.7% of AGI
State:
3.3% of AGI
(% of AGI for various income ranges: 0.8% for AGIs $10k-25k, 0.5% for AGIs $25k-50k, 1.0% for AGIs $50k-75k, 1.5% for AGIs $75k-100k, 2.0% for AGIs over 100k)
Total tax: $5,335 (reported on 74.7% of returns)
18240:
$5,335
State:
$8,008
(% of AGI for various income ranges: 1.8% for AGIs below $10k, 4.0% for AGIs $10k-25k, 7.5% for AGIs $25k-50k, 9.5% for AGIs $50k-75k, 10.4% for AGIs $75k-100k, 17.9% for AGIs over 100k)
Earned income credit: $1,594 (reported on 13.3% of returns)
Here:
$1,594
State:
$1,643
Percentage of individuals using paid preparers for their 2004 taxes: 51.9%
Here:
52%
State:
56%
(% for various income ranges: 47.4% for AGIs below $10k, 54.1% for AGIs $10k-25k, 46.4% for AGIs $25k-50k, 55.0% for AGIs $50k-75k, 55.0% for AGIs $75k-100k, 76.2% for AGIs over 100k)
Household received Food Stamps/SNAP in the past 12 months: 392 Household did not receive Food Stamps/SNAP in the past 12 months: 1,068
Women who had a birth in the past 12 months: 74 (79 now married, 0 unmarried) Women who did not have a birth in the past 12 months: 634 (205 now married, 430 unmarried)
Housing units in zip code 18240 with a mortgage: 451 (54 second mortgage, 54 both second mortgage and home equity loan) Houses without a mortgage: 17
Median monthly owner costs for units with a mortgage: $1,052 Median monthly owner costs for units without a mortgage: $630
Residents with income below the poverty level in 2022:
This zip code:
14.2%
Whole state:
11.8%
Residents with income below 50% of the poverty level in 2022:
This zip code:
9.3%
Whole state:
6.1%
Median number of rooms in houses and condos:
Here:
7.0
State:
6.8
Median number of rooms in apartments:
Here:
4.6
State:
4.3
Notable locations in this zip code not listed on our city pages
Notable locations in zip code 18240: Hauto Station (A), Lake Hauto (B), Nesquehoning Hose Company 1 (C), New Columbus Fire Company (D), Hauto Volunteer Fire Company (E). Display/hide their locations on the map
Reservoirs and swamps: Greenwood Lake (A), Bear Creek Reservoir (B), Broad Run Reservoir (C), Hauto Dam (D), Still Creek Reservoir (E), Hughes Swamp (F). Display/hide their locations on the map
Streams, rivers, and creeks: Jeans Run (A), Nesquehoning Creek (B), Swartz Run (C), Grassy Meadow Run (D), Dennison Run (E), Deep Run (F), Broad Run (G), Bear Creek (H). Display/hide their locations on the map
In group quarters: 229 (-1 institutionalized population)
Size of family households: 411 2-persons, 258 3-persons, 76 4-persons, 166 5-persons, 18 7-or-more-persons
Size of nonfamily households: 365 1-person, 101 2-persons, 55 5-persons
486 married couples with children.
164 single-parent households (82 men, 82 women).
96.3% of residents of 18240 zip code speak English at home.
2.7% of residents speak Spanish at home (100% very well).
0.1% of residents speak other Indo-European language at home (100% very well).
0.4% of residents speak Asian or Pacific Island language at home (100% well).
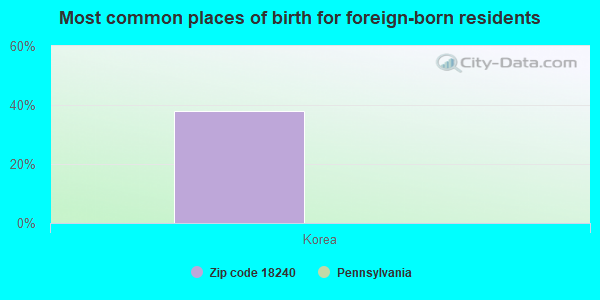
Foreign born population: 43 (1.1%) (100.0% of them are naturalized citizens)
This zip code:
1.1%
Whole state:
7.5%
38%Korea
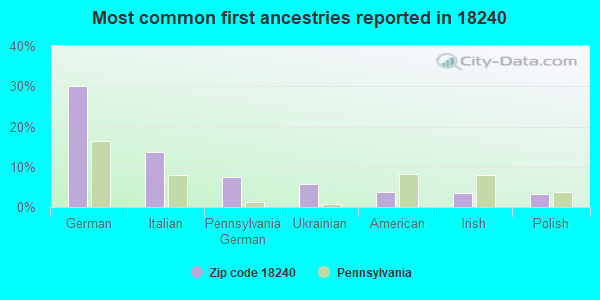
30%German
14%Italian
8%Pennsylvania German
6%Ukrainian
4%American
3%Irish
3%Polish
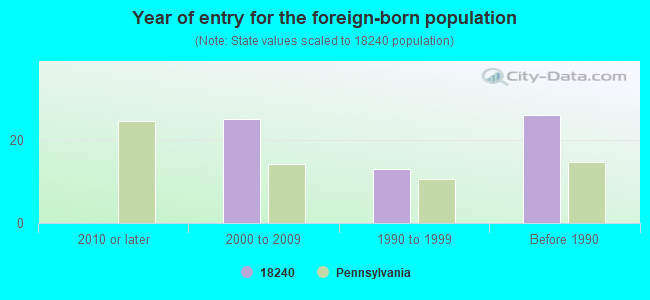
Year of entry for the foreign-born population
02010 or later
252000 to 2009
131990 to 1999
26Before 1990
Facilities with environmental interests located in this zip code:
AMETEK WESTCHESTER PLASTICS DIV (ROUTE 54 AND MOUTAIN AVENUE in NESQUEHONING, PA)
AIR SYNTHETIC MINOR (AIRS/AFS) COMPLIANCE ACTIVITY (Tracking inspections of insecticide, fungicide, and rodenticide, and toxic substances) CRITERIA AND HAZARDOUS AIR POLLUTANT INVENTORY (Inventory of air pollution sources) STATE MASTER (Pennsylvania database) - AFS-512956, AIR PROGRAM, PCS-PA0060747, National Pollutant Discharge Elimination System Permit, AFS-14-1682544-4, AIR PROGRAM, RCRIS-PAD073652422, HAZARDOUS WASTE PROGRAM National Pollutant Discharge Elimination System NON-MAJOR (Tracking pollutant discharge elimination systems) - permit HAZARDOUS WASTE BIENNIAL REPORTER (Resource Conservation and Recovery Act (tracking hazardous waste)) Small Quantity Generators, between 100 kg and 1000 kg of hazardous waste/month (Resource Conservation and Recovery Act (tracking hazardous waste)) Business SIC classification: PLASTICS MATERIALS, SYNTHETIC RESINS, AND NONVULCANIZABLE ELASTOMERS; CUSTOM COMPOUNDING OF PURCHASED PLASTICS RESINS Organizations: OPERNAME (CONTACT/OPERATOR)
Alternative names: AMETEK WEST CHESTER PLASTICS D, AMETEK WESTCHESTER PLASTICS DIVISION GREEN ACRES INDUSTRIAL PARK, AMETEK - WESTMINISTER PLASTICS DIVISION
AMETEK CHEMICAL PRODUCTS DIV (42 MOUNTAIN AVE in NESQUEHONING, PA)
TRI REPORTER (Tracking of toxic chemicals releasing facilities) Business SIC classification: CUSTOM COMPOUNDING OF PURCHASED PLASTICS RESINS Alternative names: AMETEK WESTCHESTER PLASTICS
Housing units lacking complete plumbing facilities: 2.0% Housing units lacking complete kitchen facilities: 7.5%
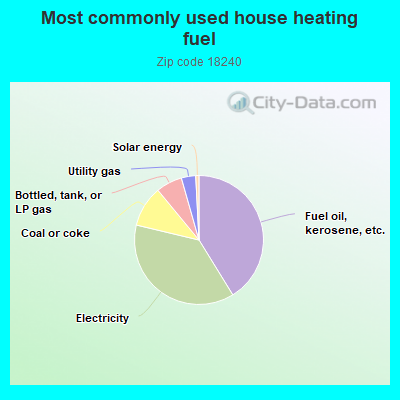
41.3%Fuel oil, kerosene, etc.
37.6%Electricity
10.3%Coal or coke
6.6%Bottled, tank, or LP gas
3.6%Utility gas
0.8%Solar energy
Population in 1990: 3,364. Population change in the 1990s: +534 (+15.9%).
Place of birth for U.S.-born residents:
This state: 3,178
Northeast: 431
Midwest: 15
South: 175
West: 4
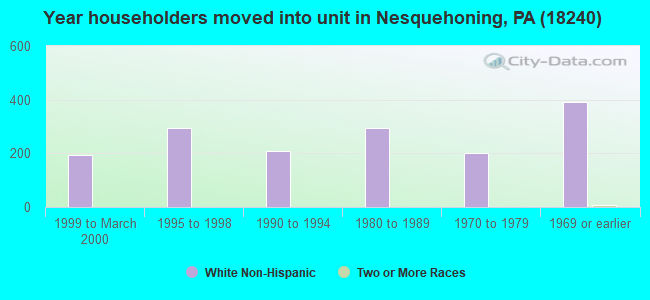
68% of the 18240 zip code residents lived in the same house 5 years ago. Out of people who lived in different houses, 75% lived in this county. Out of people who lived in different counties, 50% lived in Pennsylvania.
82% of the 18240 zip code residents lived in the same house 1 year ago. Out of people who lived in different houses, 54% moved from this county. Out of people who lived in different houses, 28% moved from different county within same state. Out of people who lived in different houses, 14% moved from different state.
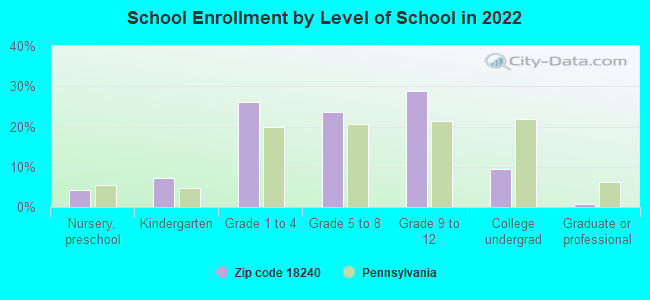
Private vs. public school enrollment:
Students in private schools in grades 1 to 8 (elementary and middle school): 40
Here:
10.2%
Pennsylvania:
15.7%
Students in private schools in grades 9 to 12 (high school): 20
Here:
8.8%
Pennsylvania:
13.4%
Students in private undergraduate colleges:
Here:
0.0%
Pennsylvania:
39.8%
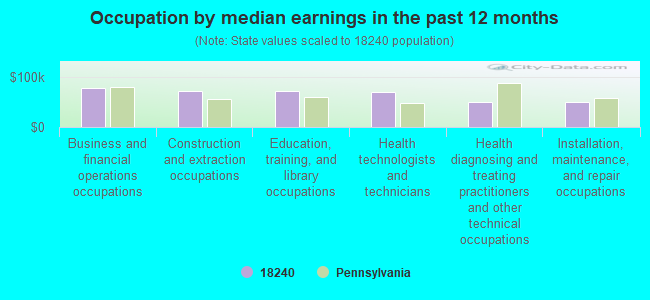
Occupation by median earnings in the past 12 months ($)
76,756Business and financial operations occupations
71,968Construction and extraction occupations
71,118Education, training, and library occupations
70,661Health technologists and technicians
49,741Health diagnosing and treating practitioners and other technical occupations
49,143Installation, maintenance, and repair occupations
Companies with federal contracts located in this zip code:
KOVATCH CORPORATION (1 INDUSTRIAL COMPLEX in NESQUEHONING, PA; small business) : $79,379,373 in 15 contractsfrom 2001 to 2006
Contracts for Trucks and Truck Tractors, Wheeled, Electrical and Electronic Properties Measuring and Testing Instruments, Power and Hand Pumps, Maintenance, Repair and Rebuilding of Equipment -- Fire Fighting, Rescue, and Safety Equipment; and Environmental Protection Equipment and Materials, and moreby Air Force, Navy, Defense Logistics Agency Signed by year:2000: $0; 2001: $61,249; 2002: $2,695,968; 2003: $1,593,066; 2004: $45,191,828; 2005: $14,637,668; 2006: $15,199,594.
Biggest contracts:
$44,868,949 with Air Force for Trucks and Truck Tractors, Wheeled. Signed on 2004-04-30. Completion date: 2005-11-30.
$14,603,996, same as above.Signed on 2005-04-22. Completion date: 2006-04-28.
$14,427,086, same as above.Signed on 2006-04-18. Completion date: 2007-03-15.
$2,695,968, same as above.Signed on 2002-03-29. Completion date: 2003-03-31.
AMETEK INC CHEMICAL PRODUCTS (42 MOUNTAIN AVE in NESQUEHONING, PA; small business) : $120,016 in 6 contractsfrom 2000 to 2006
Contracts for Heat Exchangers and Steam Condensers, Miscellaneous Electrical and Electronic Components, Electrical and Electronic assemblies, Boards, Cards, and Associated Hardware, Preservative and Sealing Compounds by Army, Navy Signed by year:2000: $53,661; 2001: $43,537; 2002: $0; 2003: $0; 2004: $17,213; 2005: $2,549; 2006: $3,056.
Biggest contracts:
$53,661 with Army for Heat Exchangers and Steam Condensers. Taking place in DE. Signed on 2000-04-20. Completion date: 2000-07-11.
$43,537 with Navy for Miscellaneous Electrical and Electronic Components. Taking place in DE. Signed on 2001-05-08. Completion date: 2001-05-31.
$17,213 with Navy for Electrical and Electronic assemblies, Boards, Cards, and Associated Hardware. Taking place in DE. Signed on 2004-08-23. Completion date: 2004-09-17.
$3,056 with Navy for Preservative and Sealing Compounds. Taking place in DE. Signed on 2006-04-03. Completion date: 2006-05-03.
Top industries in this zip code by the number of employees in 2005:
Administrative and Support and Waste Management and Remediation Services: Office Administrative Services (50-99 employees: 1 establishment)
Health Care and Social Assistance: Nursing Care Facilities (20-49: 1, 10-19: 1)
Accommodation and Food Services: Limited-Service Restaurants (20-49: 1, 1-4: 2)
Administrative and Support and Waste Management and Remediation Services: Investigation Services (20-49: 1)
People in group quarters in 2010:
159 people in local jails and other municipal confinement facilities
4 people in other noninstitutional facilities
People in group quarters in 2000:
137 people in local jails and other confinement facilities (including police lockups)
27 people in other noninstitutional group quarters
4 people in homes for the mentally retarded
4 people in religious group quarters
Fatal accident statistics in 2014:
Fatal accident count: 1
Vehicles involved in fatal accidents: 2
Fatal accidents caused by drunken drivers: 0
Fatalities: 1
Persons involved in fatal accidents: 3
Pedestrians involved in fatal accidents: 0
Fatal accident statistics in 2013:
Fatal accident count: 2
Vehicles involved in fatal accidents: 2
Fatal accidents caused by drunken drivers: 0
Fatalities: 2
Persons involved in fatal accidents: 2
Pedestrians involved in fatal accidents: 0
Home Mortgage Disclosure Act Aggregated Statistics For Year 2009 (Based on 4 partial tracts)
A) FHA, FSA/RHS & VA Home Purchase Loans
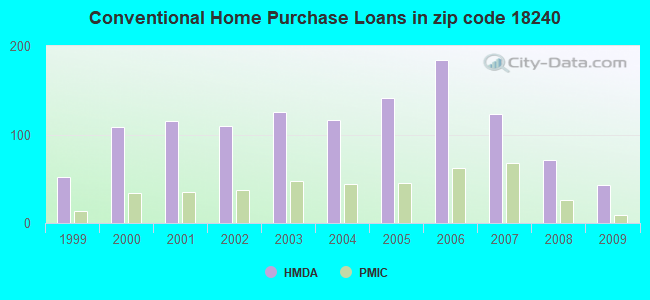
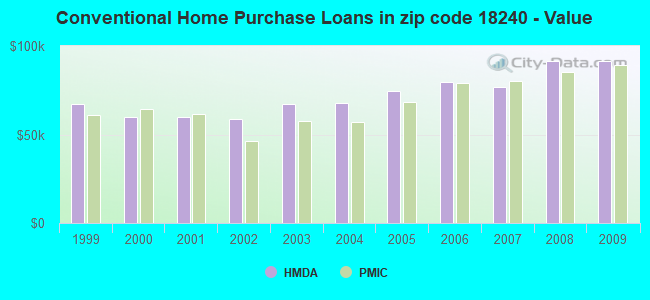
B) Conventional Home Purchase Loans
C) Refinancings
D) Home Improvement Loans
E) Loans on Dwellings For 5+ Families
F) Non-occupant Loans on < 5 Family Dwellings (A B C & D)
G) Loans On Manufactured Home Dwelling (A B C & D)
Number
Average Value
Number
Average Value
Number
Average Value
Number
Average Value
Number
Average Value
Number
Average Value
Number
Average Value
LOANS ORIGINATED
63
$78,477
43
$91,455
162
$91,054
36
$21,980
1
$122,440
19
$113,129
1
$30,180
APPLICATIONS APPROVED, NOT ACCEPTED
0
$0
1
$79,100
8
$90,030
4
$23,345
0
$0
4
$27,108
0
$0
APPLICATIONS DENIED
6
$69,310
12
$66,929
79
$115,161
23
$32,402
0
$0
5
$160,232
4
$40,810
APPLICATIONS WITHDRAWN
9
$83,956
4
$92,528
47
$113,840
5
$38,090
0
$0
5
$173,532
0
$0
FILES CLOSED FOR INCOMPLETENESS
1
$98,790
0
$0
11
$129,532
3
$62,613
0
$0
3
$128,937
0
$0
Aggregated Statistics For Year 2008 (Based on 4 partial tracts)
A) FHA, FSA/RHS & VA Home Purchase Loans
B) Conventional Home Purchase Loans
C) Refinancings
D) Home Improvement Loans
E) Loans on Dwellings For 5+ Families
F) Non-occupant Loans on < 5 Family Dwellings (A B C & D)
G) Loans On Manufactured Home Dwelling (A B C & D)
Number
Average Value
Number
Average Value
Number
Average Value
Number
Average Value
Number
Average Value
Number
Average Value
Number
Average Value
LOANS ORIGINATED
39
$82,502
71
$91,441
138
$88,776
56
$27,855
1
$8,362,310
34
$84,093
0
$0
APPLICATIONS APPROVED, NOT ACCEPTED
1
$57,050
9
$103,557
33
$108,442
13
$15,798
0
$0
4
$133,625
0
$0
APPLICATIONS DENIED
7
$69,723
21
$119,402
161
$103,709
41
$24,082
0
$0
10
$73,891
2
$26,585
APPLICATIONS WITHDRAWN
4
$85,708
4
$103,885
43
$101,046
13
$56,527
0
$0
4
$64,353
0
$0
FILES CLOSED FOR INCOMPLETENESS
1
$68,180
4
$91,468
6
$112,407
0
$0
0
$0
2
$75,545
0
$0
Aggregated Statistics For Year 2007 (Based on 4 partial tracts)
A) FHA, FSA/RHS & VA Home Purchase Loans
B) Conventional Home Purchase Loans
C) Refinancings
D) Home Improvement Loans
E) Loans on Dwellings For 5+ Families
F) Non-occupant Loans on < 5 Family Dwellings (A B C & D)
G) Loans On Manufactured Home Dwelling (A B C & D)
Number
Average Value
Number
Average Value
Number
Average Value
Number
Average Value
Number
Average Value
Number
Average Value
Number
Average Value
LOANS ORIGINATED
21
$83,691
123
$77,074
163
$86,112
97
$32,156
3
$198,507
38
$74,150
1
$73,610
APPLICATIONS APPROVED, NOT ACCEPTED
0
$0
12
$85,373
28
$84,604
10
$47,202
0
$0
6
$70,985
0
$0
APPLICATIONS DENIED
3
$83,027
49
$272,983
214
$91,464
68
$43,262
0
$0
25
$81,504
3
$164,590
APPLICATIONS WITHDRAWN
0
$0
15
$84,669
57
$105,496
5
$45,290
0
$0
5
$67,052
0
$0
FILES CLOSED FOR INCOMPLETENESS
0
$0
11
$66,159
28
$199,027
3
$31,957
0
$0
1
$97,400
0
$0
Aggregated Statistics For Year 2006 (Based on 4 partial tracts)
A) FHA, FSA/RHS & VA Home Purchase Loans
B) Conventional Home Purchase Loans
C) Refinancings
D) Home Improvement Loans
E) Loans on Dwellings For 5+ Families
F) Non-occupant Loans on < 5 Family Dwellings (A B C & D)
G) Loans On Manufactured Home Dwelling (A B C & D)
Number
Average Value
Number
Average Value
Number
Average Value
Number
Average Value
Number
Average Value
Number
Average Value
Number
Average Value
LOANS ORIGINATED
13
$68,345
184
$79,872
193
$73,626
114
$24,821
2
$209,675
52
$78,883
1
$69,490
APPLICATIONS APPROVED, NOT ACCEPTED
2
$72,225
20
$71,478
48
$98,547
14
$21,908
1
$200,360
7
$44,690
2
$35,680
APPLICATIONS DENIED
3
$91,833
54
$84,659
233
$84,091
117
$42,728
0
$0
27
$97,704
4
$38,478
APPLICATIONS WITHDRAWN
4
$66,682
21
$72,595
108
$97,919
9
$32,366
0
$0
4
$76,528
1
$82,090
FILES CLOSED FOR INCOMPLETENESS
0
$0
10
$76,580
20
$108,816
3
$67,087
0
$0
4
$62,265
0
$0
Aggregated Statistics For Year 2005 (Based on 4 partial tracts)
A) FHA, FSA/RHS & VA Home Purchase Loans
B) Conventional Home Purchase Loans
C) Refinancings
D) Home Improvement Loans
F) Non-occupant Loans on < 5 Family Dwellings (A B C & D)
G) Loans On Manufactured Home Dwelling (A B C & D)
Number
Average Value
Number
Average Value
Number
Average Value
Number
Average Value
Number
Average Value
Number
Average Value
LOANS ORIGINATED
14
$77,309
141
$74,797
249
$68,264
75
$26,431
42
$63,364
5
$38,702
APPLICATIONS APPROVED, NOT ACCEPTED
0
$0
13
$54,033
35
$67,570
6
$26,040
5
$41,540
2
$42,675
APPLICATIONS DENIED
0
$0
49
$60,727
198
$83,401
63
$35,720
15
$37,092
2
$41,415
APPLICATIONS WITHDRAWN
2
$63,775
18
$75,717
126
$92,834
16
$86,975
3
$153,403
0
$0
FILES CLOSED FOR INCOMPLETENESS
0
$0
2
$54,595
18
$99,615
1
$64,000
0
$0
0
$0
Aggregated Statistics For Year 2004 (Based on 4 partial tracts)
A) FHA, FSA/RHS & VA Home Purchase Loans
B) Conventional Home Purchase Loans
C) Refinancings
D) Home Improvement Loans
F) Non-occupant Loans on < 5 Family Dwellings (A B C & D)
G) Loans On Manufactured Home Dwelling (A B C & D)
Number
Average Value
Number
Average Value
Number
Average Value
Number
Average Value
Number
Average Value
Number
Average Value
LOANS ORIGINATED
23
$58,820
116
$67,817
208
$67,013
61
$33,610
31
$40,046
2
$62,925
APPLICATIONS APPROVED, NOT ACCEPTED
0
$0
20
$91,052
42
$70,840
7
$36,609
7
$51,440
1
$34,750
APPLICATIONS DENIED
1
$52,870
40
$70,551
189
$73,577
54
$43,048
18
$35,370
5
$27,148
APPLICATIONS WITHDRAWN
0
$0
15
$71,469
124
$78,873
6
$22,532
6
$46,612
0
$0
FILES CLOSED FOR INCOMPLETENESS
0
$0
1
$171,140
18
$87,675
5
$44,020
3
$71,890
0
$0
Aggregated Statistics For Year 2003 (Based on 4 partial tracts)
A) FHA, FSA/RHS & VA Home Purchase Loans
B) Conventional Home Purchase Loans
C) Refinancings
D) Home Improvement Loans
E) Loans on Dwellings For 5+ Families
F) Non-occupant Loans on < 5 Family Dwellings (A B C & D)
Number
Average Value
Number
Average Value
Number
Average Value
Number
Average Value
Number
Average Value
Number
Average Value
LOANS ORIGINATED
17
$53,277
125
$67,362
392
$63,224
88
$27,909
1
$44,520
43
$62,300
APPLICATIONS APPROVED, NOT ACCEPTED
0
$0
14
$49,134
71
$80,521
7
$24,366
0
$0
7
$38,796
APPLICATIONS DENIED
3
$32,930
38
$50,576
234
$71,112
30
$32,203
0
$0
6
$47,768
APPLICATIONS WITHDRAWN
0
$0
15
$66,703
123
$71,044
7
$18,446
0
$0
2
$71,095
FILES CLOSED FOR INCOMPLETENESS
0
$0
4
$44,525
16
$105,629
2
$29,720
0
$0
1
$53,040
Aggregated Statistics For Year 2002 (Based on 4 partial tracts)
A) FHA, FSA/RHS & VA Home Purchase Loans
B) Conventional Home Purchase Loans
C) Refinancings
D) Home Improvement Loans
E) Loans on Dwellings For 5+ Families
F) Non-occupant Loans on < 5 Family Dwellings (A B C & D)
Number
Average Value
Number
Average Value
Number
Average Value
Number
Average Value
Number
Average Value
Number
Average Value
LOANS ORIGINATED
11
$52,369
110
$59,001
254
$61,211
97
$19,749
1
$222,620
39
$47,427
APPLICATIONS APPROVED, NOT ACCEPTED
1
$193,400
9
$56,546
72
$56,930
18
$20,917
0
$0
6
$47,520
APPLICATIONS DENIED
0
$0
37
$44,206
174
$61,733
41
$26,055
1
$208,710
7
$49,589
APPLICATIONS WITHDRAWN
2
$41,015
7
$46,846
108
$67,758
5
$44,188
0
$0
2
$43,730
FILES CLOSED FOR INCOMPLETENESS
0
$0
3
$21,733
11
$76,959
0
$0
0
$0
0
$0
Aggregated Statistics For Year 2001 (Based on 4 partial tracts)
A) FHA, FSA/RHS & VA Home Purchase Loans
B) Conventional Home Purchase Loans
C) Refinancings
D) Home Improvement Loans
E) Loans on Dwellings For 5+ Families
F) Non-occupant Loans on < 5 Family Dwellings (A B C & D)
Number
Average Value
Number
Average Value
Number
Average Value
Number
Average Value
Number
Average Value
Number
Average Value
LOANS ORIGINATED
27
$60,653
115
$59,767
154
$62,116
63
$17,194
1
$94,620
29
$68,058
APPLICATIONS APPROVED, NOT ACCEPTED
2
$38,850
11
$64,264
48
$60,148
7
$53,329
0
$0
3
$118,733
APPLICATIONS DENIED
1
$79,310
26
$40,872
185
$52,391
41
$17,525
3
$71,487
12
$30,671
APPLICATIONS WITHDRAWN
2
$80,920
8
$76,006
72
$67,325
12
$25,692
1
$264,370
5
$91,880
FILES CLOSED FOR INCOMPLETENESS
0
$0
1
$129,400
10
$76,215
1
$15,310
0
$0
0
$0
Aggregated Statistics For Year 2000 (Based on 4 partial tracts)
A) FHA, FSA/RHS & VA Home Purchase Loans
B) Conventional Home Purchase Loans
C) Refinancings
D) Home Improvement Loans
F) Non-occupant Loans on < 5 Family Dwellings (A B C & D)
Number
Average Value
Number
Average Value
Number
Average Value
Number
Average Value
Number
Average Value
LOANS ORIGINATED
27
$47,723
108
$59,905
97
$58,051
61
$13,450
15
$52,219
APPLICATIONS APPROVED, NOT ACCEPTED
2
$48,380
15
$45,869
38
$46,901
6
$33,325
2
$50,945
APPLICATIONS DENIED
0
$0
26
$48,459
128
$49,460
32
$20,300
6
$54,163
APPLICATIONS WITHDRAWN
1
$77,720
22
$45,092
68
$59,276
6
$17,217
0
$0
FILES CLOSED FOR INCOMPLETENESS
0
$0
3
$101,620
26
$67,908
1
$34,290
0
$0
Aggregated Statistics For Year 1999 (Based on 2 partial tracts)
A) FHA, FSA/RHS & VA Home Purchase Loans
B) Conventional Home Purchase Loans
C) Refinancings
D) Home Improvement Loans
E) Loans on Dwellings For 5+ Families
F) Non-occupant Loans on < 5 Family Dwellings (A B C & D)
Detailed PMIC statistics for the following Tracts:0202.00
, 0203.00
2003 - 2018 National Fire Incident Reporting System (NFIRS) incidents
According to the data from the years 2003 - 2018 the average number of fire incidents per year is 11. The highest number of reported fires - 34 took place in 2016, and the least - 0 in 2005. The data has an increasing trend.
When looking into fire subcategories, the most incidents belonged to: Structure Fires (60.9%), and Other (14.8%).
Fire incident types reported to NFIRS in Zip Code 18240


 Nearest zip codes: 18232, 18250, 18218, 18216, 18255, 18230.


 According to the data from the years 2003 - 2018 the average number of fire incidents per year is 11. The highest number of reported fires - 34 took place in 2016, and the least - 0 in 2005. The data has an increasing trend.
 When looking into fire subcategories, the most incidents belonged to: Structure Fires (60.9%), and Other (14.8%).