Estimated zip code population in 2022: 19,121 Zip code population in 2010: 19,320 Zip code population in 2000: 19,465
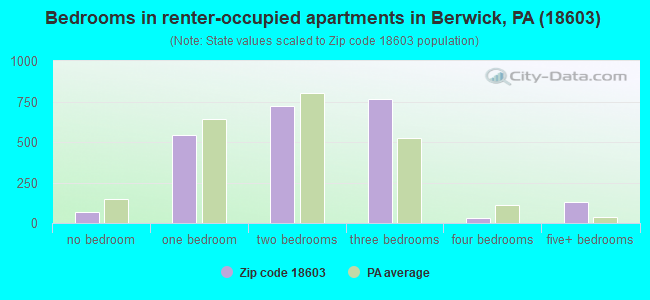
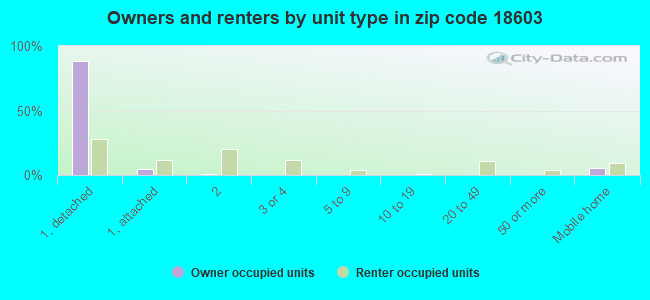
Houses and condos: 9,542 Renter-occupied apartments: 2,287
% of renters here:
27%
State:
31%
March 2022 cost of living index in zip code 18603: 84.6 (less than average, U.S. average is 100)
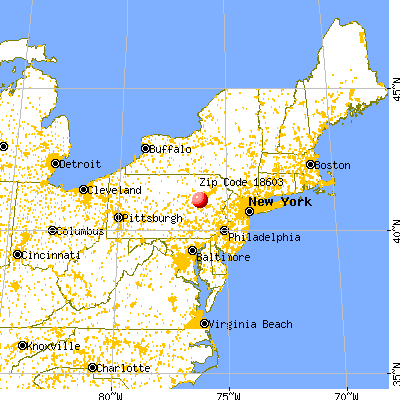
Land area: 51.6 sq. mi. Water area: 1.6 sq. mi.
Population density: 371 people per square mile
(very low).
OSM Map
General Map
Google Map
MSN Map
OSM Map
General Map
Google Map
MSN Map
OSM Map
General Map
Google Map
MSN Map
OSM Map
General Map
Google Map
MSN Map
Please wait while loading the map...
Real estate property taxes paid for housing units in 2022:
This zip code:
1.2% ($1,950)
Pennsylvania:
1.3% ($3,094)
Median real estate property taxes paid for housing units with mortgages in 2022: $2,186 (1.2%) Median real estate property taxes paid for housing units with no mortgage in 2022: $1,692 (1.3%)
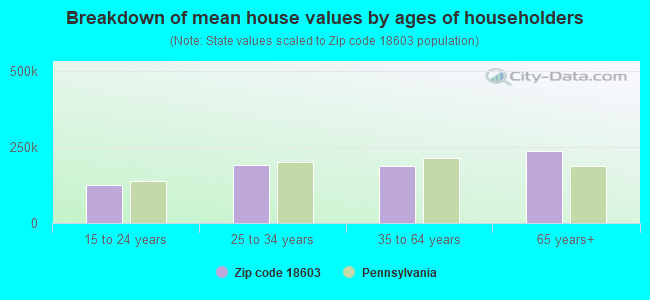
Estimated median house/condo value in 2022: $165,186
18603:
$165,186
Pennsylvania:
$245,500
According to our research of Pennsylvania and other state lists, there were 33 registered sex offenders living in 18603 zip code as of April 26, 2024. The ratio of all residents to sex offenders in zip code 18603 is 597 to 1. The ratio of registered sex offenders to all residents in this zip code is near the state average.
Median resident age:
This zip code:
47.0 years
Pennsylvania median age:
40.9 years
Average household size:
This zip code:
2.2 people
Pennsylvania:
2.4 people
Averages for the 2020 tax year for zip code 18603, filed in 2021:
Average Adjusted Gross Income (AGI) in 2020: $50,674 (Individual Income Tax Returns)
Here:
$50,674
State:
$75,707
Salary/wage: $43,682 (reported on 82.0% of returns)
Here:
$43,682
State:
$62,806
(% of AGI for various income ranges: 1025.9% for AGIs below $25k, 3351.8% for AGIs $25k-50k, 5844.4% for AGIs $50k-75k, 8459.1% for AGIs $75k-100k, 14828.2% for AGIs $100k-200k, 53946.0% for AGIs over 200k)
Taxable interest for individuals: $784 (reported on 25.2% of returns)
This zip code:
$784
Pennsylvania:
$1,633
(% of AGI for various income ranges: 14.1% for AGIs below $25k, 12.2% for AGIs $25k-50k, 16.8% for AGIs $50k-75k, 38.0% for AGIs $75k-100k, 73.2% for AGIs $100k-200k, 744.0% for AGIs over 200k)
Ordinary dividends: $4,213 (reported on 16.3% of returns)
Here:
$4,213
State:
$7,382
(% of AGI for various income ranges: 22.6% for AGIs below $25k, 26.0% for AGIs $25k-50k, 59.0% for AGIs $50k-75k, 74.8% for AGIs $75k-100k, 266.5% for AGIs $100k-200k, 5186.0% for AGIs over 200k)
Net capital gain/loss in AGI: +$10,716 (reported on 11.1% of returns)
Here:
+$10,716
State:
+$23,522
(% of AGI for various income ranges: 8.3% for AGIs below $25k, 17.0% for AGIs $25k-50k, 43.0% for AGIs $50k-75k, 111.1% for AGIs $75k-100k, 503.7% for AGIs $100k-200k, 12858.0% for AGIs over 200k)
Profit/loss from business: +$13,602 (reported on 9.2% of returns)
Here:
+$13,602
State:
+$16,274
(% of AGI for various income ranges: 58.5% for AGIs below $25k, 104.8% for AGIs $25k-50k, 106.5% for AGIs $50k-75k, 153.7% for AGIs $75k-100k, 533.5% for AGIs $100k-200k, 5254.0% for AGIs over 200k)
Taxable individual retirement arrangement distribution: $13,565 (reported on 10.4% of returns)
18603:
$13,565
Pennsylvania:
$18,583
(% of AGI for various income ranges: 90.5% for AGIs below $25k, 66.8% for AGIs $25k-50k, 151.0% for AGIs $50k-75k, 248.8% for AGIs $75k-100k, 705.3% for AGIs $100k-200k, 4060.0% for AGIs over 200k)
Total itemized deductions: $30,974 (reported on 2.4% of returns)
Here:
$30,974
State:
$34,850
(% of AGI for various income ranges: 51.5% for AGIs $25k-50k, 108.1% for AGIs $50k-75k, 149.7% for AGIs $75k-100k, 353.7% for AGIs $100k-200k, 3224.0% for AGIs over 200k)
Charity contributions: $11,000 (reported on 1.8% of returns)
Here:
$11,000
State:
$12,392
(% of AGI for various income ranges: 5.9% for AGIs $25k-50k, 9.7% for AGIs $50k-75k, 38.6% for AGIs $75k-100k, 91.7% for AGIs $100k-200k, 1644.0% for AGIs over 200k)
Taxes paid: $6,904 (reported on 2.4% of returns)
18603:
$6,904
State:
$8,200
(% of AGI for various income ranges: 9.7% for AGIs $25k-50k, 21.7% for AGIs $50k-75k, 31.8% for AGIs $75k-100k, 97.3% for AGIs $100k-200k, 650.0% for AGIs over 200k)
Earned income credit: $2,088 (reported on 16.5% of returns)
Here:
$2,088
State:
$2,100
(% of AGI for various income ranges: 78.4% for AGIs below $25k, 60.3% for AGIs $25k-50k, 1.6% for AGIs $50k-75k)
Percentage of individuals using paid preparers for their 2020 taxes: 92.8%
Here:
93%
State:
92%
(% for various income ranges: 91.3% for AGIs below $25k, 94.5% for AGIs $25k-50k, 93.8% for AGIs $50k-75k, 90.6% for AGIs $75k-100k, 93.5% for AGIs $100k-200k, 93.8% for AGIs over 200k)
Averages for the 2012 tax year for zip code 18603, filed in 2013:
Average Adjusted Gross Income (AGI) in 2012: $42,128 (Individual Income Tax Returns)
Here:
$42,128
State:
$61,346
Salary/wage: $37,971 (reported on 85.5% of returns)
Here:
$37,971
State:
$51,902
(% of AGI for various income ranges: 74.4% for AGIs below $25k, 81.2% for AGIs $25k-50k, 78.8% for AGIs $50k-75k, 79.2% for AGIs $75k-100k, 77.0% for AGIs $100k-200k, 60.7% for AGIs over 200k)
Taxable interest for individuals: $931 (reported on 28.1% of returns)
This zip code:
$931
Pennsylvania:
$1,588
(% of AGI for various income ranges: 1.1% for AGIs below $25k, 0.5% for AGIs $25k-50k, 0.5% for AGIs $50k-75k, 0.5% for AGIs $75k-100k, 0.7% for AGIs $100k-200k, 1.0% for AGIs over 200k)
Ordinary dividends: $3,263 (reported on 19.2% of returns)
Here:
$3,263
State:
$5,827
(% of AGI for various income ranges: 1.3% for AGIs below $25k, 0.6% for AGIs $25k-50k, 0.8% for AGIs $50k-75k, 1.0% for AGIs $75k-100k, 2.7% for AGIs $100k-200k, 3.8% for AGIs over 200k)
Net capital gain/loss in AGI: +$4,127 (reported on 9.6% of returns)
Here:
+$4,127
State:
+$14,495
(% of AGI for various income ranges: 0.2% for AGIs $25k-50k, 0.5% for AGIs $50k-75k, 0.9% for AGIs $75k-100k, 1.6% for AGIs $100k-200k, 4.3% for AGIs over 200k)
Profit/loss from business: +$13,265 (reported on 8.8% of returns)
Here:
+$13,265
State:
+$16,268
(% of AGI for various income ranges: 3.3% for AGIs below $25k, 2.4% for AGIs $25k-50k, 2.3% for AGIs $50k-75k, 1.7% for AGIs $75k-100k, 5.1% for AGIs $100k-200k)
Taxable individual retirement arrangement distribution: $10,180 (reported on 10.3% of returns)
18603:
$10,180
Pennsylvania:
$14,550
(% of AGI for various income ranges: 4.2% for AGIs below $25k, 1.9% for AGIs $25k-50k, 2.1% for AGIs $50k-75k, 2.2% for AGIs $75k-100k, 3.6% for AGIs $100k-200k)
Total itemized deductions: $17,874 (19% of AGI, reported on 16.2% of returns)
Here:
$17,874
State:
$23,538
Here:
19.4% of AGI
State:
18.4% of AGI
(% of AGI for various income ranges: 3.9% for AGIs below $25k, 3.9% for AGIs $25k-50k, 6.8% for AGIs $50k-75k, 6.7% for AGIs $75k-100k, 10.5% for AGIs $100k-200k, 11.2% for AGIs over 200k)
Charity contributions: $3,676 (reported on 11.4% of returns)
Here:
$3,676
State:
$4,025
(% of AGI for various income ranges: 0.2% for AGIs below $25k, 0.4% for AGIs $25k-50k, 0.7% for AGIs $50k-75k, 1.0% for AGIs $75k-100k, 1.7% for AGIs $100k-200k, 2.8% for AGIs over 200k)
Taxes paid: $6,375 (reported on 16.1% of returns)
18603:
$6,375
State:
$9,982
(% of AGI for various income ranges: 0.6% for AGIs below $25k, 1.1% for AGIs $25k-50k, 2.0% for AGIs $50k-75k, 2.3% for AGIs $75k-100k, 4.5% for AGIs $100k-200k, 5.5% for AGIs over 200k)
Earned income credit: $2,103 (reported on 18.7% of returns)
Here:
$2,103
State:
$2,106
(% of AGI for various income ranges: 5.6% for AGIs below $25k, 1.0% for AGIs $25k-50k)
Percentage of individuals using paid preparers for their 2012 taxes: 53.7%
Here:
54%
State:
53%
(% for various income ranges: 48.5% for AGIs below $25k, 52.7% for AGIs $25k-50k, 62.2% for AGIs $50k-75k, 60.0% for AGIs $75k-100k, 61.9% for AGIs $100k-200k, 77.8% for AGIs over 200k)
Averages for the 2004 tax year for zip code 18603, filed in 2005:
Average Adjusted Gross Income (AGI) in 2004: $33,905 (Individual Income Tax Returns)
Here:
$33,905
State:
$48,049
Salary/wage: $31,581 (reported on 86.4% of returns)
Here:
$31,581
State:
$42,646
(% of AGI for various income ranges: 109.5% for AGIs below $10k, 76.8% for AGIs $10k-25k, 83.5% for AGIs $25k-50k, 83.1% for AGIs $50k-75k, 81.1% for AGIs $75k-100k, 71.1% for AGIs over 100k)
Taxable interest for individuals: $1,293 (reported on 41.3% of returns)
This zip code:
$1,293
Pennsylvania:
$1,657
(% of AGI for various income ranges: 8.8% for AGIs below $10k, 2.1% for AGIs $10k-25k, 1.1% for AGIs $25k-50k, 1.1% for AGIs $50k-75k, 1.3% for AGIs $75k-100k, 1.8% for AGIs over 100k)
Taxable dividends: $2,307 (reported on 23.0% of returns)
Here:
$2,307
State:
$3,566
(% of AGI for various income ranges: 5.0% for AGIs below $10k, 1.6% for AGIs $10k-25k, 0.7% for AGIs $25k-50k, 0.9% for AGIs $50k-75k, 1.9% for AGIs $75k-100k, 3.0% for AGIs over 100k)
Net capital gain/loss: +$4,596 (reported on 13.7% of returns)
Here:
+$4,596
State:
+$9,716
(% of AGI for various income ranges: -1.6% for AGIs below $10k, 0.4% for AGIs $10k-25k, 0.8% for AGIs $25k-50k, 1.1% for AGIs $50k-75k, 2.4% for AGIs $75k-100k, 5.7% for AGIs over 100k)
Profit/loss from business: +$10,101 (reported on 10.3% of returns)
Here:
+$10,101
State:
+$14,267
(% of AGI for various income ranges: 3.7% for AGIs below $10k, 3.3% for AGIs $10k-25k, 2.4% for AGIs $25k-50k, 2.5% for AGIs $50k-75k, 2.6% for AGIs $75k-100k, 5.0% for AGIs over 100k)
Profit/loss from farming: +$2,333 (reported on 0.4% of returns)
Here:
+$2,333
State:
+$274
IRA payment deduction: $2,885 (reported on 2.8% of returns)
18603:
$2,885
Pennsylvania:
$2,903
(% of AGI for various income ranges: 0.3% for AGIs $10k-25k, 0.3% for AGIs $25k-50k, 0.2% for AGIs $50k-75k, 0.2% for AGIs $75k-100k, 0.2% for AGIs over 100k)
Self-employed pension: $10,800 (reported on 0.2% of returns)
Here:
$10,800
Pennsylvania:
$14,674
Total itemized deductions: $15,002 (21% of AGI, reported on 18.2% of returns)
Here:
$15,002
State:
$18,804
Here:
20.9% of AGI
State:
19.5% of AGI
(% of AGI for various income ranges: 4.5% for AGIs below $10k, 4.5% for AGIs $10k-25k, 5.8% for AGIs $25k-50k, 8.2% for AGIs $50k-75k, 10.6% for AGIs $75k-100k, 12.5% for AGIs over 100k)
Charity contributions deductions: $2,741 (4% of AGI, reported on 14.8% of returns)
Here:
$2,741
State:
$3,337
Here:
3.5% of AGI
State:
3.3% of AGI
(% of AGI for various income ranges: 0.4% for AGIs below $10k, 0.4% for AGIs $10k-25k, 0.6% for AGIs $25k-50k, 1.0% for AGIs $50k-75k, 1.5% for AGIs $75k-100k, 2.9% for AGIs over 100k)
Total tax: $4,347 (reported on 71.2% of returns)
18603:
$4,347
State:
$8,008
(% of AGI for various income ranges: 2.3% for AGIs below $10k, 4.1% for AGIs $10k-25k, 6.7% for AGIs $25k-50k, 8.7% for AGIs $50k-75k, 11.0% for AGIs $75k-100k, 16.9% for AGIs over 100k)
Earned income credit: $1,654 (reported on 16.7% of returns)
Here:
$1,654
State:
$1,643
Percentage of individuals using paid preparers for their 2004 taxes: 55.0%
Here:
55%
State:
56%
(% for various income ranges: 49.5% for AGIs below $10k, 55.4% for AGIs $10k-25k, 57.9% for AGIs $25k-50k, 54.4% for AGIs $50k-75k, 54.9% for AGIs $75k-100k, 67.0% for AGIs over 100k)
Household received Food Stamps/SNAP in the past 12 months: 1,092 Household did not receive Food Stamps/SNAP in the past 12 months: 7,494
Women who had a birth in the past 12 months: 348 (44 now married, 262 unmarried) Women who did not have a birth in the past 12 months: 3,539 (1,461 now married, 2,075 unmarried)
Housing units in zip code 18603 with a mortgage: 3,249 (364 second mortgage, 50 home equity loan, 255 both second mortgage and home equity loan) Houses without a mortgage: 187
Median monthly owner costs for units with a mortgage: $1,269 Median monthly owner costs for units without a mortgage: $522
Residents with income below the poverty level in 2022:
This zip code:
14.2%
Whole state:
11.8%
Residents with income below 50% of the poverty level in 2022:
This zip code:
8.1%
Whole state:
6.1%
Median number of rooms in houses and condos:
Here:
6.2
State:
6.8
Median number of rooms in apartments:
Here:
4.8
State:
4.3
Notable locations in this zip code not listed on our city pages
Notable locations in zip code 18603: Hicks Ferry Station (A), Summerhill Fire Company (B), Eagle Hose Company 2 (C), East Berwick Hose Company 2 (D), Defender Hose Company (E), West Berwick Hose Company 1 (F), Salem Township Volunteer Fire Company 1 (G), Reliance Fire Company 1 (H), Ranger Hose Company 2 (I), PPL Susquehanna Fire Brigade (J). Display/hide their locations on the map
Churches in zip code 18603 include: White Church (A), Saint Peters Church (B), Old Stone Church (C), Ebenezer Church (D), Stone Church (E). Display/hide their locations on the map
Cemeteries: Greek Catholic Cemetery (1), Saint Marys Cemetery (2), Roselawn Cemetery (3), Russian Orthodox Cemetery (4). Display/hide their locations on the map
In group quarters: 218 (-1 institutionalized population)
Size of family households: 2,718 2-persons, 1,442 3-persons, 641 4-persons, 384 5-persons, 76 6-persons, 48 7-or-more-persons
Size of nonfamily households: 2,656 1-person, 643 2-persons, 2 3-persons
1,566 married couples with children.
1,146 single-parent households (299 men, 847 women).
97.1% of residents of 18603 zip code speak English at home.
1.4% of residents speak Spanish at home (59% very well, 21% well, 17% not well, 2% not at all).
0.8% of residents speak other Indo-European language at home (93% very well, 7% well).
0.3% of residents speak Asian or Pacific Island language at home (53% very well, 47% well).
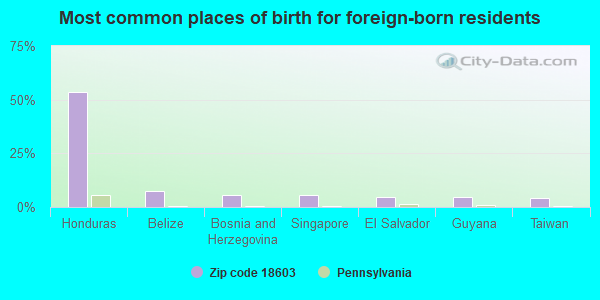
Foreign born population: 408 (2.1%) (80.6% of them are naturalized citizens)
This zip code:
2.1%
Whole state:
7.5%
53%Honduras
8%Belize
6%Bosnia and Herzegovina
5%Singapore
4%El Salvador
4%Guyana
4%Taiwan
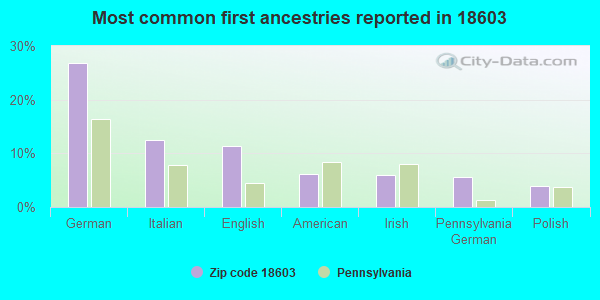
27%German
12%Italian
11%English
6%American
6%Irish
6%Pennsylvania German
4%Polish
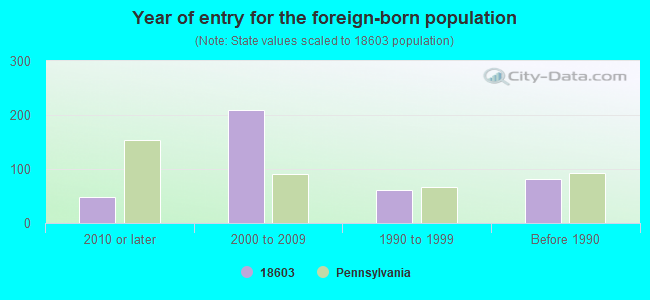
Year of entry for the foreign-born population
492010 or later
2102000 to 2009
611990 to 1999
82Before 1990
Major facilities with environmental interests located in this zip code:
BERWICK OFFRAY LLC (9TH STREET & BOMBOY LANE in BERWICK, PA)
AIR MAJOR (AIRS/AFS) AIR SYNTHETIC MINOR (AIRS/AFS) COMPLIANCE ACTIVITY (Tracking inspections of insecticide, fungicide, and rodenticide, and toxic substances) CRITERIA AND HAZARDOUS AIR POLLUTANT INVENTORY (Inventory of air pollution sources) STATE MASTER (Pennsylvania database) - AFS-23-3011481-1, AIR PROGRAM, RCRIS-PAD003040763, HAZARDOUS WASTE PROGRAM HAZARDOUS WASTE BIENNIAL REPORTER (Resource Conservation and Recovery Act (tracking hazardous waste)) Small Quantity Generators, between 100 kg and 1000 kg of hazardous waste/month (Resource Conservation and Recovery Act (tracking hazardous waste)) - notification Business SIC classification: COMMERCIAL PRINTING, GRAVURE Organizations: OPERNAME (CONTACT/OPERATOR)
, CSS INDS INC (CONTACT/OWNER)
Alternative names: BERWICK INDUSTRIES, BERWICK IND LLC, BERWICK IND LLC/BERWICK
BERWICK AREA SR HIGH SCH (1100 FOWLER AVE in BERWICK, PA)
STATE MASTER (Pennsylvania database) - AFS-23-1654551-1, AIR PROGRAM, RCRIS-PAD987345998, HAZARDOUS WASTE PROGRAM Conditionally Exempt Small Quantity Generators, less than 100 kg/month of hazardous waste (Resource Conservation and Recovery Act (tracking hazardous waste)) - notification TRANSPORTER (Resource Conservation and Recovery Act (tracking hazardous waste)) - notification Business SIC classification: ELEMENTARY AND SECONDARY SCHOOLS Organizations: OPERNAME (CONTACT/OPERATOR)
, BERWICK AREA SCHOOL DISTRICT (CONTACT/OWNER)
BASHUP (1108 W FRONT ST in BERWICK, PA)
STATE MASTER (Pennsylvania database) - RCRIS-PAD075987503, HAZARDOUS WASTE PROGRAM (Resource Conservation and Recovery Act (tracking hazardous waste)) Organizations: OPERNAME (CONTACT/OPERATOR)
BERWICK PLASTICS PLT (910 7TH AVENUE in BERWICK, PA)
AIR MINOR (AIRS/AFS) STATE MASTER (Pennsylvania database) - AFS-04-2891825-1, AIR PROGRAM Business SIC classification: PLASTICS PRODUCTS Alternative names: CARLISLE PLASTIC, CARLISLE PLASTICS/BERWICK PLT, LIQUITANE PLASTICS
BERWICK PLT (499 WEST 3RD STREET in BERWICK, PA)
AIR SYNTHETIC MINOR (AIRS/AFS) CRITERIA AND HAZARDOUS AIR POLLUTANT INVENTORY (Inventory of air pollution sources) STATE MASTER (Pennsylvania database) - AFS-23-1648999-1, AIR PROGRAM Business SIC classification: PREFABRICATED WOOD BUILDINGS AND COMPONENTS Alternative names: DELUXE HOMES OF PA, DELUXE HOMES OF PA/BERWICK PLT, DELUXE HOMES PA
BERWICK AREA HS ( in BERWICK, PA)
(National Center for Education Statistics) - STATE ID-1605 Organizations: BERWICK AREA SD (SCHOOL DISTRICT)
BERWICK AREA MS ( in BERWICK, PA)
(National Center for Education Statistics) - STATE ID-6808 Organizations: BERWICK AREA SD (SCHOOL DISTRICT)
BERWICK AUTO SALES (1127 PINE ST in BERWICK, PA)
AIR MINOR (AIRS/AFS) Conditionally Exempt Small Quantity Generators, less than 100 kg/month of hazardous waste (Resource Conservation and Recovery Act (tracking hazardous waste)) Business SIC classification: MOTOR VEHICLE DEALERS (NEW AND USED); AUTOMOTIVE REPAIR SHOPS Organizations: OPERNAME (CONTACT/OPERATOR)
, TYRONE (CONTACT/OWNER)
Alternative names: BERWICK CHEVROLET
BEAR PLYMOUTH INCORPORATED (1243 EAST FRONT STREET in BERWICK, PA)
AIR MINOR (AIRS/AFS) Small Quantity Generators, between 100 kg and 1000 kg of hazardous waste/month (Resource Conservation and Recovery Act (tracking hazardous waste)) - notification Business SIC classification: MOTOR VEHICLE DEALERS (NEW AND USED); GENERAL AUTOMOTIVE REPAIR SHOPS; AUTOMOTIVE REPAIR SHOPS Organizations: LEROY O DIEHL JR (CONTACT/OWNER)
Alternative names: BEAR CHRYSLER PLYMOUTH DODGE
BERWICK FREIGHT CAR COMPANY (3RD AND OAK STS BIDA COMPLEX in BERWICK, PA)
AIR MINOR (AIRS/AFS) Small Quantity Generators, between 100 kg and 1000 kg of hazardous waste/month (Resource Conservation and Recovery Act (tracking hazardous waste)) - notification Business SIC classification: RAILROAD EQUIPMENT Organizations: BERWICK HEAVY INDUSTRIES (CONTACT/OWNER)
ARGO OF PENNA INC (9TH & OAK STS in BERWICK, PA)
(Resource Conservation and Recovery Act (tracking hazardous waste)) Business NAICS classification: ORNAMENTAL AND ARCHITECTURAL METAL WORK MANUFACTURING. Organizations: OPERNAME (CONTACT/OPERATOR)
BERWICK AREA JOINT SEWER AUTHORITY (SOUTH EATON STREET in BERWICK, PA)
National Pollutant Discharge Elimination System MAJOR (Tracking pollutant discharge elimination systems) - permit National Pollutant Discharge Elimination System NON-MAJOR (Tracking pollutant discharge elimination systems) - permit Business SIC classification: SEWERAGE SYSTEMS Alternative names: BERWICK AREA JNT SEW AUTH, BERWICK AREA JNT SEWER AUTH, BERWICK MUN AUTH, BERWICK WWTP
BERWICK AREA SCH DIST/JR SR HIGH SCH (500 N MARKET ST in BERWICK, PA)
AIR MINOR (AIRS/AFS) Business SIC classification: ELEMENTARY AND SECONDARY SCHOOLS Alternative names: BERWICK AREA SCH DIS JR SR HIGH SCH, BERWICK AREA SCHOOL DISTRICT
Housing units lacking complete plumbing facilities: 1.2% Housing units lacking complete kitchen facilities: 2.4%
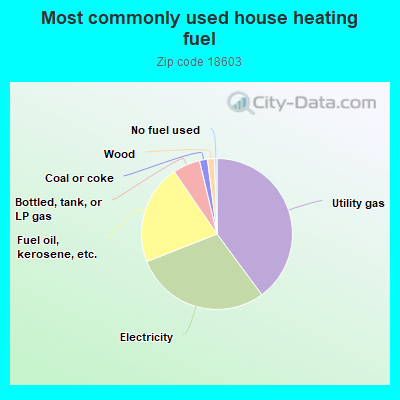
39.7%Utility gas
29.0%Electricity
21.3%Fuel oil, kerosene, etc.
5.8%Bottled, tank, or LP gas
1.7%Coal or coke
1.5%Wood
0.5%No fuel used
Population in 1990: 19,977.
Place of birth for U.S.-born residents:
This state: 16,137
Northeast: 1,109
Midwest: 173
South: 781
West: 394
67% of the 18603 zip code residents lived in the same house 5 years ago. Out of people who lived in different houses, 64% lived in this county. Out of people who lived in different counties, 50% lived in Pennsylvania.
93% of the 18603 zip code residents lived in the same house 1 year ago. Out of people who lived in different houses, 53% moved from this county. Out of people who lived in different houses, 37% moved from different county within same state. Out of people who lived in different houses, 9% moved from different state. Out of people who lived in different houses, 0% moved from abroad.
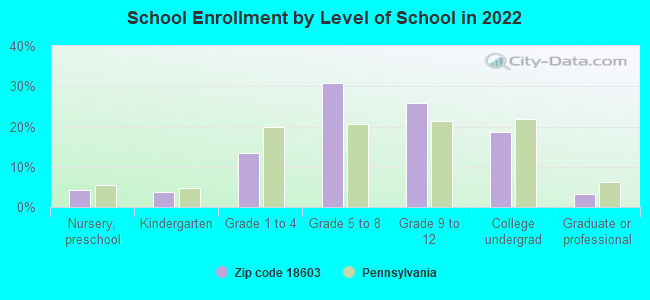
Private vs. public school enrollment:
Students in private schools in grades 1 to 8 (elementary and middle school): 174
Here:
12.6%
Pennsylvania:
15.7%
Students in private schools in grades 9 to 12 (high school): 17
Here:
2.2%
Pennsylvania:
13.4%
Students in private undergraduate colleges: 144
Here:
24.5%
Pennsylvania:
39.8%
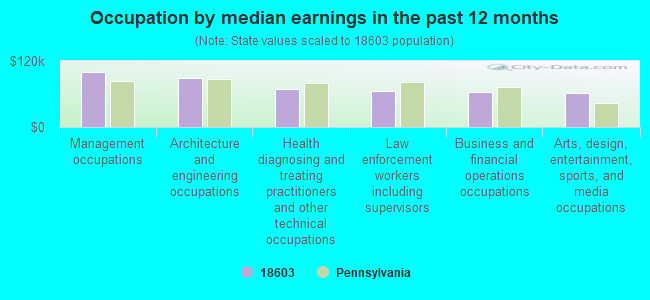
Occupation by median earnings in the past 12 months ($)
100,502Management occupations
89,770Architecture and engineering occupations
68,759Health diagnosing and treating practitioners and other technical occupations
65,120Law enforcement workers including supervisors
62,968Business and financial operations occupations
61,604Arts, design, entertainment, sports, and media occupations
Companies with federal contracts located in this zip code (BERWICK, PA):
WISE FOODS, INC (228 RASELEY STREET) : $1,394,267 in 10 contractsfrom 2004 to 2006
Contracts for Food Items For Resale by Defense Commissary Agency Signed by year:2000: $0; 2001: $0; 2002: $0; 2003: $0; 2004: $416,071; 2005: $620,923; 2006: $357,273.
Biggest contracts:
$384,694 with Defense Commissary Agency for Food Items For Resale. Signed on 2004-10-01. Completion date: 2005-02-28.
$357,273, same as above.Signed on 2006-01-01. Completion date: 2006-03-31.
$312,178, same as above.Signed on 2005-04-01. Completion date: 2005-09-30.
$168,707, same as above.Signed on 2005-01-01. Completion date: 2005-03-31.
IRONWOLF ENTERPRISES (203 E 2ND ST; small business) : $129,640 in 2 contractsin 2004
$89,000 with Army for Tents and Tarpaulins. Signed on 2004-03-22. Completion date: 2004-04-21.
$40,640 with Army for Individual Equipment. Signed on 2004-03-15. Completion date: 2004-04-14.
G & B SPECIALTIES, INC (535 W THIRD ST; small business)
$6,700 with Army for Hand Tools, Edged, Nonpowered. Taking place in NC. Signed on 2002-05-14. Completion date: 2002-06-21.
MULTIPLEX MANUFACTURING COMPAN (600 FOWLER AVE; small business)
$4,294 with U.S. Army Corps of Engineers - civil program financing only for Valves, Nonpowered. Taking place in OR. Signed on 2002-04-05. Completion date: 2002-05-06.
HOLOVIAKS CHURCH SUPPLY INC (2211 W FRONT ST; small business) : $3,181 in 2 contractsfrom 2004 to 2005
$2,349 with Army for Ecclesiastical Equipment, Furnishings, and Supplies. Signed on 2004-09-30. Completion date: 2004-11-30.
$832, same as above.Signed on 2005-05-03. Completion date: 2004-11-30.
BACKYARD BO (304 E 5TH ST; small business)
$240 with Army for Lease or Rental of Equipment -- Recreational and Athletic Equipment. Signed on 2005-04-07. Completion date: 2005-04-29.
Top industries in this zip code by the number of employees in 2005:
Utilities: Nuclear Electric Power Generation (over 1000 employees: 1 establishment)
Health Care and Social Assistance: General Medical and Surgical Hospitals (500-999: 1)
2005 - 2018 National Fire Incident Reporting System (NFIRS) incidents
Based on the data from the years 2005 - 2018 the average number of fires per year is 27. The highest number of reported fires - 84 took place in 2018, and the least - 0 in 2008. The data has a growing trend.
When looking into fire subcategories, the most reports belonged to: Structure Fires (55.7%), and Outside Fires (24.5%).
Fire incident types reported to NFIRS in Zip Code 18603


 Nearest zip codes: 18631, 18635, 17878, 18655, 18622, 18246.


 Based on the data from the years 2005 - 2018 the average number of fires per year is 27. The highest number of reported fires - 84 took place in 2018, and the least - 0 in 2008. The data has a growing trend.
 When looking into fire subcategories, the most reports belonged to: Structure Fires (55.7%), and Outside Fires (24.5%).