Estimated zip code population in 2022: 8,207 Zip code population in 2010: 7,686 Zip code population in 2000: 7,578
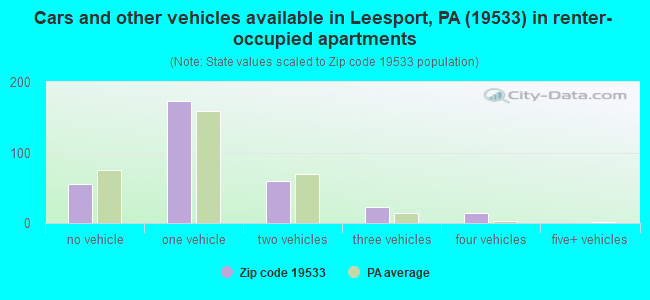
Houses and condos: 2,911 Renter-occupied apartments: 322
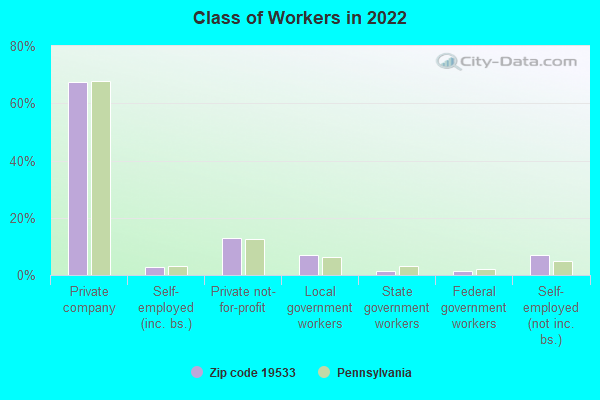
% of renters here:
11%
State:
31%
March 2022 cost of living index in zip code 19533: 95.0 (less than average, U.S. average is 100)
Land area: 17.9 sq. mi. Water area: 0.2 sq. mi.
Population density: 458 people per square mile
(low).
OSM Map
General Map
Google Map
MSN Map
OSM Map
General Map
Google Map
MSN Map
OSM Map
General Map
Google Map
MSN Map
OSM Map
General Map
Google Map
MSN Map
Please wait while loading the map...
Real estate property taxes paid for housing units in 2022:
This zip code:
1.4% ($4,202)
Pennsylvania:
1.3% ($3,094)
Median real estate property taxes paid for housing units with mortgages in 2022: $4,358 (1.4%) Median real estate property taxes paid for housing units with no mortgage in 2022: $3,868 (1.5%)
Averages for the 2020 tax year for zip code 19533, filed in 2021:
Average Adjusted Gross Income (AGI) in 2020: $75,843 (Individual Income Tax Returns)
Here:
$75,843
State:
$75,707
Salary/wage: $64,262 (reported on 81.1% of returns)
Here:
$64,262
State:
$62,806
(% of AGI for various income ranges: 1079.3% for AGIs below $25k, 3142.4% for AGIs $25k-50k, 5966.2% for AGIs $50k-75k, 8918.5% for AGIs $75k-100k, 16630.0% for AGIs $100k-200k, 51748.3% for AGIs over 200k)
Taxable interest for individuals: $1,343 (reported on 34.0% of returns)
This zip code:
$1,343
Pennsylvania:
$1,633
(% of AGI for various income ranges: 18.9% for AGIs below $25k, 23.6% for AGIs $25k-50k, 39.0% for AGIs $50k-75k, 75.9% for AGIs $75k-100k, 106.2% for AGIs $100k-200k, 801.7% for AGIs over 200k)
Ordinary dividends: $4,992 (reported on 24.1% of returns)
Here:
$4,992
State:
$7,382
(% of AGI for various income ranges: 32.9% for AGIs below $25k, 40.3% for AGIs $25k-50k, 68.8% for AGIs $50k-75k, 148.1% for AGIs $75k-100k, 363.1% for AGIs $100k-200k, 2336.7% for AGIs over 200k)
Net capital gain/loss in AGI: +$11,906 (reported on 19.5% of returns)
Here:
+$11,906
State:
+$23,522
(% of AGI for various income ranges: 5.5% for AGIs below $25k, 38.8% for AGIs $25k-50k, 71.4% for AGIs $50k-75k, 140.7% for AGIs $75k-100k, 415.6% for AGIs $100k-200k, 8618.3% for AGIs over 200k)
Profit/loss from business: +$16,534 (reported on 11.9% of returns)
Here:
+$16,534
State:
+$16,274
(% of AGI for various income ranges: 77.3% for AGIs below $25k, 131.6% for AGIs $25k-50k, 91.7% for AGIs $50k-75k, 234.4% for AGIs $75k-100k, 449.6% for AGIs $100k-200k, 4236.7% for AGIs over 200k)
Taxable individual retirement arrangement distribution: $17,356 (reported on 11.9% of returns)
19533:
$17,356
Pennsylvania:
$18,583
(% of AGI for various income ranges: 100.4% for AGIs below $25k, 160.2% for AGIs $25k-50k, 304.8% for AGIs $50k-75k, 333.3% for AGIs $75k-100k, 517.3% for AGIs $100k-200k, 1861.7% for AGIs over 200k)
Total itemized deductions: $34,296 (reported on 6.7% of returns)
Here:
$34,296
State:
$34,850
(% of AGI for various income ranges: 153.1% for AGIs $25k-50k, 218.8% for AGIs $50k-75k, 306.7% for AGIs $75k-100k, 503.1% for AGIs $100k-200k, 4981.7% for AGIs over 200k)
Charity contributions: $9,482 (reported on 4.9% of returns)
Here:
$9,482
State:
$12,392
(% of AGI for various income ranges: 45.5% for AGIs $50k-75k, 40.0% for AGIs $75k-100k, 81.1% for AGIs $100k-200k, 1580.0% for AGIs over 200k)
Taxes paid: $8,317 (reported on 6.7% of returns)
19533:
$8,317
State:
$8,200
(% of AGI for various income ranges: 32.1% for AGIs $25k-50k, 70.7% for AGIs $50k-75k, 111.5% for AGIs $75k-100k, 153.6% for AGIs $100k-200k, 730.0% for AGIs over 200k)
Earned income credit: $2,024 (reported on 9.6% of returns)
Here:
$2,024
State:
$2,100
(% of AGI for various income ranges: 64.8% for AGIs below $25k, 52.6% for AGIs $25k-50k)
Percentage of individuals using paid preparers for their 2020 taxes: 93.0%
Here:
93%
State:
92%
(% for various income ranges: 88.3% for AGIs below $25k, 94.4% for AGIs $25k-50k, 94.5% for AGIs $50k-75k, 94.6% for AGIs $75k-100k, 94.4% for AGIs $100k-200k, 100.0% for AGIs over 200k)
Averages for the 2012 tax year for zip code 19533, filed in 2013:
Average Adjusted Gross Income (AGI) in 2012: $58,592 (Individual Income Tax Returns)
Here:
$58,592
State:
$61,346
Salary/wage: $52,850 (reported on 83.8% of returns)
Here:
$52,850
State:
$51,902
(% of AGI for various income ranges: 68.3% for AGIs below $25k, 82.1% for AGIs $25k-50k, 78.1% for AGIs $50k-75k, 77.7% for AGIs $75k-100k, 80.1% for AGIs $100k-200k, 57.1% for AGIs over 200k)
Taxable interest for individuals: $1,305 (reported on 42.5% of returns)
This zip code:
$1,305
Pennsylvania:
$1,588
(% of AGI for various income ranges: 1.7% for AGIs below $25k, 0.9% for AGIs $25k-50k, 0.9% for AGIs $50k-75k, 0.5% for AGIs $75k-100k, 0.8% for AGIs $100k-200k, 1.6% for AGIs over 200k)
Ordinary dividends: $2,945 (reported on 25.4% of returns)
Here:
$2,945
State:
$5,827
(% of AGI for various income ranges: 1.8% for AGIs below $25k, 1.3% for AGIs $25k-50k, 1.0% for AGIs $50k-75k, 0.9% for AGIs $75k-100k, 1.4% for AGIs $100k-200k, 1.5% for AGIs over 200k)
Net capital gain/loss in AGI: +$2,111 (reported on 17.4% of returns)
Here:
+$2,111
State:
+$14,495
(% of AGI for various income ranges: 0.5% for AGIs $25k-50k, 0.2% for AGIs $75k-100k, 0.7% for AGIs $100k-200k, 2.2% for AGIs over 200k)
Profit/loss from business: +$15,405 (reported on 11.9% of returns)
Here:
+$15,405
State:
+$16,268
(% of AGI for various income ranges: 4.9% for AGIs below $25k, 2.2% for AGIs $25k-50k, 2.8% for AGIs $50k-75k, 1.6% for AGIs $75k-100k, 2.9% for AGIs $100k-200k, 5.8% for AGIs over 200k)
Taxable individual retirement arrangement distribution: $12,458 (reported on 13.8% of returns)
19533:
$12,458
Pennsylvania:
$14,550
(% of AGI for various income ranges: 4.9% for AGIs below $25k, 2.2% for AGIs $25k-50k, 2.6% for AGIs $50k-75k, 3.8% for AGIs $75k-100k, 3.8% for AGIs $100k-200k)
Total itemized deductions: $19,328 (19% of AGI, reported on 38.5% of returns)
Here:
$19,328
State:
$23,538
Here:
19.3% of AGI
State:
18.4% of AGI
(% of AGI for various income ranges: 8.9% for AGIs below $25k, 11.0% for AGIs $25k-50k, 12.1% for AGIs $50k-75k, 14.4% for AGIs $75k-100k, 14.5% for AGIs $100k-200k, 10.9% for AGIs over 200k)
Charity contributions: $2,536 (reported on 29.1% of returns)
Here:
$2,536
State:
$4,025
(% of AGI for various income ranges: 0.4% for AGIs below $25k, 0.8% for AGIs $25k-50k, 1.1% for AGIs $50k-75k, 1.3% for AGIs $75k-100k, 1.6% for AGIs $100k-200k, 1.5% for AGIs over 200k)
Taxes paid: $8,925 (reported on 38.5% of returns)
19533:
$8,925
State:
$9,982
(% of AGI for various income ranges: 2.7% for AGIs below $25k, 4.3% for AGIs $25k-50k, 5.1% for AGIs $50k-75k, 6.5% for AGIs $75k-100k, 7.3% for AGIs $100k-200k, 5.8% for AGIs over 200k)
Earned income credit: $2,011 (reported on 10.7% of returns)
Here:
$2,011
State:
$2,106
(% of AGI for various income ranges: 4.1% for AGIs below $25k, 0.7% for AGIs $25k-50k)
Percentage of individuals using paid preparers for their 2012 taxes: 52.9%
Here:
53%
State:
53%
(% for various income ranges: 48.2% for AGIs below $25k, 49.3% for AGIs $25k-50k, 59.6% for AGIs $50k-75k, 57.9% for AGIs $75k-100k, 54.3% for AGIs $100k-200k, 75.0% for AGIs over 200k)
Averages for the 2004 tax year for zip code 19533, filed in 2005:
Average Adjusted Gross Income (AGI) in 2004: $48,108 (Individual Income Tax Returns)
Here:
$48,108
State:
$48,049
Salary/wage: $44,508 (reported on 84.3% of returns)
Here:
$44,508
State:
$42,646
(% of AGI for various income ranges: 122.5% for AGIs below $10k, 67.4% for AGIs $10k-25k, 81.2% for AGIs $25k-50k, 83.5% for AGIs $50k-75k, 85.5% for AGIs $75k-100k, 69.8% for AGIs over 100k)
Taxable interest for individuals: $1,401 (reported on 56.2% of returns)
This zip code:
$1,401
Pennsylvania:
$1,657
(% of AGI for various income ranges: 14.4% for AGIs below $10k, 4.3% for AGIs $10k-25k, 1.8% for AGIs $25k-50k, 1.1% for AGIs $50k-75k, 0.7% for AGIs $75k-100k, 1.5% for AGIs over 100k)
Taxable dividends: $1,656 (reported on 32.9% of returns)
Here:
$1,656
State:
$3,566
(% of AGI for various income ranges: 9.3% for AGIs below $10k, 2.3% for AGIs $10k-25k, 1.1% for AGIs $25k-50k, 0.8% for AGIs $50k-75k, 0.8% for AGIs $75k-100k, 1.0% for AGIs over 100k)
Net capital gain/loss: +$4,884 (reported on 24.0% of returns)
Here:
+$4,884
State:
+$9,716
(% of AGI for various income ranges: -4.2% for AGIs below $10k, -0.1% for AGIs $10k-25k, 0.5% for AGIs $25k-50k, 0.2% for AGIs $50k-75k, 1.6% for AGIs $75k-100k, 6.0% for AGIs over 100k)
Profit/loss from business: +$15,792 (reported on 12.9% of returns)
Here:
+$15,792
State:
+$14,267
(% of AGI for various income ranges: 5.6% for AGIs below $10k, 4.2% for AGIs $10k-25k, 4.8% for AGIs $25k-50k, 2.9% for AGIs $50k-75k, 1.4% for AGIs $75k-100k, 6.3% for AGIs over 100k)
IRA payment deduction: $3,113 (reported on 3.7% of returns)
19533:
$3,113
Pennsylvania:
$2,903
(% of AGI for various income ranges: 0.3% for AGIs $10k-25k, 0.3% for AGIs $25k-50k, 0.3% for AGIs $50k-75k, 0.2% for AGIs $75k-100k, 0.2% for AGIs over 100k)
Self-employed pension: $12,464 (reported on 0.9% of returns)
Here:
$12,464
Pennsylvania:
$14,674
Total itemized deductions: $16,039 (19% of AGI, reported on 38.0% of returns)
Here:
$16,039
State:
$18,804
Here:
19.1% of AGI
State:
19.5% of AGI
(% of AGI for various income ranges: 13.7% for AGIs below $10k, 10.5% for AGIs $10k-25k, 11.3% for AGIs $25k-50k, 14.6% for AGIs $50k-75k, 14.3% for AGIs $75k-100k, 11.8% for AGIs over 100k)
Charity contributions deductions: $2,088 (2% of AGI, reported on 32.7% of returns)
Here:
$2,088
State:
$3,337
Here:
2.3% of AGI
State:
3.3% of AGI
(% of AGI for various income ranges: 1.0% for AGIs below $10k, 0.7% for AGIs $10k-25k, 1.0% for AGIs $25k-50k, 1.4% for AGIs $50k-75k, 1.3% for AGIs $75k-100k, 1.9% for AGIs over 100k)
Total tax: $7,260 (reported on 78.6% of returns)
19533:
$7,260
State:
$8,008
(% of AGI for various income ranges: 4.1% for AGIs below $10k, 4.4% for AGIs $10k-25k, 7.4% for AGIs $25k-50k, 8.9% for AGIs $50k-75k, 10.2% for AGIs $75k-100k, 18.7% for AGIs over 100k)
Earned income credit: $1,312 (reported on 7.7% of returns)
Here:
$1,312
State:
$1,643
Percentage of individuals using paid preparers for their 2004 taxes: 57.0%
Here:
57%
State:
56%
(% for various income ranges: 49.5% for AGIs below $10k, 59.1% for AGIs $10k-25k, 58.2% for AGIs $25k-50k, 61.4% for AGIs $50k-75k, 57.0% for AGIs $75k-100k, 59.0% for AGIs over 100k)
Likely homosexual households (counted as self-reported same-sex unmarried-partner households)
Lesbian couples: 0.1% of all households
Gay men: 0.0% of all households
Household received Food Stamps/SNAP in the past 12 months: 152 Household did not receive Food Stamps/SNAP in the past 12 months: 2,687
Women who had a birth in the past 12 months: 60 (31 now married, 26 unmarried) Women who did not have a birth in the past 12 months: 1,169 (588 now married, 576 unmarried)
Housing units in zip code 19533 with a mortgage: 1,719 (285 second mortgage, 279 both second mortgage and home equity loan) Houses without a mortgage: 166
Median monthly owner costs for units with a mortgage: $1,666 Median monthly owner costs for units without a mortgage: $689
Residents with income below the poverty level in 2022:
This zip code:
5.2%
Whole state:
11.8%
Residents with income below 50% of the poverty level in 2022:
This zip code:
1.6%
Whole state:
6.1%
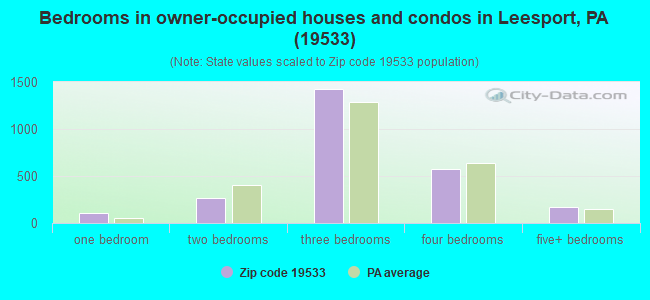
Median number of rooms in houses and condos:
Here:
6.7
State:
6.8
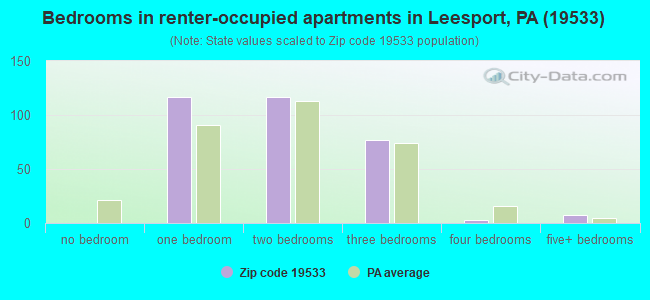
Median number of rooms in apartments:
Here:
4.9
State:
4.3
Notable locations in this zip code not listed on our city pages
Notable locations in zip code 19533: Willow Hollow Golf Course (A), Camp Joy (B), Epler Boat Launch (C), Leesport Farmers Market (D), Pocono Beagle Club (E), Reading Fairgrounds (F), Berks County Prison (G), Union Fire Company 1 Leesport (H), Berks County 4-H Center (I), Berks County Agricultural Center (J), Berks County New Heim (K), Berks County Old Heim Annex (L), Berks County Recycling Center (M), Berks County Youth Center (N), Leesport Borough Hall (O), Leesport Lock House (P), Schuylkill Valley Ambulance Association (Q), Schuylkill Valley Community Library (R). Display/hide their locations on the map
In group quarters: 1,444 (-1 institutionalized population)
Size of family households: 944 2-persons, 449 3-persons, 327 4-persons, 109 5-persons, 31 6-persons, 15 7-or-more-persons
Size of nonfamily households: 852 1-person, 119 2-persons
659 married couples with children.
247 single-parent households (101 men, 146 women).
93.0% of residents of 19533 zip code speak English at home.
4.1% of residents speak Spanish at home (62% very well, 18% well, 13% not well, 7% not at all).
1.6% of residents speak other Indo-European language at home (70% very well, 22% well, 1% not well, 7% not at all).
1.1% of residents speak Asian or Pacific Island language at home (22% very well, 74% well, 3% not well).
0.1% of residents speak other language at home (100% very well).
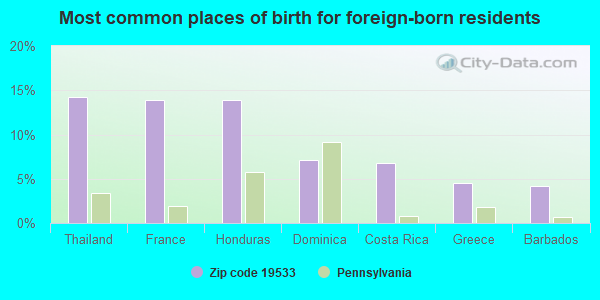
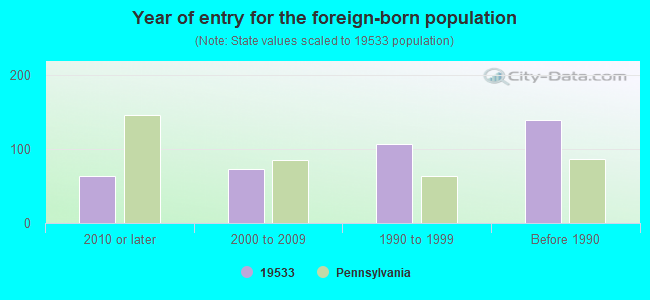
Foreign born population: 267 (3.3%) (57.4% of them are naturalized citizens)
This zip code:
3.3%
Whole state:
7.5%
14%Thailand
14%France
14%Honduras
7%Dominica
7%Costa Rica
5%Greece
4%Barbados
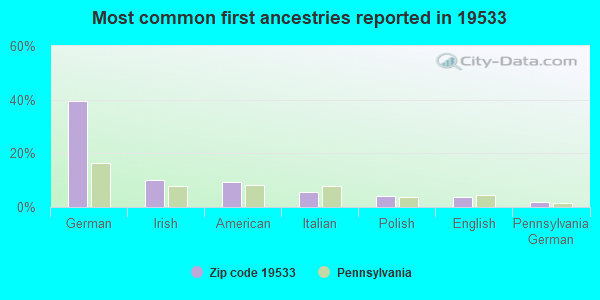
39%German
10%Irish
9%American
6%Italian
4%Polish
4%English
2%Pennsylvania German
Year of entry for the foreign-born population
632010 or later
732000 to 2009
1071990 to 1999
139Before 1990
Facilities with environmental interests located in this zip code:
BFI WASTE SYS OF NORTH AMER (2174F ORCHARD LN in LEESPORT, PA)
STATE MASTER (Pennsylvania database) - RCRIS-PAD987393709, HAZARDOUS WASTE PROGRAM, PCS-PAR803579, National Pollutant Discharge Elimination System Permit National Pollutant Discharge Elimination System NON-MAJOR (Tracking pollutant discharge elimination systems) - permit Conditionally Exempt Small Quantity Generators, less than 100 kg/month of hazardous waste (Resource Conservation and Recovery Act (tracking hazardous waste)) - notification Business SIC classification: LOCAL TRUCKING WITHOUT STORAGE Organizations: BFI WASTE SYS OF N AMERICA INC (CONTACT/OWNER)
, BFI WASTE SERVICES OF PENNSYLVANIA, LLC (CONTACT/OWNER)
Alternative names: BFI WASTE SYSTEM OF N A, BFI WASTE SYS OF N AMERICA INC, BFI WASTE SYSTEM OF NA, BROWNING-FERRIS INC
BERKS CNTY STEAM PLT (1261 COUNTY WELFARE RD in LEESPORT, PA)
STATE MASTER (Pennsylvania database) - RCRIS-PAR000509612, HAZARDOUS WASTE PROGRAM Large Quantity Generators, more that 1000 kg of hazardous waste/month (Resource Conservation and Recovery Act (tracking hazardous waste)) Business NAICS classification: OTHER ELECTRIC POWER GENERATION. Organizations: HOLLOWBUSH JEFF (CONTACT/OPERATOR)
, BERKS COUNTY (CONTACT/OWNER)
, BERKS COUNTY STEAM PLANT (OWNER/OPERATOR)
BERKS CAREER & TECH CTR (COUNTY RD in LEESPORT, PA)
STATE MASTER (Pennsylvania database) - RCRIS-PAD981734411, HAZARDOUS WASTE PROGRAM Conditionally Exempt Small Quantity Generators, less than 100 kg/month of hazardous waste (Resource Conservation and Recovery Act (tracking hazardous waste)) - notification Organizations: OPERNAME (CONTACT/OPERATOR)
, BERKS COUNTY (CONTACT/OWNER)
BETH ALLEN TRUCK RENTAL MORRIS BERMAN (41 CENTER ST in LEESPORT, PA)
STATE MASTER (Pennsylvania database) - RCRIS-PAD981114234, HAZARDOUS WASTE PROGRAM Small Quantity Generators, between 100 kg and 1000 kg of hazardous waste/month (Resource Conservation and Recovery Act (tracking hazardous waste)) - notification Organizations: OPERNAME (CONTACT/OPERATOR)
, BERMAN, MORRIS INC (CONTACT/OWNER)
BERKS CTC-WEST CAMPUS ( in LEESPORT, PA)
(National Center for Education Statistics) - STATE ID-7068
61 SUNOCO (242 SO CENTER AVE in LEESPORT, PA)
Small Quantity Generators, between 100 kg and 1000 kg of hazardous waste/month (Resource Conservation and Recovery Act (tracking hazardous waste)) - notification USED OIL PROGRAM (Resource Conservation and Recovery Act (tracking hazardous waste)) Organizations: OPERNAME (CONTACT/OPERATOR)
, RACCUGLIA, SAL OWNER (CONTACT/OWNER)
BERKS CO WWTP (1088 BERKS RD in LEESPORT, PA)
National Pollutant Discharge Elimination System NON-MAJOR (Tracking pollutant discharge elimination systems) - permit Business SIC classification: SEWERAGE SYSTEMS Alternative names: BERKS CO SRVCS CNTR - ENG OFC, BERKS COUNTY
AMES DEPARTMENT STORE INC (45 AMES WAY in LEESPORT, PA)
Small Quantity Generators, between 100 kg and 1000 kg of hazardous waste/month (Resource Conservation and Recovery Act (tracking hazardous waste)) - notification Organizations: AMES DEPARTMENT STORES INC (CONTACT/OWNER)
Alternative names: AMES DISTRIBUTION SERVICE 0969
BERKS CNTY/BERKS CNTY COMPLEX (COUNTY WELFARE RD in LEESPORT, PA)
AIR SYNTHETIC MINOR (AIRS/AFS) CRITERIA AND HAZARDOUS AIR POLLUTANT INVENTORY (Inventory of air pollution sources) Business SIC classification: HEALTH AND ALLIED SERVICES Alternative names: COUNTY OF BERKS/BERKS COUNTY COMPLEX, COUNTY OF BERKS - BERKS HEIM
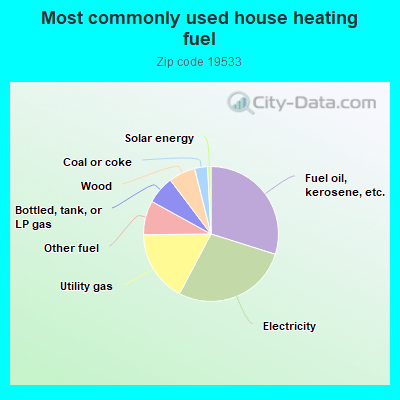
Housing units lacking complete plumbing facilities: 0.2% Housing units lacking complete kitchen facilities: 0.4%
29.9%Fuel oil, kerosene, etc.
27.9%Electricity
17.1%Utility gas
8.2%Other fuel
6.7%Bottled, tank, or LP gas
6.4%Wood
3.1%Coal or coke
0.8%Solar energy
Population in 1990: 6,199. Population change in the 1990s: +1,379 (+22.2%).
Place of birth for U.S.-born residents:
This state: 6,585
Northeast: 537
Midwest: 275
South: 244
West: 125
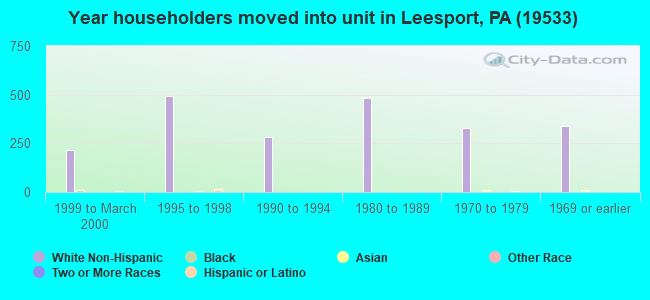
59% of the 19533 zip code residents lived in the same house 5 years ago. Out of people who lived in different houses, 71% lived in this county. Out of people who lived in different counties, 50% lived in Pennsylvania.
85% of the 19533 zip code residents lived in the same house 1 year ago. Out of people who lived in different houses, 72% moved from this county. Out of people who lived in different houses, 21% moved from different county within same state. Out of people who lived in different houses, 3% moved from different state.
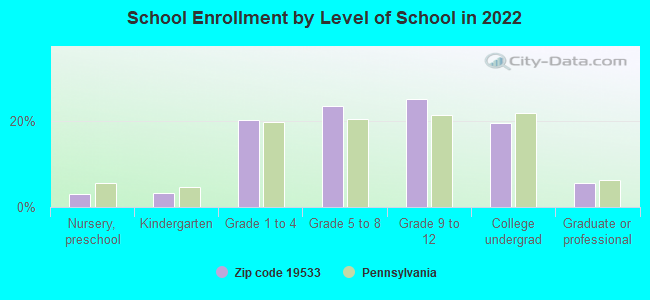
Private vs. public school enrollment:
Students in private schools in grades 1 to 8 (elementary and middle school): 16
Here:
3.0%
Pennsylvania:
15.7%
Students in private schools in grades 9 to 12 (high school): 12
Here:
3.9%
Pennsylvania:
13.4%
Students in private undergraduate colleges: 39
Here:
16.5%
Pennsylvania:
39.8%
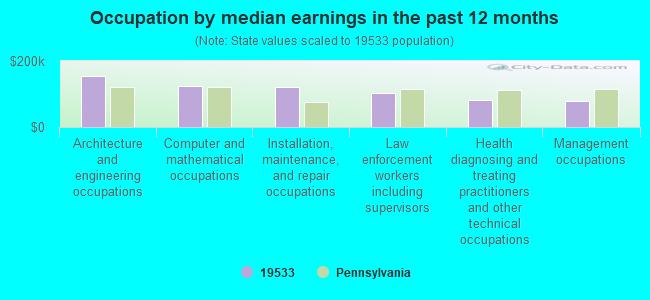
Occupation by median earnings in the past 12 months ($)
154,321Architecture and engineering occupations
124,835Computer and mathematical occupations
121,409Installation, maintenance, and repair occupations
102,565Law enforcement workers including supervisors
82,525Health diagnosing and treating practitioners and other technical occupations
77,975Management occupations
Companies with federal contracts located in this zip code:
HOMAN EXCAVATING INC (1281 W LEESPORT RD in LEESPORT, PA; small business) : $45,139 in 4 contractsfrom 2004 to 2005
$15,024 with Army for Maintenance, Repair or Alteration of Real Property -- Water Supply Facilities. Signed on 2005-07-26. Completion date: 2005-07-14.
$15,024 with U.S. Army Corps of Engineers - civil program financing only for Maintenance, Repair or Alteration of Real Property -- Water Supply Facilities. Signed on 2005-07-26. Completion date: 2005-07-14.
$9,466 with Army for Miscellaneous Electrical and Electronic Components. Signed on 2004-08-24. Completion date: 2004-09-30.
$5,625, same as above.Signed on 2004-09-20. Completion date: 2004-09-30.
READING PRECAST INC (5494 POTTSVILLE PIKE in LEESPORT, PA; small business) : $33,226 in 2 contractsin 2005
$18,063 with Army for Maintenance, Repair and Rebuilding of Equipment -- Miscellaneous. Signed on 2005-07-28. Completion date: 2005-08-26.
$15,163, same as above.Signed on 2005-12-07. Completion date: 2006-01-16.
M WAHL CONCRETE (1050 PALISADES DR in LEESPORT, PA; small business) : $2,280 in 2 contractsfrom 2003 to 2005
$1,990 with Army for Highways, Roads, Streets, Bridges, and Railways. Signed on 2005-11-04. Completion date: 2005-10-26.
$290 with U.S. Army Corps of Engineers - civil program financing only for Other Housekeeping Services. Signed on 2003-04-28. Completion date: 2003-04-11.
Top industries in this zip code by the number of employees in 2005:
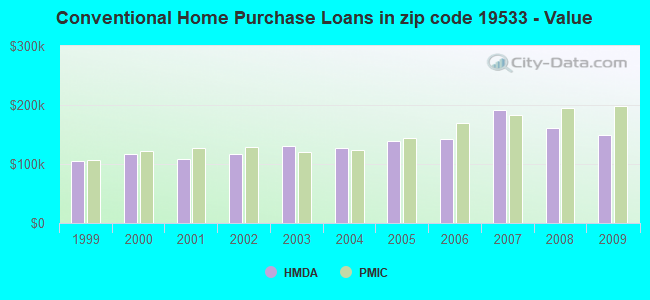
Detailed PMIC statistics for the following Tracts:0103.01
2003 - 2018 National Fire Incident Reporting System (NFIRS) incidents
Based on the data from the years 2003 - 2018 the average number of fires per year is 40. The highest number of reported fire incidents - 98 took place in 2006, and the least - 0 in 2011. The data has a decreasing trend.
When looking into fire subcategories, the most incidents belonged to: Structure Fires (51.8%), and Outside Fires (21.4%).
Fire incident types reported to NFIRS in Zip Code 19533
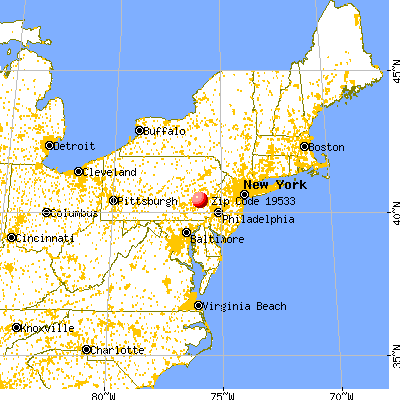


 Nearest zip codes: 19605, 19541, 19555, 19610, 19601, 19609.


 Based on the data from the years 2003 - 2018 the average number of fires per year is 40. The highest number of reported fire incidents - 98 took place in 2006, and the least - 0 in 2011. The data has a decreasing trend.
 When looking into fire subcategories, the most incidents belonged to: Structure Fires (51.8%), and Outside Fires (21.4%).