Estimated zip code population in 2022: 9,146 Zip code population in 2010: 7,805 Zip code population in 2000: 6,740
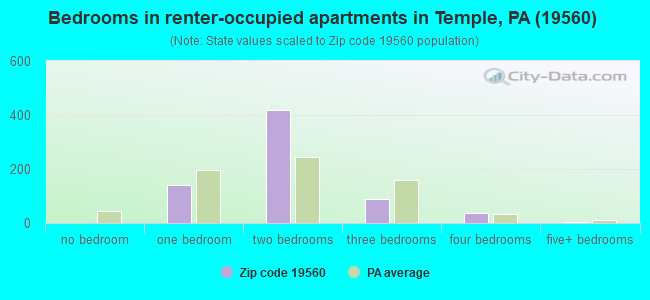
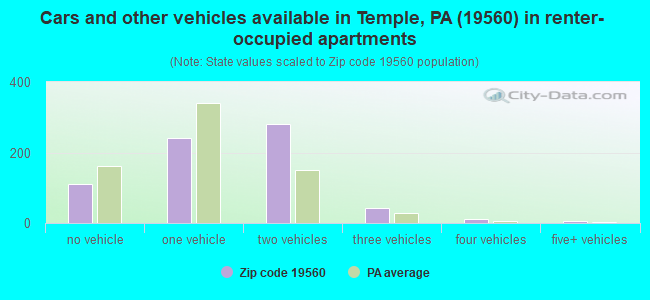
Houses and condos: 3,894 Renter-occupied apartments: 692
% of renters here:
18%
State:
31%
March 2022 cost of living index in zip code 19560: 95.9 (near average, U.S. average is 100)
Land area: 8.1 sq. mi. Water area: 0.1 sq. mi.
Population density: 1,125 people per square mile
(low).
OSM Map
General Map
Google Map
MSN Map
OSM Map
General Map
Google Map
MSN Map
OSM Map
General Map
Google Map
MSN Map
OSM Map
General Map
Google Map
MSN Map
Please wait while loading the map...
Real estate property taxes paid for housing units in 2022:
This zip code:
1.9% ($3,369)
Pennsylvania:
1.3% ($3,094)
Median real estate property taxes paid for housing units with mortgages in 2022: $3,538 (2.0%) Median real estate property taxes paid for housing units with no mortgage in 2022: $3,084 (1.5%)
Business Search- 14 Million verified businesses
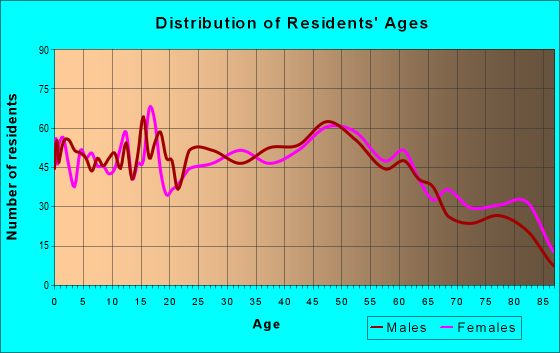
Males: 4,375
(47.8%)
Females: 4,771
(52.2%)
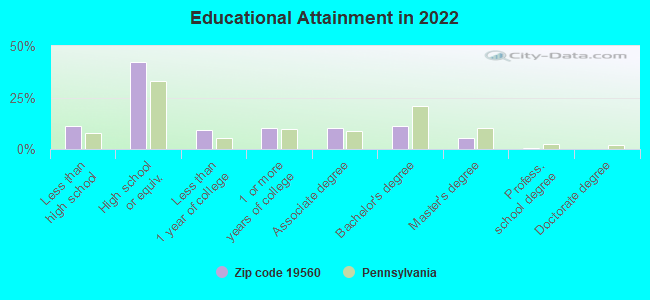
For population 25 years and over in 19560:
High school or higher: 88.3%
Bachelor's degree or higher: 17.1%
Graduate or professional degree: 6.2%
Unemployed: 3.4%
Mean travel time to work (commute): 20.0 minutes
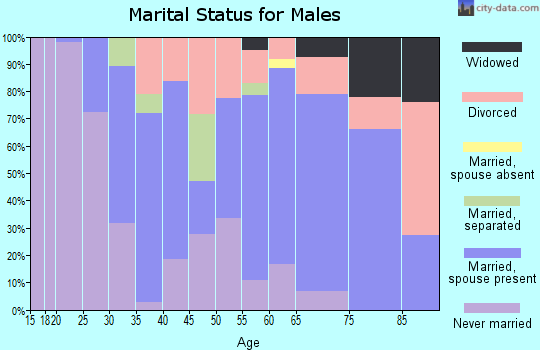
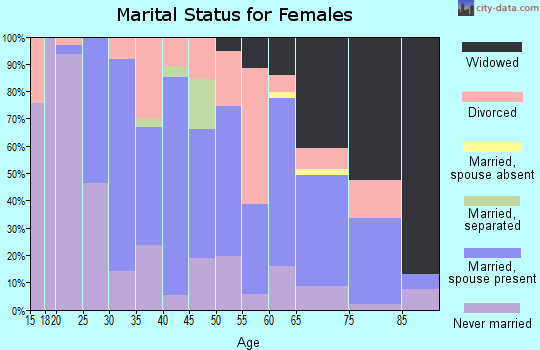
For population 15 years and over in 19560:
Never married: 33.9%
Now married: 46.7%
Separated: 1.5%
Widowed: 8.7%
Divorced: 9.2%
Zip code 19560 compared to state average:
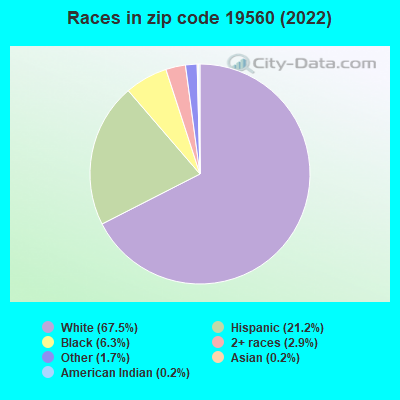
Hispanic race population percentage above state average.
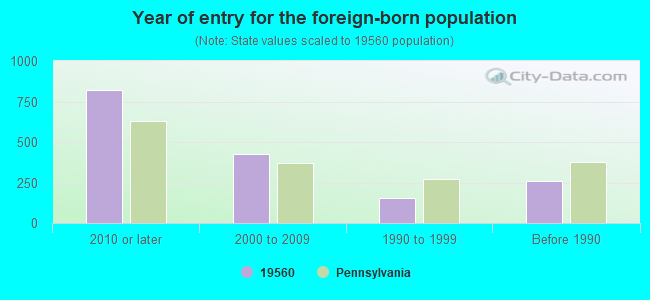
Foreign-born population percentage above state average.
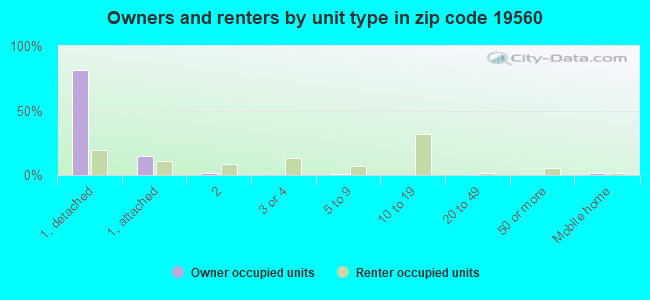
Renting percentage below state average.
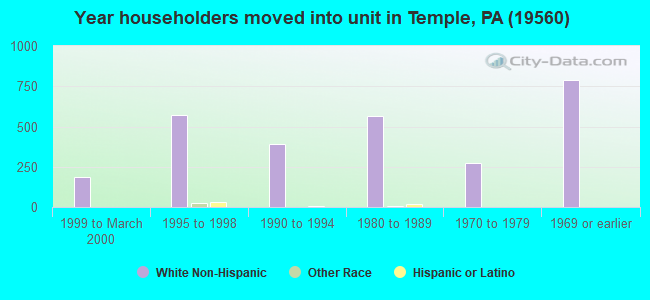
Length of stay since moving in below state average.
Percentage of population with a bachelor's degree or higher below state average.
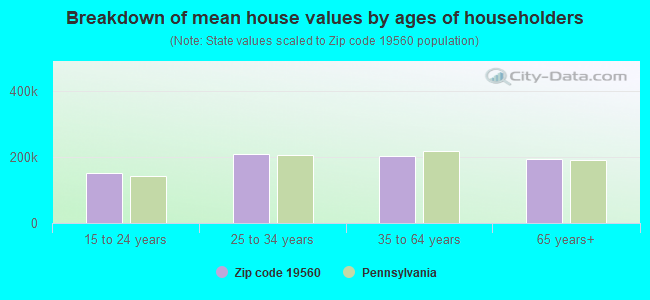
Estimated median house/condo value in 2022: $180,598
19560:
$180,598
Pennsylvania:
$245,500
According to our research of Pennsylvania and other state lists, there were 12 registered sex offenders living in 19560 zip code as of April 26, 2024. The ratio of all residents to sex offenders in zip code 19560 is 672 to 1. The ratio of registered sex offenders to all residents in this zip code is near the state average.
Median resident age:
This zip code:
41.7 years
Pennsylvania median age:
40.9 years
Average household size:
This zip code:
2.4 people
Pennsylvania:
2.4 people
Averages for the 2020 tax year for zip code 19560, filed in 2021:
Average Adjusted Gross Income (AGI) in 2020: $51,918 (Individual Income Tax Returns)
Here:
$51,918
State:
$75,707
Salary/wage: $47,337 (reported on 84.0% of returns)
Here:
$47,337
State:
$62,806
(% of AGI for various income ranges: 1086.2% for AGIs below $25k, 3625.1% for AGIs $25k-50k, 6343.5% for AGIs $50k-75k, 9224.5% for AGIs $75k-100k, 16646.1% for AGIs $100k-200k, 69025.0% for AGIs over 200k)
Taxable interest for individuals: $883 (reported on 21.8% of returns)
This zip code:
$883
Pennsylvania:
$1,633
(% of AGI for various income ranges: 16.1% for AGIs below $25k, 14.5% for AGIs $25k-50k, 18.6% for AGIs $50k-75k, 21.0% for AGIs $75k-100k, 88.6% for AGIs $100k-200k, 735.0% for AGIs over 200k)
Ordinary dividends: $2,854 (reported on 13.6% of returns)
Here:
$2,854
State:
$7,382
(% of AGI for various income ranges: 23.7% for AGIs below $25k, 21.4% for AGIs $25k-50k, 30.0% for AGIs $50k-75k, 69.2% for AGIs $75k-100k, 152.1% for AGIs $100k-200k, 2545.0% for AGIs over 200k)
Net capital gain/loss in AGI: +$7,316 (reported on 11.2% of returns)
Here:
+$7,316
State:
+$23,522
(% of AGI for various income ranges: 13.2% for AGIs below $25k, 15.3% for AGIs $25k-50k, 38.3% for AGIs $50k-75k, 126.2% for AGIs $75k-100k, 442.9% for AGIs $100k-200k, 8750.0% for AGIs over 200k)
Profit/loss from business: +$9,300 (reported on 10.4% of returns)
Here:
+$9,300
State:
+$16,274
(% of AGI for various income ranges: 53.0% for AGIs below $25k, 79.8% for AGIs $25k-50k, 173.9% for AGIs $50k-75k, 162.2% for AGIs $75k-100k, 500.4% for AGIs $100k-200k)
Taxable individual retirement arrangement distribution: $10,927 (reported on 8.2% of returns)
19560:
$10,927
Pennsylvania:
$18,583
(% of AGI for various income ranges: 75.5% for AGIs below $25k, 51.4% for AGIs $25k-50k, 108.7% for AGIs $50k-75k, 220.0% for AGIs $75k-100k, 496.8% for AGIs $100k-200k)
Total itemized deductions: $28,630 (reported on 4.6% of returns)
Here:
$28,630
State:
$34,850
(% of AGI for various income ranges: 126.9% for AGIs $25k-50k, 218.2% for AGIs $50k-75k, 210.0% for AGIs $75k-100k, 936.8% for AGIs $100k-200k)
Charity contributions: $5,919 (reported on 3.2% of returns)
Here:
$5,919
State:
$12,392
(% of AGI for various income ranges: 11.5% for AGIs $25k-50k, 33.1% for AGIs $50k-75k, 27.8% for AGIs $75k-100k, 163.6% for AGIs $100k-200k)
Taxes paid: $8,057 (reported on 4.6% of returns)
19560:
$8,057
State:
$8,200
(% of AGI for various income ranges: 28.1% for AGIs $25k-50k, 73.9% for AGIs $50k-75k, 87.5% for AGIs $75k-100k, 225.0% for AGIs $100k-200k)
Earned income credit: $2,133 (reported on 15.6% of returns)
Here:
$2,133
State:
$2,100
(% of AGI for various income ranges: 80.8% for AGIs below $25k, 65.2% for AGIs $25k-50k)
Percentage of individuals using paid preparers for their 2020 taxes: 94.2%
Here:
94%
State:
92%
(% for various income ranges: 92.6% for AGIs below $25k, 94.8% for AGIs $25k-50k, 94.6% for AGIs $50k-75k, 96.3% for AGIs $75k-100k, 93.6% for AGIs $100k-200k, 100.0% for AGIs over 200k)
Averages for the 2012 tax year for zip code 19560, filed in 2013:
Average Adjusted Gross Income (AGI) in 2012: $43,396 (Individual Income Tax Returns)
Here:
$43,396
State:
$61,346
Salary/wage: $41,399 (reported on 83.3% of returns)
Here:
$41,399
State:
$51,902
(% of AGI for various income ranges: 65.9% for AGIs below $25k, 83.2% for AGIs $25k-50k, 84.0% for AGIs $50k-75k, 83.5% for AGIs $75k-100k, 81.0% for AGIs $100k-200k, 56.2% for AGIs over 200k)
Taxable interest for individuals: $827 (reported on 32.9% of returns)
This zip code:
$827
Pennsylvania:
$1,588
(% of AGI for various income ranges: 1.2% for AGIs below $25k, 0.7% for AGIs $25k-50k, 0.5% for AGIs $50k-75k, 0.5% for AGIs $75k-100k, 0.3% for AGIs $100k-200k, 1.2% for AGIs over 200k)
Ordinary dividends: $2,317 (reported on 17.8% of returns)
Here:
$2,317
State:
$5,827
(% of AGI for various income ranges: 1.6% for AGIs below $25k, 0.7% for AGIs $25k-50k, 0.5% for AGIs $50k-75k, 0.7% for AGIs $75k-100k, 0.9% for AGIs $100k-200k, 3.4% for AGIs over 200k)
Net capital gain/loss in AGI: +$2,496 (reported on 11.8% of returns)
Here:
+$2,496
State:
+$14,495
(% of AGI for various income ranges: 0.3% for AGIs $75k-100k, 10.6% for AGIs over 200k)
Profit/loss from business: +$10,651 (reported on 10.9% of returns)
Here:
+$10,651
State:
+$16,268
(% of AGI for various income ranges: 6.0% for AGIs below $25k, 2.9% for AGIs $25k-50k, 2.2% for AGIs $50k-75k, 1.9% for AGIs $75k-100k, 2.5% for AGIs $100k-200k)
Taxable individual retirement arrangement distribution: $8,591 (reported on 10.9% of returns)
19560:
$8,591
Pennsylvania:
$14,550
(% of AGI for various income ranges: 4.9% for AGIs below $25k, 1.7% for AGIs $25k-50k, 1.6% for AGIs $50k-75k, 1.6% for AGIs $75k-100k, 3.0% for AGIs $100k-200k)
Total itemized deductions: $16,348 (22% of AGI, reported on 30.1% of returns)
Here:
$16,348
State:
$23,538
Here:
22.2% of AGI
State:
18.4% of AGI
(% of AGI for various income ranges: 7.9% for AGIs below $25k, 10.5% for AGIs $25k-50k, 11.7% for AGIs $50k-75k, 13.3% for AGIs $75k-100k, 12.6% for AGIs $100k-200k, 10.0% for AGIs over 200k)
Charity contributions: $1,840 (reported on 20.1% of returns)
Here:
$1,840
State:
$4,025
(% of AGI for various income ranges: 0.4% for AGIs below $25k, 0.6% for AGIs $25k-50k, 0.7% for AGIs $50k-75k, 1.0% for AGIs $75k-100k, 1.3% for AGIs $100k-200k, 1.3% for AGIs over 200k)
Taxes paid: $7,184 (reported on 30.1% of returns)
19560:
$7,184
State:
$9,982
(% of AGI for various income ranges: 2.3% for AGIs below $25k, 3.7% for AGIs $25k-50k, 6.1% for AGIs $50k-75k, 5.4% for AGIs $75k-100k, 6.3% for AGIs $100k-200k, 5.4% for AGIs over 200k)
Earned income credit: $2,131 (reported on 16.2% of returns)
Here:
$2,131
State:
$2,106
(% of AGI for various income ranges: 5.3% for AGIs below $25k, 0.9% for AGIs $25k-50k)
Percentage of individuals using paid preparers for their 2012 taxes: 56.0%
Here:
56%
State:
53%
(% for various income ranges: 52.6% for AGIs below $25k, 55.7% for AGIs $25k-50k, 59.2% for AGIs $50k-75k, 60.5% for AGIs $75k-100k, 59.3% for AGIs $100k-200k, 100.0% for AGIs over 200k)
Averages for the 2004 tax year for zip code 19560, filed in 2005:
Average Adjusted Gross Income (AGI) in 2004: $39,258 (Individual Income Tax Returns)
Here:
$39,258
State:
$48,049
Salary/wage: $36,094 (reported on 80.9% of returns)
Here:
$36,094
State:
$42,646
(% of AGI for various income ranges: 84.0% for AGIs below $10k, 63.5% for AGIs $10k-25k, 82.4% for AGIs $25k-50k, 83.6% for AGIs $50k-75k, 82.3% for AGIs $75k-100k, 53.1% for AGIs over 100k)
Taxable interest for individuals: $1,254 (reported on 52.0% of returns)
This zip code:
$1,254
Pennsylvania:
$1,657
(% of AGI for various income ranges: 7.7% for AGIs below $10k, 3.5% for AGIs $10k-25k, 1.5% for AGIs $25k-50k, 1.1% for AGIs $50k-75k, 1.0% for AGIs $75k-100k, 1.6% for AGIs over 100k)
Taxable dividends: $1,356 (reported on 28.6% of returns)
Here:
$1,356
State:
$3,566
(% of AGI for various income ranges: 4.4% for AGIs below $10k, 1.9% for AGIs $10k-25k, 0.9% for AGIs $25k-50k, 0.7% for AGIs $50k-75k, 0.7% for AGIs $75k-100k, 0.9% for AGIs over 100k)
Net capital gain/loss: +$8,618 (reported on 18.6% of returns)
Here:
+$8,618
State:
+$9,716
(% of AGI for various income ranges: -0.8% for AGIs below $10k, -0.2% for AGIs $10k-25k, 0.4% for AGIs $25k-50k, 0.8% for AGIs $50k-75k, 1.4% for AGIs $75k-100k, 16.9% for AGIs over 100k)
Profit/loss from business: +$11,667 (reported on 10.4% of returns)
Here:
+$11,667
State:
+$14,267
(% of AGI for various income ranges: 3.2% for AGIs below $10k, 4.6% for AGIs $10k-25k, 2.2% for AGIs $25k-50k, 2.3% for AGIs $50k-75k, 3.8% for AGIs $75k-100k, 3.8% for AGIs over 100k)
IRA payment deduction: $2,779 (reported on 2.6% of returns)
19560:
$2,779
Pennsylvania:
$2,903
(% of AGI for various income ranges: 0.2% for AGIs $10k-25k, 0.2% for AGIs $25k-50k, 0.3% for AGIs $50k-75k, 0.1% for AGIs over 100k)
Self-employed pension: $7,857 (reported on 0.4% of returns)
Here:
$7,857
Pennsylvania:
$14,674
Total itemized deductions: $13,898 (20% of AGI, reported on 29.3% of returns)
Here:
$13,898
State:
$18,804
Here:
20.5% of AGI
State:
19.5% of AGI
(% of AGI for various income ranges: 7.6% for AGIs below $10k, 9.5% for AGIs $10k-25k, 9.7% for AGIs $25k-50k, 11.7% for AGIs $50k-75k, 12.1% for AGIs $75k-100k, 9.2% for AGIs over 100k)
Charity contributions deductions: $1,609 (2% of AGI, reported on 23.8% of returns)
Here:
$1,609
State:
$3,337
Here:
2.2% of AGI
State:
3.3% of AGI
(% of AGI for various income ranges: 0.4% for AGIs below $10k, 0.7% for AGIs $10k-25k, 0.8% for AGIs $25k-50k, 1.1% for AGIs $50k-75k, 1.2% for AGIs $75k-100k, 1.1% for AGIs over 100k)
Total tax: $5,454 (reported on 75.2% of returns)
19560:
$5,454
State:
$8,008
(% of AGI for various income ranges: 2.2% for AGIs below $10k, 4.0% for AGIs $10k-25k, 7.3% for AGIs $25k-50k, 9.2% for AGIs $50k-75k, 11.0% for AGIs $75k-100k, 19.3% for AGIs over 100k)
Earned income credit: $1,393 (reported on 10.4% of returns)
Here:
$1,393
State:
$1,643
Percentage of individuals using paid preparers for their 2004 taxes: 59.3%
Here:
59%
State:
56%
(% for various income ranges: 50.0% for AGIs below $10k, 60.9% for AGIs $10k-25k, 60.6% for AGIs $25k-50k, 62.8% for AGIs $50k-75k, 58.1% for AGIs $75k-100k, 75.0% for AGIs over 100k)
Likely homosexual households (counted as self-reported same-sex unmarried-partner households)
Lesbian couples: 0.6% of all households
Gay men: 0.1% of all households
Household received Food Stamps/SNAP in the past 12 months: 377 Household did not receive Food Stamps/SNAP in the past 12 months: 3,377
Women who had a birth in the past 12 months: 70 (34 now married, 32 unmarried) Women who did not have a birth in the past 12 months: 1,925 (629 now married, 1,300 unmarried)
Housing units in zip code 19560 with a mortgage: 2,198 (148 second mortgage, 110 both second mortgage and home equity loan) Houses without a mortgage: 105
Median monthly owner costs for units with a mortgage: $1,432 Median monthly owner costs for units without a mortgage: $637
Residents with income below the poverty level in 2022:
This zip code:
7.2%
Whole state:
11.8%
Residents with income below 50% of the poverty level in 2022:
This zip code:
3.7%
Whole state:
6.1%
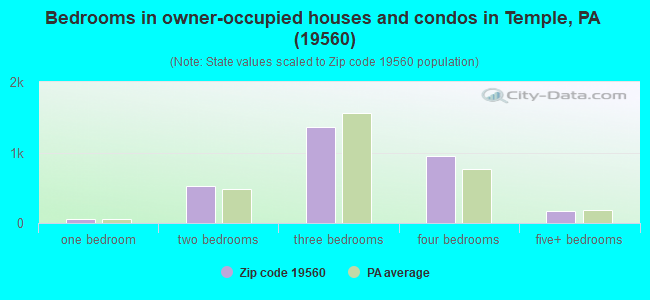
Median number of rooms in houses and condos:
Here:
6.4
State:
6.8
Median number of rooms in apartments:
Here:
4.3
State:
4.3
Notable locations in this zip code not listed on our city pages
Notable locations in zip code 19560: Rosedale Grove (A), Temple Station (B), Alsace Manor Fire Company (C), Alsace Township Municipal Building (D), Muhlenberg Township Municipal Building (E), Temple Fire Company 1 (F). Display/hide their locations on the map
Churches in zip code 19560 include: Unity Church of Reading (A), Shalters Church (B), Christ Evangelical Reformed Church (C). Display/hide their locations on the map
1,138 married couples with children.
735 single-parent households (59 men, 676 women).
79.1% of residents of 19560 zip code speak English at home.
14.7% of residents speak Spanish at home (51% very well, 32% well, 13% not well, 3% not at all).
3.5% of residents speak other Indo-European language at home (83% very well, 10% well, 3% not well, 3% not at all).
2.8% of residents speak Asian or Pacific Island language at home (83% very well, 17% well).
0.4% of residents speak other language at home (100% very well).
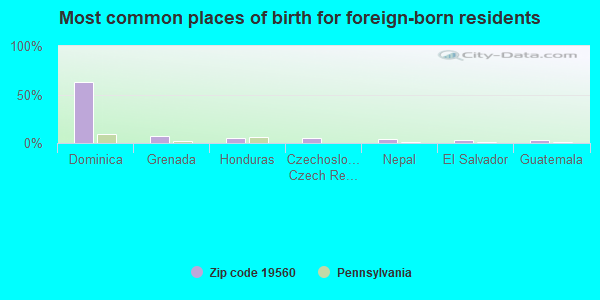
Foreign born population: 1,018 (11.1%) (69.9% of them are naturalized citizens)
This zip code:
11.1%
Whole state:
7.5%
63%Dominica
8%Grenada
6%Honduras
5%Czechoslovakia (includes Czech Republic and Slovakia)
4%Nepal
4%El Salvador
4%Guatemala
29%German
5%Italian
4%American
3%Polish
3%Pennsylvania German
3%Irish
2%Greek
Year of entry for the foreign-born population
8182010 or later
4242000 to 2009
1521990 to 1999
257Before 1990
Facilities with environmental interests located in this zip code:
BERKS PROD TEMPLE PLT (4410 5TH STREET HIGHWAY in TEMPLE, PA)
AIR MAJOR (AIRS/AFS) STATE MASTER (Pennsylvania database) - RCRIS-PAD081624421, HAZARDOUS WASTE PROGRAM, PCS-PAR213507, National Pollutant Discharge Elimination System Permit National Pollutant Discharge Elimination System NON-MAJOR (Tracking pollutant discharge elimination systems) - permit Small Quantity Generators, between 100 kg and 1000 kg of hazardous waste/month (Resource Conservation and Recovery Act (tracking hazardous waste)) - notification Business SIC classification: MINERALS AND EARTHS, GROUND OR OTHERWISE TREATED; LOCAL TRUCKING WITH STORAGE; CONSTRUCTION MATERIALS; GASOLINE SERVICE STATIONS Organizations: OPERNAME (CONTACT/OPERATOR)
, BERKS PRODUCT CORP (CONTACT/OWNER)
, BERKS PRODUCTS CORPORATION (OWNER/OPERATOR)
Alternative names: BERKS PROD CORP/MUHLENBERG
ALSACE TWP (65 WOODSIDE AVE in TEMPLE, PA)
STATE MASTER (Pennsylvania database) - PCS-PAG133501, National Pollutant Discharge Elimination System Permit National Pollutant Discharge Elimination System NON-MAJOR (Tracking pollutant discharge elimination systems) - permit Business SIC classification: SEWERAGE SYSTEMS Alternative names: ALSACE TWP MS4
BERKS PRODUCTS GARAGE (RTE 222 NORTH in TEMPLE, PA)
(Integrated Compliance Information System) - ICIS-03-1999-0114, FORMAL ENFORCEMENT ACTION Small Quantity Generators, between 100 kg and 1000 kg of hazardous waste/month (Resource Conservation and Recovery Act (tracking hazardous waste)) - notification Business SIC classification: READY-MIXED CONCRETE; LUMBER, PLYWOOD, MILLWORK, AND WOOD PANELS; FUEL OIL DEALERS Organizations: OPERNAME (CONTACT/OPERATOR)
, BERKS PRODUCT CORP (CONTACT/OWNER)
BERKS PROD CORP S TEMPLE QUARY (RT 222 in TEMPLE, PA)
(Integrated Compliance Information System) - ICIS-03-1998-0311, FORMAL ENFORCEMENT ACTION
BERKS TRAFFIC SERVICES INC (MAIDEN CREEK INDUST PARK RD in TEMPLE, PA)
Small Quantity Generators, between 100 kg and 1000 kg of hazardous waste/month (Resource Conservation and Recovery Act (tracking hazardous waste)) - notification Organizations: OPERNAME (CONTACT/OPERATOR)
, FINER, ROBERT (CONTACT/OWNER)
ARPRO INC (4700 NORTH 5TH ST HWY STE 101 in TEMPLE, PA)
Housing units lacking complete plumbing facilities: 0.3% Housing units lacking complete kitchen facilities: 0.4%
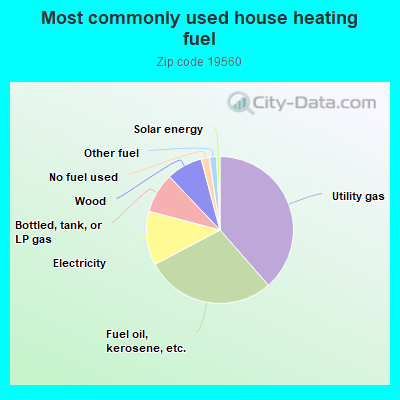
38.4%Utility gas
28.6%Fuel oil, kerosene, etc.
11.8%Electricity
8.8%Bottled, tank, or LP gas
7.9%Wood
1.8%No fuel used
1.6%Other fuel
0.7%Solar energy
Population in 1990: 7,503.
Place of birth for U.S.-born residents:
This state: 6,600
Northeast: 676
Midwest: 121
South: 97
West: 34
69% of the 19560 zip code residents lived in the same house 5 years ago. Out of people who lived in different houses, 82% lived in this county. Out of people who lived in different counties, 50% lived in Pennsylvania.
93% of the 19560 zip code residents lived in the same house 1 year ago. Out of people who lived in different houses, 71% moved from this county. Out of people who lived in different houses, 10% moved from different county within same state. Out of people who lived in different houses, 18% moved from different state. Out of people who lived in different houses, 1% moved from abroad.
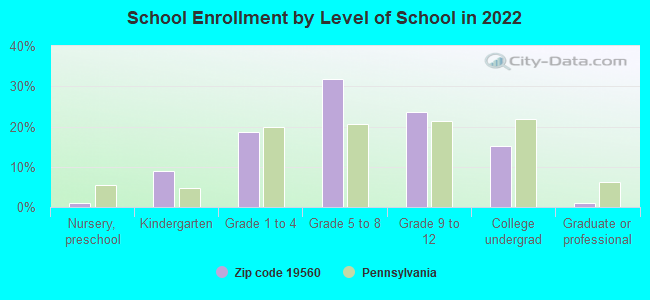
Private vs. public school enrollment:
Students in private schools in grades 1 to 8 (elementary and middle school): 149
Here:
13.7%
Pennsylvania:
15.7%
Students in private schools in grades 9 to 12 (high school): 46
Here:
9.1%
Pennsylvania:
13.4%
Students in private undergraduate colleges: 131
Here:
39.8%
Pennsylvania:
39.8%
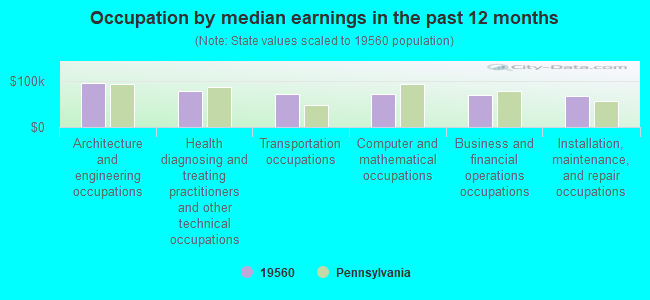
Occupation by median earnings in the past 12 months ($)
96,048Architecture and engineering occupations
78,746Health diagnosing and treating practitioners and other technical occupations
73,020Transportation occupations
72,044Computer and mathematical occupations
69,271Business and financial operations occupations
67,905Installation, maintenance, and repair occupations
Companies with federal contracts located in this zip code:
ELECTRIC COIL SERVICE INC (531 WATER ST in TEMPLE, PA; small business) : $131,770 in 9 contractsfrom 2000 to 2005
Contracts for Generators and Generators Sets, Electrical, Motors, Electrical, Wire and Cable, Electrical by Navy Signed by year:2000: $44,400; 2001: $0; 2002: $0; 2003: $0; 2004: $0; 2005: $87,370; 2006: $0.
Biggest contracts:
$44,400 with Navy for Generators and Generators Sets, Electrical. Signed on 2000-08-03. Completion date: 2000-09-30.
$20,595 with Navy for Motors, Electrical. Taking place in ME. Signed on 2005-08-08. Completion date: 2005-09-27.
$18,720 with Navy for Wire and Cable, Electrical. Signed on 2005-02-10. Completion date: 2005-03-22.
$13,730 with Navy for Motors, Electrical. Signed on 2005-08-12. Completion date: 2005-10-12.
Top industries in this zip code by the number of employees in 2005:
Administrative and Support and Waste Management and Remediation Services: Temporary Help Services (250-499 employees: 1 establishment, 50-99 employees: 1 establishment, 1-4 employees: 1 establishment)
2003 - 2018 National Fire Incident Reporting System (NFIRS) incidents
Based on the data from the years 2003 - 2018 the average number of fire incidents per year is 22. The highest number of fire incidents - 57 took place in 2009, and the least - 3 in 2011. The data has a dropping trend.
When looking into fire subcategories, the most incidents belonged to: Structure Fires (56.5%), and Outside Fires (17.4%).
Fire incident types reported to NFIRS in Zip Code 19560
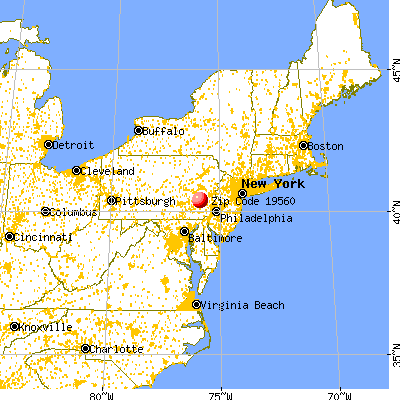


 Nearest zip codes: 19510, 19605, 19604, 19601, 19606, 19602.


 Based on the data from the years 2003 - 2018 the average number of fire incidents per year is 22. The highest number of fire incidents - 57 took place in 2009, and the least - 3 in 2011. The data has a dropping trend.
 When looking into fire subcategories, the most incidents belonged to: Structure Fires (56.5%), and Outside Fires (17.4%).