Estimated zip code population in 2022: 35,847 Zip code population in 2010: 34,416 Zip code population in 2000: 29,755
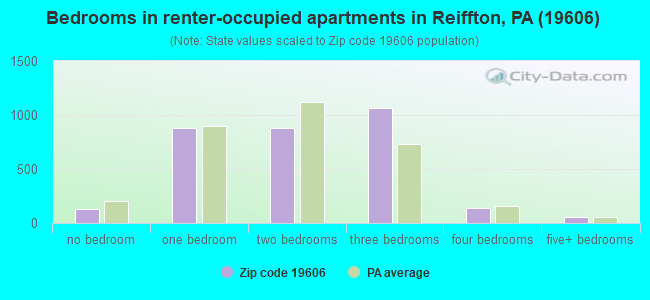
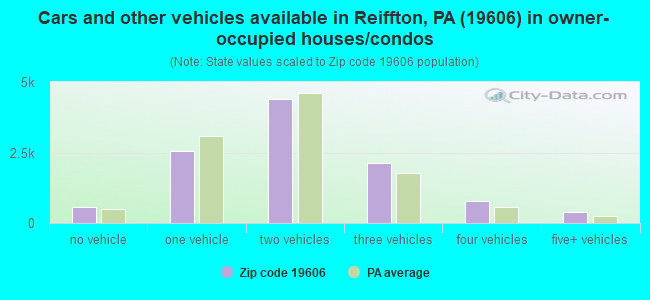
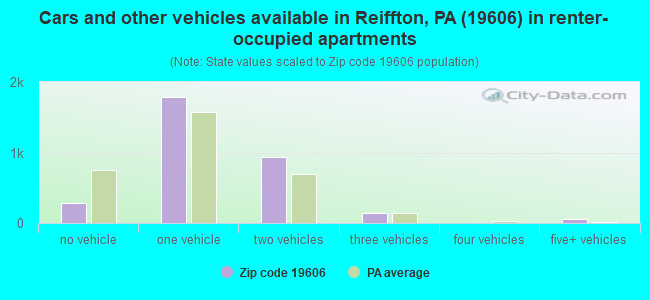
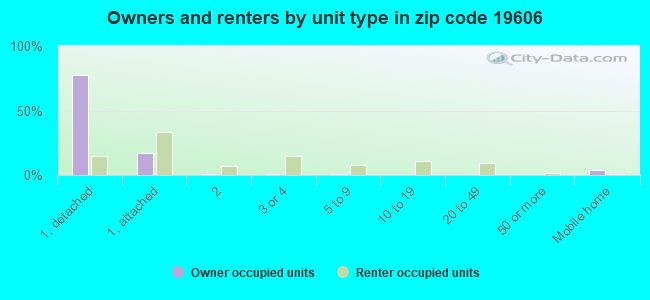
Houses and condos: 14,619 Renter-occupied apartments: 3,182
% of renters here:
23%
State:
31%
March 2022 cost of living index in zip code 19606: 96.0 (near average, U.S. average is 100)
Land area: 27.5 sq. mi. Water area: 0.3 sq. mi.
Population density: 1,304 people per square mile
(low).
OSM Map
General Map
Google Map
MSN Map
OSM Map
General Map
Google Map
MSN Map
OSM Map
General Map
Google Map
MSN Map
OSM Map
General Map
Google Map
MSN Map
Please wait while loading the map...
Real estate property taxes paid for housing units in 2022:
This zip code:
1.9% ($4,545)
Pennsylvania:
1.3% ($3,094)
Median real estate property taxes paid for housing units with mortgages in 2022: $4,767 (1.9%) Median real estate property taxes paid for housing units with no mortgage in 2022: $4,104 (2.0%)
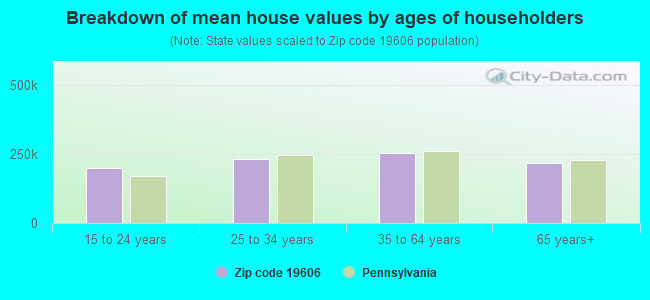
Estimated median house/condo value in 2022: $236,275
19606:
$236,275
Pennsylvania:
$245,500
According to our research of Pennsylvania and other state lists, there were 34 registered sex offenders living in 19606 zip code as of April 27, 2024. The ratio of all residents to sex offenders in zip code 19606 is 1,036 to 1. The ratio of registered sex offenders to all residents in this zip code is lower than the state average.
Median resident age:
This zip code:
41.3 years
Pennsylvania median age:
40.9 years
Average household size:
This zip code:
2.5 people
Pennsylvania:
2.4 people
Averages for the 2020 tax year for zip code 19606, filed in 2021:
Average Adjusted Gross Income (AGI) in 2020: $66,570 (Individual Income Tax Returns)
Here:
$66,570
State:
$75,707
Salary/wage: $58,795 (reported on 82.2% of returns)
Here:
$58,795
State:
$62,806
(% of AGI for various income ranges: 1021.1% for AGIs below $25k, 3364.5% for AGIs $25k-50k, 6037.8% for AGIs $50k-75k, 8940.8% for AGIs $75k-100k, 16607.7% for AGIs $100k-200k, 66535.7% for AGIs over 200k)
Taxable interest for individuals: $1,147 (reported on 28.8% of returns)
This zip code:
$1,147
Pennsylvania:
$1,633
(% of AGI for various income ranges: 22.4% for AGIs below $25k, 22.3% for AGIs $25k-50k, 35.7% for AGIs $50k-75k, 45.6% for AGIs $75k-100k, 83.8% for AGIs $100k-200k, 610.0% for AGIs over 200k)
Ordinary dividends: $3,847 (reported on 20.0% of returns)
Here:
$3,847
State:
$7,382
(% of AGI for various income ranges: 29.5% for AGIs below $25k, 36.1% for AGIs $25k-50k, 68.4% for AGIs $50k-75k, 103.4% for AGIs $75k-100k, 211.2% for AGIs $100k-200k, 2038.7% for AGIs over 200k)
Net capital gain/loss in AGI: +$12,379 (reported on 16.6% of returns)
Here:
+$12,379
State:
+$23,522
(% of AGI for various income ranges: 13.4% for AGIs below $25k, 28.0% for AGIs $25k-50k, 48.1% for AGIs $50k-75k, 119.7% for AGIs $75k-100k, 362.3% for AGIs $100k-200k, 11429.6% for AGIs over 200k)
Profit/loss from business: +$14,369 (reported on 11.5% of returns)
Here:
+$14,369
State:
+$16,274
(% of AGI for various income ranges: 82.0% for AGIs below $25k, 100.1% for AGIs $25k-50k, 144.5% for AGIs $50k-75k, 287.2% for AGIs $75k-100k, 393.4% for AGIs $100k-200k, 3858.3% for AGIs over 200k)
Taxable individual retirement arrangement distribution: $16,866 (reported on 11.4% of returns)
19606:
$16,866
Pennsylvania:
$18,583
(% of AGI for various income ranges: 92.0% for AGIs below $25k, 119.8% for AGIs $25k-50k, 207.2% for AGIs $50k-75k, 299.0% for AGIs $75k-100k, 705.8% for AGIs $100k-200k, 2326.1% for AGIs over 200k)
Self-employed (Keogh) retirement plans: $21,200 (reported on 0.3% of returns)
19606:
$21,200
Pennsylvania:
$25,407
(% of AGI for various income ranges: 24.2% for AGIs $75k-100k, 408.7% for AGIs over 200k)
Total itemized deductions: $27,187 (reported on 6.3% of returns)
Here:
$27,187
State:
$34,850
(% of AGI for various income ranges: 55.9% for AGIs below $25k, 94.5% for AGIs $25k-50k, 250.9% for AGIs $50k-75k, 319.0% for AGIs $75k-100k, 465.6% for AGIs $100k-200k, 2984.3% for AGIs over 200k)
Charity contributions: $8,075 (reported on 4.5% of returns)
Here:
$8,075
State:
$12,392
(% of AGI for various income ranges: 2.0% for AGIs below $25k, 11.6% for AGIs $25k-50k, 32.0% for AGIs $50k-75k, 53.4% for AGIs $75k-100k, 99.0% for AGIs $100k-200k, 1214.3% for AGIs over 200k)
Taxes paid: $7,926 (reported on 6.3% of returns)
19606:
$7,926
State:
$8,200
(% of AGI for various income ranges: 8.6% for AGIs below $25k, 25.6% for AGIs $25k-50k, 82.8% for AGIs $50k-75k, 113.1% for AGIs $75k-100k, 147.6% for AGIs $100k-200k, 712.6% for AGIs over 200k)
Earned income credit: $2,101 (reported on 11.9% of returns)
Here:
$2,101
State:
$2,100
(% of AGI for various income ranges: 69.5% for AGIs below $25k, 56.8% for AGIs $25k-50k, 0.5% for AGIs $50k-75k)
Percentage of individuals using paid preparers for their 2020 taxes: 93.1%
Here:
93%
State:
92%
(% for various income ranges: 91.2% for AGIs below $25k, 93.9% for AGIs $25k-50k, 93.4% for AGIs $50k-75k, 93.1% for AGIs $75k-100k, 94.2% for AGIs $100k-200k, 95.5% for AGIs over 200k)
Averages for the 2012 tax year for zip code 19606, filed in 2013:
Average Adjusted Gross Income (AGI) in 2012: $56,249 (Individual Income Tax Returns)
Here:
$56,249
State:
$61,346
Salary/wage: $51,767 (reported on 83.6% of returns)
Here:
$51,767
State:
$51,902
(% of AGI for various income ranges: 67.3% for AGIs below $25k, 78.7% for AGIs $25k-50k, 78.6% for AGIs $50k-75k, 80.6% for AGIs $75k-100k, 80.9% for AGIs $100k-200k, 64.3% for AGIs over 200k)
Taxable interest for individuals: $1,070 (reported on 38.0% of returns)
This zip code:
$1,070
Pennsylvania:
$1,588
(% of AGI for various income ranges: 1.7% for AGIs below $25k, 0.8% for AGIs $25k-50k, 0.7% for AGIs $50k-75k, 0.5% for AGIs $75k-100k, 0.5% for AGIs $100k-200k, 0.8% for AGIs over 200k)
Ordinary dividends: $3,134 (reported on 23.9% of returns)
Here:
$3,134
State:
$5,827
(% of AGI for various income ranges: 2.1% for AGIs below $25k, 1.0% for AGIs $25k-50k, 1.0% for AGIs $50k-75k, 0.9% for AGIs $75k-100k, 1.1% for AGIs $100k-200k, 2.8% for AGIs over 200k)
Net capital gain/loss in AGI: +$4,314 (reported on 16.1% of returns)
Here:
+$4,314
State:
+$14,495
(% of AGI for various income ranges: 0.2% for AGIs $25k-50k, 0.2% for AGIs $50k-75k, 0.3% for AGIs $75k-100k, 1.0% for AGIs $100k-200k, 6.4% for AGIs over 200k)
Profit/loss from business: +$15,049 (reported on 11.8% of returns)
Here:
+$15,049
State:
+$16,268
(% of AGI for various income ranges: 5.9% for AGIs below $25k, 3.0% for AGIs $25k-50k, 2.5% for AGIs $50k-75k, 2.0% for AGIs $75k-100k, 2.7% for AGIs $100k-200k, 5.3% for AGIs over 200k)
Taxable individual retirement arrangement distribution: $12,322 (reported on 13.0% of returns)
19606:
$12,322
Pennsylvania:
$14,550
(% of AGI for various income ranges: 5.0% for AGIs below $25k, 2.8% for AGIs $25k-50k, 2.8% for AGIs $50k-75k, 2.5% for AGIs $75k-100k, 2.7% for AGIs $100k-200k, 2.4% for AGIs over 200k)
Self-employment retirement plans: $16,738 (reported on 0.5% of returns)
19606:
$16,738
Pennsylvania:
$20,922
(% of AGI for various income ranges: 0.2% for AGIs $25k-50k, 0.1% for AGIs $100k-200k, 0.6% for AGIs over 200k)
Total itemized deductions: $19,557 (20% of AGI, reported on 38.3% of returns)
Here:
$19,557
State:
$23,538
Here:
20.5% of AGI
State:
18.4% of AGI
(% of AGI for various income ranges: 10.2% for AGIs below $25k, 10.6% for AGIs $25k-50k, 13.8% for AGIs $50k-75k, 14.5% for AGIs $75k-100k, 15.1% for AGIs $100k-200k, 11.8% for AGIs over 200k)
Charity contributions: $2,553 (reported on 30.2% of returns)
Here:
$2,553
State:
$4,025
(% of AGI for various income ranges: 0.6% for AGIs below $25k, 0.7% for AGIs $25k-50k, 1.2% for AGIs $50k-75k, 1.3% for AGIs $75k-100k, 1.6% for AGIs $100k-200k, 2.1% for AGIs over 200k)
Taxes paid: $8,828 (reported on 38.2% of returns)
19606:
$8,828
State:
$9,982
(% of AGI for various income ranges: 3.3% for AGIs below $25k, 3.9% for AGIs $25k-50k, 5.7% for AGIs $50k-75k, 6.5% for AGIs $75k-100k, 7.4% for AGIs $100k-200k, 6.3% for AGIs over 200k)
Earned income credit: $2,125 (reported on 12.5% of returns)
Here:
$2,125
State:
$2,106
(% of AGI for various income ranges: 4.9% for AGIs below $25k, 0.8% for AGIs $25k-50k)
Percentage of individuals using paid preparers for their 2012 taxes: 50.5%
Here:
51%
State:
53%
(% for various income ranges: 47.2% for AGIs below $25k, 50.0% for AGIs $25k-50k, 54.0% for AGIs $50k-75k, 51.1% for AGIs $75k-100k, 52.9% for AGIs $100k-200k, 68.6% for AGIs over 200k)
Averages for the 2004 tax year for zip code 19606, filed in 2005:
Average Adjusted Gross Income (AGI) in 2004: $47,936 (Individual Income Tax Returns)
Here:
$47,936
State:
$48,049
Salary/wage: $44,583 (reported on 84.9% of returns)
Here:
$44,583
State:
$42,646
(% of AGI for various income ranges: 96.5% for AGIs below $10k, 67.5% for AGIs $10k-25k, 81.4% for AGIs $25k-50k, 85.0% for AGIs $50k-75k, 85.2% for AGIs $75k-100k, 71.3% for AGIs over 100k)
Taxable interest for individuals: $1,511 (reported on 53.8% of returns)
This zip code:
$1,511
Pennsylvania:
$1,657
(% of AGI for various income ranges: 8.3% for AGIs below $10k, 3.6% for AGIs $10k-25k, 1.4% for AGIs $25k-50k, 1.0% for AGIs $50k-75k, 1.0% for AGIs $75k-100k, 2.1% for AGIs over 100k)
Taxable dividends: $2,064 (reported on 31.2% of returns)
Here:
$2,064
State:
$3,566
(% of AGI for various income ranges: 5.6% for AGIs below $10k, 2.1% for AGIs $10k-25k, 1.0% for AGIs $25k-50k, 0.9% for AGIs $50k-75k, 1.1% for AGIs $75k-100k, 1.7% for AGIs over 100k)
Net capital gain/loss: +$4,082 (reported on 22.3% of returns)
Here:
+$4,082
State:
+$9,716
(% of AGI for various income ranges: -1.9% for AGIs below $10k, 0.5% for AGIs $10k-25k, 0.4% for AGIs $25k-50k, 0.4% for AGIs $50k-75k, 1.0% for AGIs $75k-100k, 4.8% for AGIs over 100k)
Profit/loss from business: +$15,448 (reported on 11.5% of returns)
Here:
+$15,448
State:
+$14,267
(% of AGI for various income ranges: 3.8% for AGIs below $10k, 5.2% for AGIs $10k-25k, 3.3% for AGIs $25k-50k, 2.4% for AGIs $50k-75k, 2.5% for AGIs $75k-100k, 5.2% for AGIs over 100k)
IRA payment deduction: $2,920 (reported on 3.0% of returns)
19606:
$2,920
Pennsylvania:
$2,903
(% of AGI for various income ranges: 0.3% for AGIs $10k-25k, 0.4% for AGIs $25k-50k, 0.2% for AGIs $50k-75k, 0.1% for AGIs $75k-100k, 0.1% for AGIs over 100k)
Self-employed pension: $12,129 (reported on 0.8% of returns)
Here:
$12,129
Pennsylvania:
$14,674
(% of AGI for various income ranges: 0.1% for AGIs $10k-25k, 0.0% for AGIs $25k-50k, 0.1% for AGIs $50k-75k, 0.1% for AGIs $75k-100k, 0.5% for AGIs over 100k)
Total itemized deductions: $16,544 (20% of AGI, reported on 39.3% of returns)
Here:
$16,544
State:
$18,804
Here:
20.4% of AGI
State:
19.5% of AGI
(% of AGI for various income ranges: 11.6% for AGIs below $10k, 10.1% for AGIs $10k-25k, 11.5% for AGIs $25k-50k, 14.3% for AGIs $50k-75k, 15.5% for AGIs $75k-100k, 14.0% for AGIs over 100k)
Charity contributions deductions: $2,271 (3% of AGI, reported on 34.1% of returns)
Here:
$2,271
State:
$3,337
Here:
2.7% of AGI
State:
3.3% of AGI
(% of AGI for various income ranges: 0.7% for AGIs below $10k, 0.8% for AGIs $10k-25k, 1.0% for AGIs $25k-50k, 1.3% for AGIs $50k-75k, 1.7% for AGIs $75k-100k, 2.3% for AGIs over 100k)
Total tax: $6,845 (reported on 78.8% of returns)
19606:
$6,845
State:
$8,008
(% of AGI for various income ranges: 2.5% for AGIs below $10k, 4.4% for AGIs $10k-25k, 7.4% for AGIs $25k-50k, 8.7% for AGIs $50k-75k, 10.1% for AGIs $75k-100k, 17.9% for AGIs over 100k)
Earned income credit: $1,571 (reported on 8.8% of returns)
Here:
$1,571
State:
$1,643
Percentage of individuals using paid preparers for their 2004 taxes: 52.8%
Here:
53%
State:
56%
(% for various income ranges: 47.1% for AGIs below $10k, 54.1% for AGIs $10k-25k, 53.5% for AGIs $25k-50k, 53.4% for AGIs $50k-75k, 52.0% for AGIs $75k-100k, 59.4% for AGIs over 100k)
Likely homosexual households (counted as self-reported same-sex unmarried-partner households)
Lesbian couples: 0.5% of all households
Gay men: 0.1% of all households
Household received Food Stamps/SNAP in the past 12 months: 1,831 Household did not receive Food Stamps/SNAP in the past 12 months: 12,194
Women who had a birth in the past 12 months: 364 (147 now married, 193 unmarried) Women who did not have a birth in the past 12 months: 7,750 (3,276 now married, 4,466 unmarried)
Housing units in zip code 19606 with a mortgage: 6,840 (1,024 second mortgage, 13 home equity loan, 839 both second mortgage and home equity loan) Houses without a mortgage: 327
Median monthly owner costs for units with a mortgage: $1,686 Median monthly owner costs for units without a mortgage: $673
Residents with income below the poverty level in 2022:
This zip code:
9.7%
Whole state:
11.8%
Residents with income below 50% of the poverty level in 2022:
This zip code:
4.9%
Whole state:
6.1%
Median number of rooms in houses and condos:
Here:
7.1
State:
6.8
Median number of rooms in apartments:
Here:
4.7
State:
4.3
Notable locations in this zip code not listed on our city pages
Notable locations in zip code 19606: Exeter Public Golf Course (A), Reading Country Club (B), Exeter Township Wastewater Treatment Plant (C), Black Bear (D), Exeter Industrial Park (E), Exeter Plaza (F), Lincoln Corporate Center (G), Shelbourne Square (H), Trout Run Recycling Complex (I), Spies Church (J), Camp Jolly (K), Berks Emergency Strike Team (L), Mount Penn Borough Hall (M), Exeter Township School District Administration Building (N), Exeter Ambulance Association (O), Antietam Arms Apartments (P), Antietam School District Administrative Office (Q), Beverly Manor (R), Carsonia Manor Apartments (S), Central Berks Regional Police Department (T). Display/hide their locations on the map
Churches in zip code 19606 include: Trinity United Church of Christ (A), Saint Matthews United Methodist Church (B), Saint Catherine of Siena Roman Catholic Church (C), Saint Catherine of Siena Catholic Church (D), Reformation Evangelical Lutheran Church (E), Schwarzwald Church (F), Pennside Presbyterian Church (G), Community United Church of Christ (H), Bethany Lutheran Church (I). Display/hide their locations on the map
Cemeteries: Aulenbach Cemetery (1), Schwarzwald Cemetery (2), Young-Kissling Cemetery (3), Zion (Spies) Cemetery (4), Forest Hills Cemetery (5). Display/hide their locations on the map
Reservoirs: Antietam Reservoir (A), Egelman Lake (B), Carsonia Lake (C), Antietam Valley Pool (D), Fire Lake (E), Hinnerskiz Basin (F), Egelman Basin (G). Display/hide their locations on the map
Parks in zip code 19606 include: Lorane Hollow Park (1), Saint Lawrence Playground (2), Exeter Township Community Park (3), Crestwood Recreation Area (4), Central Catholic Field (5), Carsonia Park (6), Antietam Valley Recreation and Community Center (7), Farming Ridge Park (8), Pendora Park (9). Display/hide their locations on the map
4,491 married couples with children.
2,488 single-parent households (919 men, 1,569 women).
85.5% of residents of 19606 zip code speak English at home.
12.0% of residents speak Spanish at home (60% very well, 23% well, 13% not well, 4% not at all).
1.8% of residents speak other Indo-European language at home (70% very well, 26% well, 3% not well).
0.6% of residents speak Asian or Pacific Island language at home (65% very well, 18% well, 17% not well).
0.3% of residents speak other language at home (100% very well).
Foreign born population: 2,413 (6.7%) (70.8% of them are naturalized citizens)
This zip code:
6.7%
Whole state:
7.5%
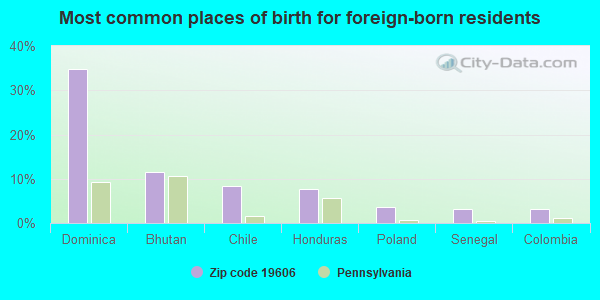
35%Dominica
11%Bhutan
8%Chile
8%Honduras
4%Poland
3%Senegal
3%Colombia
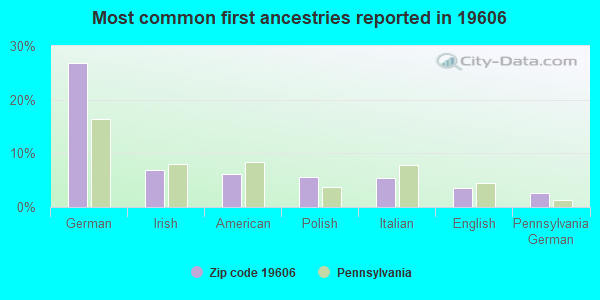
27%German
7%Irish
6%American
6%Polish
5%Italian
4%English
3%Pennsylvania German
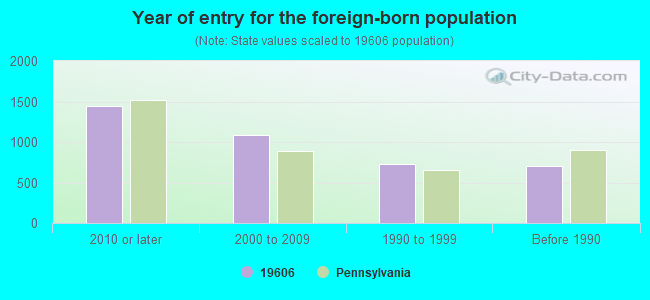
Year of entry for the foreign-born population
1,4452010 or later
1,0812000 to 2009
7341990 to 1999
708Before 1990
Facilities with environmental interests located in this zip code:
BERKS CNTY INTERMEDIATE UNIT (2900 SAINT LAWRENCE AVE in READING, PA)
(Integrated Compliance Information System) - ICIS-03-1989-0808, FORMAL ENFORCEMENT ACTION COMPLIANCE ACTIVITY (Tracking inspections of insecticide, fungicide, and rodenticide, and toxic substances) STATE MASTER (Pennsylvania database) - RCRIS-PAD010580041, HAZARDOUS WASTE PROGRAM (Resource Conservation and Recovery Act (tracking hazardous waste)) Business SIC classification: ELEMENTARY AND SECONDARY SCHOOLS Organizations: OPERNAME (CONTACT/OPERATOR)
, YARDLEY ASSOCIATES (CONTACT/OWNER)
ANTIETAM VALLEY MUNICIPAL AUTH (200 N 25TH ST in READING, PA)
ENFORCEMENT/COMPLIANCE ACTIVITY (Integrated Compliance Information System) - ICIS-03-1989-1467, FORMAL ENFORCEMENT ACTION (Integrated Compliance Information System) - ICIS-03-1989-1467, FORMAL ENFORCEMENT ACTION
ATLANTIC SVC STA (4621 PERKIOMEN AVE-TANKS in READING, PA)
STATE MASTER (Pennsylvania database) - RCRIS-PAD987348158, HAZARDOUS WASTE PROGRAM Conditionally Exempt Small Quantity Generators, less than 100 kg/month of hazardous waste (Resource Conservation and Recovery Act (tracking hazardous waste)) - notification Organizations: OPERNAME (CONTACT/OPERATOR)
, ATLANTIC REFINING & MARKETING (CONTACT/OWNER)
, ATLANTIC REFINING & MARKETING CORPORATION (CONTACT/OWNER)
ANTIETAM MS/HS (100 ANTIETAM RD in READING, PA)
(Geographic Names Information System) (National Center for Education Statistics) - STATE ID-0820 Organizations: ANTIETAM SD (SCHOOL DISTRICT)
Alternative names: ANTIETAM SCHOOL
ANTIETAM VALLEY MUN AUTH (WWTP in READING, PA)
National Pollutant Discharge Elimination System MAJOR (Tracking pollutant discharge elimination systems) - permit National Pollutant Discharge Elimination System NON-MAJOR (Tracking pollutant discharge elimination systems) - permit National Pollutant Discharge Elimination System NON-MAJOR (Tracking pollutant discharge elimination systems) - permit Business SIC classification: SEWERAGE SYSTEMS Alternative names: ANTIETAM VALLEY MUNIC AUTH, ANTIETAM VALLEY MUNICIPAL AUTHORITY, ANTIETEM VALLEY MUNICIPAL AUTH
ADAMS DRY CLEANERS (436 S 18TH ST in READING, PA)
AIR MINOR (AIRS/AFS) Conditionally Exempt Small Quantity Generators, less than 100 kg/month of hazardous waste (Resource Conservation and Recovery Act (tracking hazardous waste)) - notification Business SIC classification: DRYCLEANING PLANTS, EXCEPT RUG CLEANING Organizations: VARADY MARK (CONTACT/OWNER)
Alternative names: ADAMS DRY CLNRS
ALLOY PIPING SPECIALITIES INC (812 BYRAM ST in READING, PA)
ANTIETAM SCHOOL DISTRICT (100 ANTIETAM ROAD in READING, PA)
COMPLIANCE ACTIVITY (Tracking inspections of insecticide, fungicide, and rodenticide, and toxic substances) Alternative names: ANTIETAM S.D. 1, ANTIETAM S.D.- JR/SR HIGH SCHOOL
Housing units lacking complete plumbing facilities: 0.8% Housing units lacking complete kitchen facilities: 1.3%
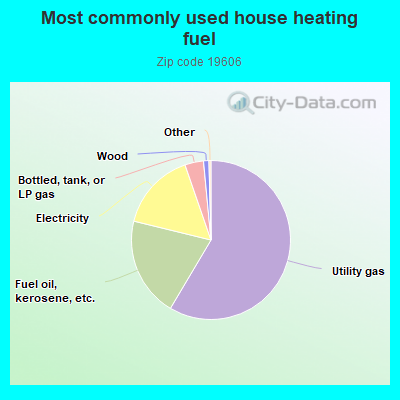
58.6%Utility gas
20.3%Fuel oil, kerosene, etc.
15.9%Electricity
3.8%Bottled, tank, or LP gas
1.1%Wood
Population in 1990: 27,732. Population change in the 1990s: +2,023 (+7.3%).
Place of birth for U.S.-born residents:
This state: 25,897
Northeast: 3,546
Midwest: 647
South: 1,419
West: 324
67% of the 19606 zip code residents lived in the same house 5 years ago. Out of people who lived in different houses, 73% lived in this county. Out of people who lived in different counties, 50% lived in Pennsylvania.
91% of the 19606 zip code residents lived in the same house 1 year ago. Out of people who lived in different houses, 64% moved from this county. Out of people who lived in different houses, 15% moved from different county within same state. Out of people who lived in different houses, 17% moved from different state. Out of people who lived in different houses, 4% moved from abroad.
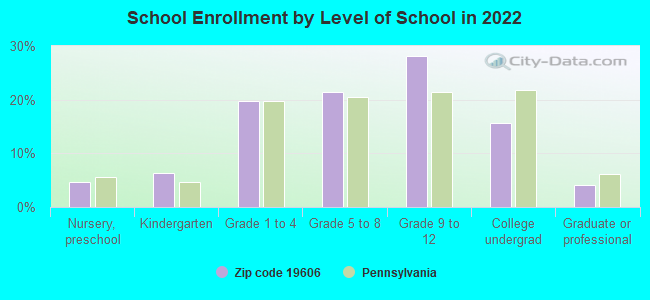
Private vs. public school enrollment:
Students in private schools in grades 1 to 8 (elementary and middle school): 693
Here:
18.6%
Pennsylvania:
15.7%
Students in private schools in grades 9 to 12 (high school): 369
Here:
14.4%
Pennsylvania:
13.4%
Students in private undergraduate colleges: 324
Here:
22.8%
Pennsylvania:
39.8%
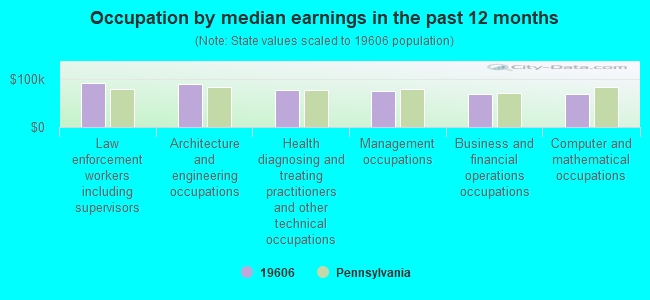
Occupation by median earnings in the past 12 months ($)
92,285Law enforcement workers including supervisors
90,890Architecture and engineering occupations
77,758Health diagnosing and treating practitioners and other technical occupations
75,706Management occupations
68,683Business and financial operations occupations
68,405Computer and mathematical occupations
Companies with federal contracts located in this zip code (READING, PA):
POLLOCK RESEARCH & DESIGN INC (11 VANGUARD DR; small business) : $2,487,573 in 27 contractsfrom 2002 to 2006
Contracts for Winches, Hoists, Cranes, and Derricks, Inspection Services (including commercial testing and lab services, except medical/dental) -- Materials Handling Equipment, Laboratory Testing Services, Inspection Services (including commercial testing and lab services, except medical/dental) -- Maintenance and Repair Shop Equipment, and moreby Army, Bureau of Engraving and Printing, Air Force, U.S. Coast Guard, and others Signed by year:2000: $0; 2001: $0; 2002: -$130; 2003: $239,755; 2004: $92,374; 2005: $478,905; 2006: $1,676,669.
Biggest contracts:
$814,513 with Army for Winches, Hoists, Cranes, and Derricks. Taking place in MD. Signed on 2006-04-12. Completion date: 2005-11-30.
$519,909 with Army for Winches, Hoists, Cranes, and Derricks. Signed on 2006-06-30. Completion date: 2007-06-29.
$354,220 with Army for Winches, Hoists, Cranes, and Derricks. Taking place in MD. Signed on 2005-09-29. Completion date: 2005-11-30.
$280,814 with Army for Inspection Services (including commercial testing and lab services, except medical/dental) -- Materials Handling Equipment. Taking place in TX. Signed on 2006-03-01. Completion date: 2006-01-31.
CERATECH INC (1 BIRCHMONT DR; small business)
$99,525 with Air Force for Miscellaneous Construction Materials. Taking place in VA. Signed on 2006-01-24. Completion date: 2006-02-13.
LUDGATE ENGINEERING CORP (LINCOLN CORPORATE CENTER; small business) : $15,900 in 2 contractsin 2003
$7,950 with Army for Land Surveys, Cadastral Services (non-construction). Taking place in MD. Signed on 2003-11-21. Completion date: 2004-01-31.
$7,950 with U.S. Army Corps of Engineers - civil program financing only for Land Surveys, Cadastral Services (non-construction). Taking place in MD. Signed on 2003-11-21. Completion date: 2004-01-31.
PENNCRAFT ENTERPRISES INC (541 S 18 1/2 ST)
$10,375 with Defense Logistics Agency for Miscellaneous Items. Taking place in NC. Signed on 2005-05-23. Completion date: 2005-06-02.
EXETER SUPPLY CO INC (117 PROSPECT ST; small business)
$8,127 with Army for Valves, Powered. Signed on 2003-04-11. Completion date: 2003-05-12.
Top industries in this zip code by the number of employees in 2005:
2003 - 2018 National Fire Incident Reporting System (NFIRS) incidents
According to the data from the years 2003 - 2018 the average number of fires per year is 118. The highest number of reported fire incidents - 265 took place in 2016, and the least - 0 in 2011. The data has a rising trend.
When looking into fire subcategories, the most reports belonged to: Structure Fires (61.4%), and Outside Fires (25.3%).
Fire incident types reported to NFIRS in Zip Code 19606

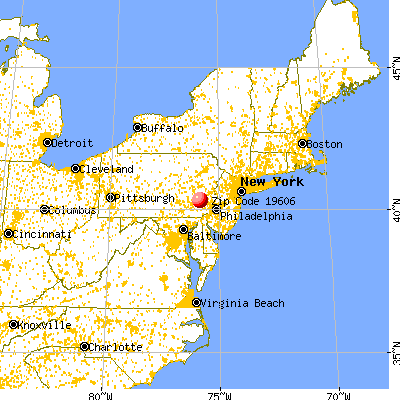


 Nearest zip codes: 19535, 19604, 19602, 19560, 19508, 19601.


 According to the data from the years 2003 - 2018 the average number of fires per year is 118. The highest number of reported fire incidents - 265 took place in 2016, and the least - 0 in 2011. The data has a rising trend.
 When looking into fire subcategories, the most reports belonged to: Structure Fires (61.4%), and Outside Fires (25.3%).