Estimated zip code population in 2022: 21,265 Zip code population in 2010: 17,529 Zip code population in 2000: 14,258
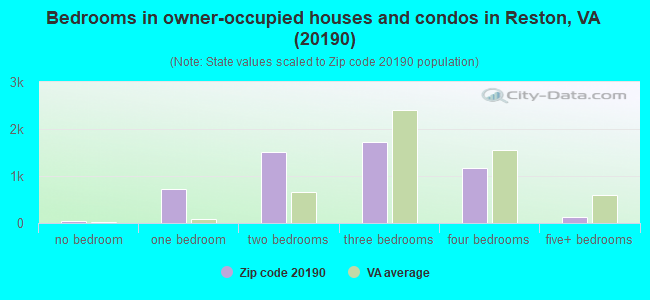
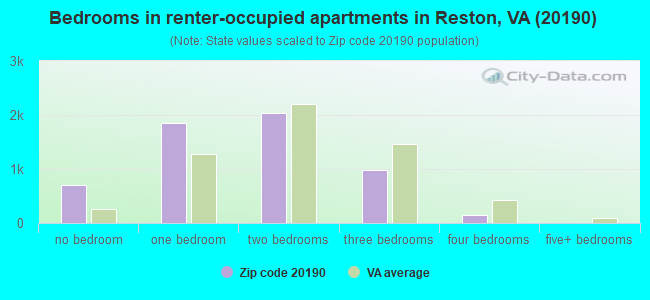
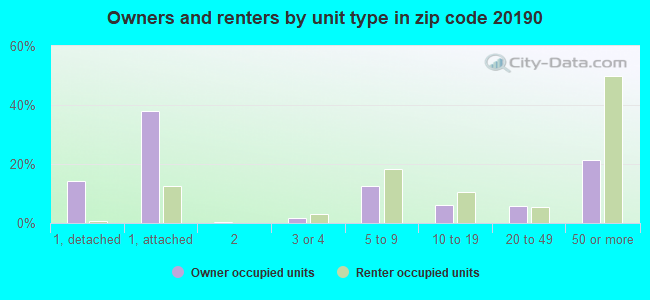
Houses and condos: 11,928 Renter-occupied apartments: 5,650
% of renters here:
52%
State:
33%
March 2022 cost of living index in zip code 20190: 165.7 (very high, U.S. average is 100)
Land area: 4.5 sq. mi. Water area: 0.1 sq. mi.
Population density: 4,719 people per square mile
(average).
OSM Map
General Map
Google Map
MSN Map
OSM Map
General Map
Google Map
MSN Map
OSM Map
General Map
Google Map
MSN Map
OSM Map
General Map
Google Map
MSN Map
Please wait while loading the map...
Real estate property taxes paid for housing units in 2022:
This zip code:
1.0% ($5,820)
Virginia:
0.7% ($2,617)
Median real estate property taxes paid for housing units with mortgages in 2022: $5,594 (0.9%) Median real estate property taxes paid for housing units with no mortgage in 2022: $6,450 (1.1%)
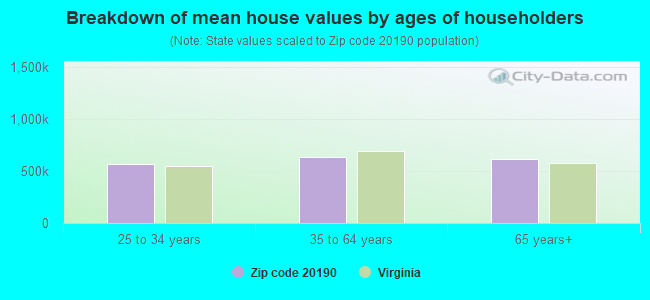
Estimated median house/condo value in 2022: $605,805
20190:
$605,805
Virginia:
$365,700
According to our research of Virginia and other state lists, there were 6 registered sex offenders living in 20190 zip code as of April 27, 2024. The ratio of all residents to sex offenders in zip code 20190 is 3,171 to 1. The ratio of registered sex offenders to all residents in this zip code is much lower than the state average.
Median resident age:
This zip code:
40.9 years
Virginia median age:
39.0 years
Average household size:
This zip code:
1.9 people
Virginia:
2.5 people
Averages for the 2020 tax year for zip code 20190, filed in 2021:
Average Adjusted Gross Income (AGI) in 2020: $121,365 (Individual Income Tax Returns)
Here:
$121,365
State:
$86,446
Salary/wage: $104,623 (reported on 83.3% of returns)
Here:
$104,623
State:
$71,185
(% of AGI for various income ranges: 1145.1% for AGIs below $25k, 3808.0% for AGIs $25k-50k, 6842.2% for AGIs $50k-75k, 10433.5% for AGIs $75k-100k, 19626.4% for AGIs $100k-200k, 83648.8% for AGIs over 200k)
Taxable interest for individuals: $2,413 (reported on 41.7% of returns)
This zip code:
$2,413
Virginia:
$1,805
(% of AGI for various income ranges: 23.0% for AGIs below $25k, 21.1% for AGIs $25k-50k, 53.8% for AGIs $50k-75k, 49.0% for AGIs $75k-100k, 123.8% for AGIs $100k-200k, 1531.0% for AGIs over 200k)
Ordinary dividends: $8,721 (reported on 35.5% of returns)
Here:
$8,721
State:
$8,327
(% of AGI for various income ranges: 42.9% for AGIs below $25k, 71.2% for AGIs $25k-50k, 141.7% for AGIs $50k-75k, 182.8% for AGIs $75k-100k, 478.6% for AGIs $100k-200k, 4454.9% for AGIs over 200k)
Net capital gain/loss in AGI: +$23,159 (reported on 33.7% of returns)
Here:
+$23,159
State:
+$24,644
(% of AGI for various income ranges: 29.2% for AGIs below $25k, 66.4% for AGIs $25k-50k, 121.9% for AGIs $50k-75k, 168.3% for AGIs $75k-100k, 647.7% for AGIs $100k-200k, 14701.8% for AGIs over 200k)
Profit/loss from business: +$20,627 (reported on 17.9% of returns)
Here:
+$20,627
State:
+$12,836
(% of AGI for various income ranges: 209.8% for AGIs below $25k, 243.4% for AGIs $25k-50k, 243.0% for AGIs $50k-75k, 225.8% for AGIs $75k-100k, 576.3% for AGIs $100k-200k, 4248.8% for AGIs over 200k)
Taxable individual retirement arrangement distribution: $31,867 (reported on 9.2% of returns)
20190:
$31,867
Virginia:
$21,535
(% of AGI for various income ranges: 49.7% for AGIs below $25k, 102.5% for AGIs $25k-50k, 180.1% for AGIs $50k-75k, 308.0% for AGIs $75k-100k, 645.9% for AGIs $100k-200k, 3066.5% for AGIs over 200k)
Self-employed (Keogh) retirement plans: $26,324 (reported on 1.5% of returns)
20190:
$26,324
Virginia:
$31,172
(% of AGI for various income ranges: 22.6% for AGIs $50k-75k, 50.3% for AGIs $100k-200k, 657.3% for AGIs over 200k)
Total itemized deductions: $30,248 (reported on 22.0% of returns)
Here:
$30,248
State:
$33,287
(% of AGI for various income ranges: 91.6% for AGIs below $25k, 259.1% for AGIs $25k-50k, 477.6% for AGIs $50k-75k, 803.4% for AGIs $75k-100k, 1606.6% for AGIs $100k-200k, 6154.9% for AGIs over 200k)
Charity contributions: $7,905 (reported on 16.9% of returns)
Here:
$7,905
State:
$10,381
(% of AGI for various income ranges: 7.1% for AGIs below $25k, 21.1% for AGIs $25k-50k, 46.4% for AGIs $50k-75k, 100.1% for AGIs $75k-100k, 216.3% for AGIs $100k-200k, 1930.4% for AGIs over 200k)
Taxes paid: $8,857 (reported on 21.9% of returns)
20190:
$8,857
State:
$8,284
(% of AGI for various income ranges: 18.1% for AGIs below $25k, 57.0% for AGIs $25k-50k, 135.4% for AGIs $50k-75k, 284.8% for AGIs $75k-100k, 551.1% for AGIs $100k-200k, 1504.9% for AGIs over 200k)
Earned income credit: $2,181 (reported on 6.9% of returns)
Here:
$2,181
State:
$2,214
(% of AGI for various income ranges: 75.8% for AGIs below $25k, 51.1% for AGIs $25k-50k)
Percentage of individuals using paid preparers for their 2020 taxes: 92.2%
Here:
92%
State:
92%
(% for various income ranges: 88.8% for AGIs below $25k, 91.7% for AGIs $25k-50k, 93.4% for AGIs $50k-75k, 92.4% for AGIs $75k-100k, 93.3% for AGIs $100k-200k, 93.8% for AGIs over 200k)
Averages for the 2012 tax year for zip code 20190, filed in 2013:
Average Adjusted Gross Income (AGI) in 2012: $107,597 (Individual Income Tax Returns)
Here:
$107,597
State:
$71,192
Salary/wage: $89,396 (reported on 85.3% of returns)
Here:
$89,396
State:
$59,229
(% of AGI for various income ranges: 78.4% for AGIs below $25k, 86.1% for AGIs $25k-50k, 79.6% for AGIs $50k-75k, 80.4% for AGIs $75k-100k, 79.8% for AGIs $100k-200k, 58.0% for AGIs over 200k)
Taxable interest for individuals: $1,864 (reported on 45.3% of returns)
This zip code:
$1,864
Virginia:
$1,600
(% of AGI for various income ranges: 1.1% for AGIs below $25k, 0.7% for AGIs $25k-50k, 0.6% for AGIs $50k-75k, 0.5% for AGIs $75k-100k, 0.6% for AGIs $100k-200k, 1.0% for AGIs over 200k)
Ordinary dividends: $7,147 (reported on 31.7% of returns)
Here:
$7,147
State:
$6,959
(% of AGI for various income ranges: 2.5% for AGIs below $25k, 1.0% for AGIs $25k-50k, 1.7% for AGIs $50k-75k, 1.4% for AGIs $75k-100k, 1.8% for AGIs $100k-200k, 2.7% for AGIs over 200k)
Net capital gain/loss in AGI: +$23,990 (reported on 26.3% of returns)
Here:
+$23,990
State:
+$16,672
(% of AGI for various income ranges: 0.6% for AGIs $50k-75k, 0.7% for AGIs $75k-100k, 1.1% for AGIs $100k-200k, 12.7% for AGIs over 200k)
Profit/loss from business: +$20,695 (reported on 17.7% of returns)
Here:
+$20,695
State:
+$14,116
(% of AGI for various income ranges: 12.0% for AGIs below $25k, 3.8% for AGIs $25k-50k, 3.1% for AGIs $50k-75k, 3.0% for AGIs $75k-100k, 3.5% for AGIs $100k-200k, 2.9% for AGIs over 200k)
Taxable individual retirement arrangement distribution: $21,751 (reported on 11.1% of returns)
20190:
$21,751
Virginia:
$16,667
(% of AGI for various income ranges: 2.6% for AGIs below $25k, 1.7% for AGIs $25k-50k, 2.5% for AGIs $50k-75k, 2.7% for AGIs $75k-100k, 2.1% for AGIs $100k-200k, 2.3% for AGIs over 200k)
Self-employment retirement plans: $21,247 (reported on 1.8% of returns)
20190:
$21,247
Virginia:
$25,373
(% of AGI for various income ranges: 0.7% for AGIs $50k-75k, 0.3% for AGIs $100k-200k, 0.5% for AGIs over 200k)
Total itemized deductions: $29,482 (17% of AGI, reported on 51.2% of returns)
Here:
$29,482
State:
$26,596
Here:
17.5% of AGI
State:
20.1% of AGI
(% of AGI for various income ranges: 17.3% for AGIs below $25k, 12.4% for AGIs $25k-50k, 14.0% for AGIs $50k-75k, 13.8% for AGIs $75k-100k, 15.8% for AGIs $100k-200k, 12.9% for AGIs over 200k)
Charity contributions: $3,765 (reported on 40.7% of returns)
Here:
$3,765
State:
$4,443
(% of AGI for various income ranges: 0.9% for AGIs below $25k, 0.8% for AGIs $25k-50k, 1.2% for AGIs $50k-75k, 1.3% for AGIs $75k-100k, 1.6% for AGIs $100k-200k, 1.5% for AGIs over 200k)
Taxes paid: $13,769 (reported on 50.9% of returns)
20190:
$13,769
State:
$9,951
(% of AGI for various income ranges: 2.7% for AGIs below $25k, 2.9% for AGIs $25k-50k, 4.5% for AGIs $50k-75k, 5.2% for AGIs $75k-100k, 6.9% for AGIs $100k-200k, 7.7% for AGIs over 200k)
Earned income credit: $2,134 (reported on 9.7% of returns)
Here:
$2,134
State:
$2,211
(% of AGI for various income ranges: 5.8% for AGIs below $25k, 0.7% for AGIs $25k-50k)
Percentage of individuals using paid preparers for their 2012 taxes: 44.5%
Here:
45%
State:
46%
(% for various income ranges: 44.5% for AGIs below $25k, 42.1% for AGIs $25k-50k, 40.1% for AGIs $50k-75k, 38.6% for AGIs $75k-100k, 46.3% for AGIs $100k-200k, 59.8% for AGIs over 200k)
Averages for the 2004 tax year for zip code 20190, filed in 2005:
Average Adjusted Gross Income (AGI) in 2004: $73,839 (Individual Income Tax Returns)
Here:
$73,839
State:
$56,704
Salary/wage: $64,440 (reported on 87.6% of returns)
Here:
$64,440
State:
$48,441
(% of AGI for various income ranges: 214.1% for AGIs below $10k, 82.6% for AGIs $10k-25k, 87.0% for AGIs $25k-50k, 85.6% for AGIs $50k-75k, 82.5% for AGIs $75k-100k, 68.9% for AGIs over 100k)
Taxable interest for individuals: $1,555 (reported on 53.5% of returns)
This zip code:
$1,555
Virginia:
$1,688
(% of AGI for various income ranges: 14.0% for AGIs below $10k, 1.5% for AGIs $10k-25k, 1.0% for AGIs $25k-50k, 0.8% for AGIs $50k-75k, 1.0% for AGIs $75k-100k, 1.2% for AGIs over 100k)
Taxable dividends: $3,197 (reported on 33.7% of returns)
Here:
$3,197
State:
$4,028
(% of AGI for various income ranges: 9.9% for AGIs below $10k, 1.7% for AGIs $10k-25k, 1.2% for AGIs $25k-50k, 1.1% for AGIs $50k-75k, 1.5% for AGIs $75k-100k, 1.5% for AGIs over 100k)
Net capital gain/loss: +$13,031 (reported on 29.4% of returns)
Here:
+$13,031
State:
+$14,375
(% of AGI for various income ranges: -5.4% for AGIs below $10k, -0.2% for AGIs $10k-25k, 0.5% for AGIs $25k-50k, 0.4% for AGIs $50k-75k, 1.2% for AGIs $75k-100k, 8.9% for AGIs over 100k)
Profit/loss from business: +$16,544 (reported on 15.3% of returns)
Here:
+$16,544
State:
+$13,342
(% of AGI for various income ranges: 15.8% for AGIs below $10k, 7.2% for AGIs $10k-25k, 2.8% for AGIs $25k-50k, 2.4% for AGIs $50k-75k, 1.5% for AGIs $75k-100k, 4.0% for AGIs over 100k)
IRA payment deduction: $3,143 (reported on 3.1% of returns)
20190:
$3,143
Virginia:
$2,943
(% of AGI for various income ranges: 0.3% for AGIs $10k-25k, 0.2% for AGIs $25k-50k, 0.1% for AGIs $50k-75k, 0.2% for AGIs $75k-100k, 0.1% for AGIs over 100k)
Self-employed pension: $14,855 (reported on 2.0% of returns)
Here:
$14,855
Virginia:
$17,430
(% of AGI for various income ranges: 0.1% for AGIs $25k-50k, 0.2% for AGIs $50k-75k, 0.3% for AGIs $75k-100k, 0.6% for AGIs over 100k)
Total itemized deductions: $21,337 (19% of AGI, reported on 51.9% of returns)
Here:
$21,337
State:
$21,492
Here:
19.3% of AGI
State:
21.0% of AGI
(% of AGI for various income ranges: 48.5% for AGIs below $10k, 15.8% for AGIs $10k-25k, 14.8% for AGIs $25k-50k, 15.1% for AGIs $50k-75k, 17.4% for AGIs $75k-100k, 14.1% for AGIs over 100k)
Charity contributions deductions: $2,732 (2% of AGI, reported on 44.1% of returns)
Here:
$2,732
State:
$3,794
Here:
2.3% of AGI
State:
3.5% of AGI
(% of AGI for various income ranges: 1.5% for AGIs below $10k, 1.4% for AGIs $10k-25k, 1.5% for AGIs $25k-50k, 1.5% for AGIs $50k-75k, 1.8% for AGIs $75k-100k, 1.7% for AGIs over 100k)
Total tax: $13,368 (reported on 86.2% of returns)
20190:
$13,368
State:
$9,537
(% of AGI for various income ranges: 6.5% for AGIs below $10k, 4.7% for AGIs $10k-25k, 8.4% for AGIs $25k-50k, 12.0% for AGIs $50k-75k, 13.3% for AGIs $75k-100k, 19.5% for AGIs over 100k)
Earned income credit: $1,528 (reported on 7.5% of returns)
Here:
$1,528
State:
$1,734
Percentage of individuals using paid preparers for their 2004 taxes: 45.2%
Here:
45%
State:
52%
(% for various income ranges: 43.0% for AGIs below $10k, 50.2% for AGIs $10k-25k, 46.2% for AGIs $25k-50k, 39.7% for AGIs $50k-75k, 41.2% for AGIs $75k-100k, 49.0% for AGIs over 100k)
Likely homosexual households (counted as self-reported same-sex unmarried-partner households)
Lesbian couples: 0.1% of all households
Gay men: 0.7% of all households
Household received Food Stamps/SNAP in the past 12 months: 689 Household did not receive Food Stamps/SNAP in the past 12 months: 10,268
Women who had a birth in the past 12 months: 165 (170 now married, 0 unmarried) Women who did not have a birth in the past 12 months: 5,215 (2,269 now married, 2,945 unmarried)
Housing units in zip code 20190 with a mortgage: 3,835 (321 second mortgage, 249 both second mortgage and home equity loan) Houses without a mortgage: 68
Median monthly owner costs for units with a mortgage: $2,588 Median monthly owner costs for units without a mortgage: $1,010
Residents with income below the poverty level in 2022:
This zip code:
7.8%
Whole state:
10.6%
Residents with income below 50% of the poverty level in 2022:
This zip code:
4.0%
Whole state:
5.2%
Median number of rooms in houses and condos:
Here:
5.9
State:
7.0
Median number of rooms in apartments:
Here:
3.5
State:
4.3
Notable locations in this zip code not listed on our city pages
Notable locations in zip code 20190: Hidden Creek Golf Club (A), Reston Town Center (B), Plaza America (C), Hospital Center Medical Plaza (D), Reston Industrial Venture Park (E), Reston Industrial Park (F), Plaza America Industrial Park (G), Sunset Hills Professional Center (H), Lake Fairfax Business Park (I), Reston Regional Library (J), Fairfax County Fire and Rescue Department Station 25 Reston (K), Reston Police Station (L), A Smith Bowman House (M), Northern County Government Center (N), Fairfax County Government Offices (O), Embry Rucker Community Shelter (P), Reston Surgery Center (Q). Display/hide their locations on the map
Shopping Centers: Lake Anne Plaza Shopping Center (1), Tall Oaks Shopping Center (2), Hechinger Shopping Center (3). Display/hide their locations on the map
Churches in zip code 20190 include: Reston Unitarian Church (A), Harvest Christian Fellowship Church (B), Good Shepherd Lutheran Church (C), Northern Virginia Hebrew Congregational Synagogue (D), Reston Presbyterian Church (E), Reston Bible Church (F), Redeemer Methodist Church (G). Display/hide their locations on the map
In group quarters: 78 (-1 institutionalized population)
Size of family households: 3,120 2-persons, 686 3-persons, 784 4-persons, 352 5-persons, 139 6-persons, 15 7-or-more-persons
Size of nonfamily households: 4,980 1-person, 865 2-persons, 124 3-persons
2,648 married couples with children.
884 single-parent households (242 men, 642 women).
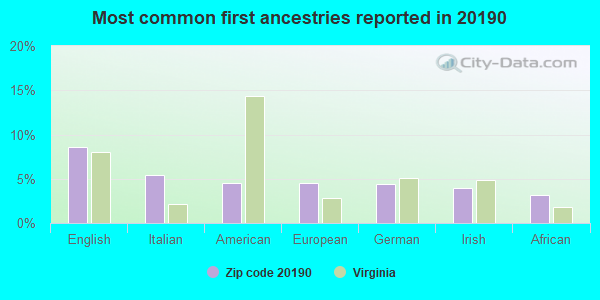
70.2% of residents of 20190 zip code speak English at home.
9.5% of residents speak Spanish at home (70% very well, 16% well, 8% not well, 7% not at all).
9.4% of residents speak other Indo-European language at home (73% very well, 15% well, 11% not well, 1% not at all).
5.6% of residents speak Asian or Pacific Island language at home (64% very well, 9% well, 15% not well, 13% not at all).
6.0% of residents speak other language at home (74% very well, 16% well, 5% not well, 5% not at all).
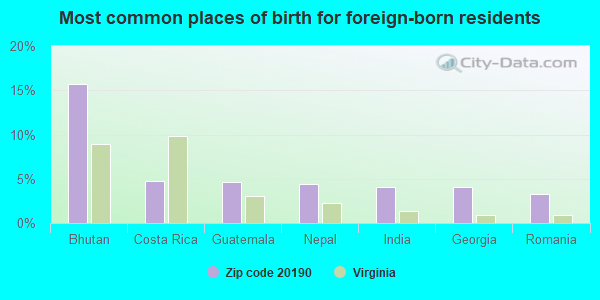
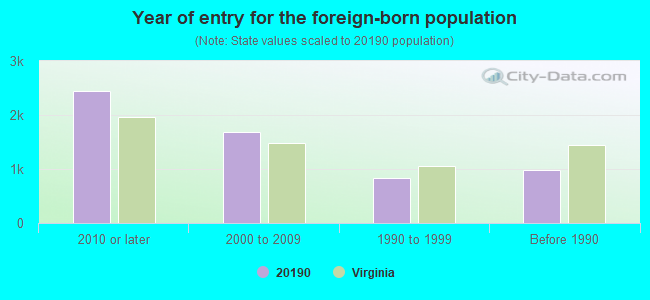
Foreign born population: 5,119 (24.1%) (59.9% of them are naturalized citizens)
Facilities with environmental interests located in this zip code:
CABLE AND WIRELESS USA - RESTON (11700 PLAZA AMERICA WAY in RESTON, VA)
AIR MINOR (AIRS/AFS) STATE MASTER (Virginia pollutants databases) - CEDS-72364, AIR PROGRAM Business SIC classification: RADIOTELEPHONE COMMUNICATIONS Business NAICS classification: CELLULAR AND OTHER WIRELESS TELECOMMUNICATIONS. Alternative names: CABLE & WIRELESS USA
CHARTER OAK APARTMENTS (11637 CHARTER OAK COURT in RESTON, VA)
AIR MINOR (AIRS/AFS) STATE MASTER (Virginia pollutants databases) - CEDS-70152, AIR PROGRAM Business SIC classification: MANAGEMENT SERVICES Business NAICS classification: LESSORS OF RESIDENTIAL BUILDINGS AND DWELLINGS.
7-11 NUMBER 25151 (11714 SUNSET HILLS ROAD in RESTON, VA)
Small Quantity Generators, between 100 kg and 1000 kg of hazardous waste/month (Resource Conservation and Recovery Act (tracking hazardous waste)) - notification Organizations: OPERNAME (CONTACT/OPERATOR)
, SOUTHLAND CORPORATION THE (CONTACT/OWNER)
A SMITH BOWMAN DISTILLERY INCORPORATED (11710 SUNSET HILLS ROAD in RESTON, VA)
CRITERIA AND HAZARDOUS AIR POLLUTANT INVENTORY (Inventory of air pollution sources) Business SIC classification: DISTILLED AND BLENDED LIQUORS
Housing units lacking complete plumbing facilities: 0.8% Housing units lacking complete kitchen facilities: 2.2%
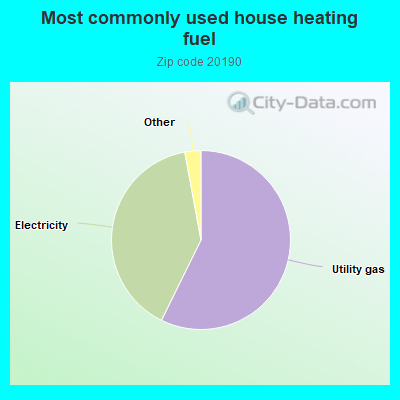
57.3%Utility gas
39.8%Electricity
0.9%Other fuel
0.9%Bottled, tank, or LP gas
0.8%Fuel oil, kerosene, etc.
Place of birth for U.S.-born residents:
This state: 5,341
Northeast: 3,412
Midwest: 2,016
South: 3,517
West: 1,211
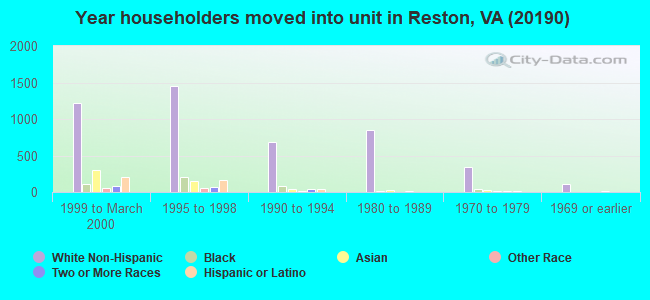
37% of the 20190 zip code residents lived in the same house 5 years ago. Out of people who lived in different houses, 45% lived in this county. Out of people who lived in different counties, 50% lived in Virginia.
79% of the 20190 zip code residents lived in the same house 1 year ago. Out of people who lived in different houses, 30% moved from this county. Out of people who lived in different houses, 30% moved from different county within same state. Out of people who lived in different houses, 32% moved from different state. Out of people who lived in different houses, 6% moved from abroad.
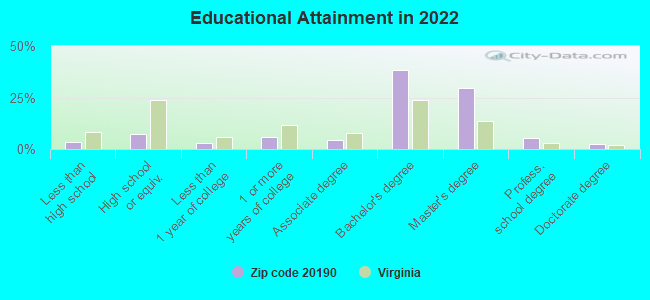
Private vs. public school enrollment:
Students in private schools in grades 1 to 8 (elementary and middle school): 297
Here:
17.0%
Virginia:
13.2%
Students in private schools in grades 9 to 12 (high school): 237
Here:
44.5%
Virginia:
10.2%
Students in private undergraduate colleges: 246
Here:
39.6%
Virginia:
18.7%
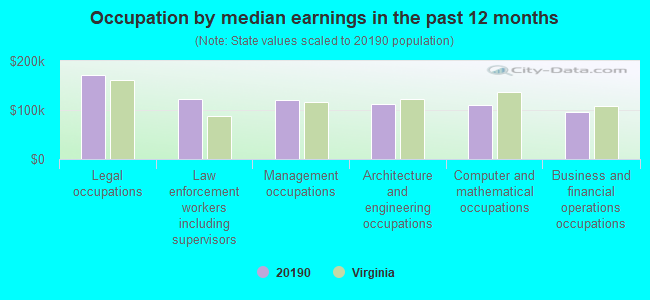
Occupation by median earnings in the past 12 months ($)
170,855Legal occupations
123,402Law enforcement workers including supervisors
121,050Management occupations
111,568Architecture and engineering occupations
110,951Computer and mathematical occupations
95,573Business and financial operations occupations
Companies with biggest federal contracts located in this zip code (RESTON, VA):
NORTHROP GRUMMAN DEFENSE MISSI (12011 SUNSET HILLS ROAD) : $2,088,624,514 in 3879 contractsfrom 2001 to 2006
Contracts for Systems Engineering Services, Defense Electronics and Communication Equipment -- Operational Systems Development (R&D), Other Professional Services, Engineering and Technical Services, and moreby Army, Air Force, Navy, Defense Information Systems Agency, and others Signed by year:2000: $0; 2001: $5,057,096; 2002: $223,259,145; 2003: $539,512,373; 2004: $479,703,472; 2005: $538,758,925; 2006: $302,333,503.
Biggest contracts:
$43,226,028 with Army for Systems Engineering Services. Signed on 2003-11-20. Completion date: 2011-01-29.
$29,475,000 with Air Force for Defense Electronics and Communication Equipment -- Operational Systems Development (R&D). Taking place in IL. Signed on 2003-11-19. Completion date: 2004-11-26.
$22,103,427 with Navy for Other Professional Services. Taking place in NV. Signed on 2005-10-14. Completion date: 2006-09-30.
$20,567,858 with Air Force for Defense Electronics and Communication Equipment -- Operational Systems Development (R&D). Taking place in IL. Signed on 2002-10-23. Completion date: 2007-04-28.
NCI INFORMATION SYSTEMS, INC (11730 PLAZA AMERICA DRIVE; small business) 1001 employees, $0 revenue. : $470,944,475 in 1327 contractsfrom 1999 to 2006
Contracts for ADP Systems Analysis Services, ADP Facility Operation and Maintenance Services, Services -- Management and Support (R&D), ADP Support Equipment, and moreby Minerals Management Service, Defense Logistics Agency, Office of Policy, Management and Budget/Chief Financial Officer, Navy, and others Signed by year:2000: $71,924,964; 2001: $44,366,670; 2002: $56,932,943; 2003: $48,982,730; 2004: $86,363,863; 2005: $108,231,970; 2006: $37,708,793.
Biggest contracts:
$16,911,583 with Minerals Management Service for ADP Systems Analysis Services. Signed on 2005-08-09. Completion date: 2005-09-30.
$14,561,776 with Defense Logistics Agency for ADP Facility Operation and Maintenance Services. Taking place in IL. Signed on 2004-11-04. Completion date: 2005-09-30.
$8,100,000 with Minerals Management Service for ADP Systems Analysis Services. Signed on 2004-10-25. Effective on 2004-10-01. Completion date: 2005-09-30.
$7,941,176 with Office of Policy, Management and Budget/Chief Financial Officer for ADP Systems Analysis Services. Signed on 2005-09-29. Effective on 2005-10-01. Completion date: 2006-09-30.
TURNER CONSTRUCTION COMPANY (11921 FREEDOM DRIVE) : $271,385,613 in 262 contractsfrom 1999 to 2006
Contracts for Construction of Structures and Facilities -- Other Administrative Facilities and Service Buildings, Architect - Engineer Services (including landscaping, interior layout, and designing), Construction of Structures and Facilities -- Miscellaneous Buildings, Construction of Structures and Facilities -- Airport Terminals, and moreby Army, Departmental Offices, Transportation Security Administration, National Park Service, and others Signed by year:2000: $27,498,000; 2001: $22,750,000; 2002: $11,209,000; 2003: $29,094,687; 2004: $78,787,337; 2005: $86,558,280; 2006: $14,060,309.
Biggest contracts:
$76,755,120 with Army for Construction of Structures and Facilities -- Other Administrative Facilities and Service Buildings. Taking place in DC. Signed on 2005-11-04. Completion date: 2006-08-08.
$76,695,120, same as above.Signed on 2004-09-20. Completion date: 2007-03-01.
$19,937,000 with Departmental Offices for Architect - Engineer Services (including landscaping, interior layout, and designing). Taking place in DC. Signed on 2001-05-15. Completion date: 2001-09-15.
$16,378,793, same as above.Signed on 2003-03-15. Completion date: 2004-06-15.
DELOITTE CONSULTING L L P (12010 SUNSET HILLS RD) : $218,047,580 in 273 contractsfrom 2001 to 2006
Contracts for Automated Information System Design and Integration Services, Financial Services (includes credit card services and any other financial services. See revision to description for code R703 above), ADP Software, ADP Systems Development Services, and moreby Transportation Security Administration, HOUSING AND URBAN DEVELOPMENT, Department of, United States Mint, EDUCATION, Department of, and others Signed by year:2000: $0; 2001: $404,293; 2002: $2,940,538; 2003: $19,482,315; 2004: $42,827,681; 2005: $56,993,484; 2006: $95,399,269.
Biggest contracts:
$20,983,123 with Transportation Security Administration for Automated Information System Design and Integration Services. Signed on 2006-08-03. Completion date: 2007-08-06.
$13,075,000, same as above.Signed on 2004-08-20. Completion date: 2005-12-21.
$10,350,942 with HOUSING AND URBAN DEVELOPMENT, Department of for Financial Services (includes credit card services and any other financial services. See revision to description for code R703 above). Signed on 2006-09-30. Effective on 2006-10-01. Completion date: 2007-09-30.
$8,755,849 with Transportation Security Administration for Automated Information System Design and Integration Services. Signed on 2005-11-18. Completion date: 2006-10-31.
HIGH PERFORMANCE TECHNOLOGIES, (11955 FREEDOM DRIVE) : $149,045,635 in 438 contractsfrom 1999 to 2006
Contracts for ADP Support Equipment, Other ADP and Telecommunications Services (includes data storage on tapes, compact disks, etc.), ADPE System Configuration, ADP Systems Development Services, and moreby Internal Revenue Service, Department of Veterans Affairs, National Oceanic and Atmospheric Administration/Under Secretary for Oceans and Atmosphere, Federal Bureau of Investigation, and others Signed by year:2000: $6,591,064; 2001: $43,207,465; 2002: $18,105,039; 2003: $35,441,616; 2004: $19,660,987; 2005: $18,688,504; 2006: $4,584,008.
Biggest contracts:
$30,600,000 with Internal Revenue Service for ADP Support Equipment. Signed on 2001-03-15. Completion date: 2001-06-15.
$3,413,485 with Department of Veterans Affairs for Other ADP and Telecommunications Services (includes data storage on tapes, compact disks, etc.). Taking place in MD. Signed on 2003-08-15. Completion date: 2004-07-15.
$3,000,000 with National Oceanic and Atmospheric Administration/Under Secretary for Oceans and Atmosphere for ADPE System Configuration. Signed on 2000-08-15. Completion date: 2000-09-15.
$2,836,712 with Department of Veterans Affairs for Other ADP and Telecommunications Services (includes data storage on tapes, compact disks, etc.). Taking place in MD. Signed on 2003-07-15. Completion date: 2004-07-15.
LOGICON INC (1831 WIEHLE AVE STE 300) : $111,414,604 in 224 contractsfrom 2000 to 2006
Contracts for ADP Systems Development Services, Engineering and Technical Services, Other ADP and Telecommunications Services (includes data storage on tapes, compact disks, etc.), Mathematical and Computer Sciences -- Engineering Development (R&D), and moreby Federal Bureau of Investigation, Office of Policy, Management and Budget/Chief Financial Officer, Internal Revenue Service, Navy, and others Signed by year:2000: $4,719,897; 2001: $6,287,299; 2002: $28,526,586; 2003: $29,880,031; 2004: $35,067,369; 2005: $5,868,140; 2006: $1,065,282.
Biggest contracts:
$10,023,674 with Federal Bureau of Investigation for ADP Systems Development Services. Signed on 2004-08-12. Completion date: 2005-09-30.
$9,545,714, same as above.Signed on 2004-08-12. Completion date: 2005-09-30.
$5,853,159 with Office of Policy, Management and Budget/Chief Financial Officer for Engineering and Technical Services. Signed on 2002-12-15. Completion date: 2010-02-15.
$5,000,000 with Internal Revenue Service for Other ADP and Telecommunications Services (includes data storage on tapes, compact disks, etc.). Signed on 2002-07-15. Completion date: 2002-12-15.
HUGHES INFORMATION SYSTEMS COM (1768 BUSINESS CENTER DR) : $107,636,437 in 58 contractsfrom 1999 to 2006
Contracts for Radio and Television Communication Equipment, Except Airborne, Maintenance, Repair and Rebuilding of Equipment -- Communication, Detection, and Coherent Radiation Equipment by Air Force, Navy Signed by year:2000: $15,510,385; 2001: $0; 2002: $0; 2003: $0; 2004: $19,793,939; 2005: $49,455,778; 2006: $11,924,818.
Biggest contracts:
$10,852,000 with Air Force for Radio and Television Communication Equipment, Except Airborne. Signed on 2004-11-30. Completion date: 2005-12-31.
$9,673,959, same as above.Signed on 1999-12-07. Completion date: 2003-09-30.
$7,754,764, same as above.Signed on 2005-03-31. Completion date: 2005-12-31.
$7,501,813, same as above.Signed on 2006-07-06. Completion date: 2006-09-30.
SCIENCE APPLICATIONS INTERNATI (11251 ROGER BACON DR) : $98,115,435 in 583 contractsfrom 1999 to 2006
Contracts for Other Architect and Engineering Services, Other Environmental Services, Studies, and Analytical Support, Airfield, Communication and Missile Facilities, Engineering and Technical Services, and moreby Air Force, Army, NASA, EPA, and others Signed by year:2000: $24,505,542; 2001: $27,548,362; 2002: $12,312,833; 2003: $7,486,322; 2004: $11,261,330; 2005: $9,126,847; 2006: $2,685,985.
Biggest contracts:
$2,881,167 with Air Force for Other Architect and Engineering Services. Taking place in TX. Signed on 2001-09-19. Completion date: 2002-12-31.
$2,394,281 with Army for Other Environmental Services, Studies, and Analytical Support. Taking place in MI. Signed on 2005-09-08. Completion date: 2008-09-08.
$2,352,318 with Air Force for Airfield, Communication and Missile Facilities. Taking place in TX. Signed on 2000-09-22. Completion date: 2001-12-31.
$2,025,000 with NASA for Engineering and Technical Services. Taking place in OH. Signed on 2000-12-15. Completion date: 2001-05-15.
DYN SYSTEMS TECHNOLOGY, INC (11710 PLAZA AMERICA DR; small business) : $73,673,184 in 279 contractsfrom 2000 to 2005
Contracts for ADP System Acquisition Support Services. Includes preparation of statement of work, benchmarks, specifications, etc., Other Professional Services, Other ADP and Telecommunications Services (includes data storage on tapes, compact disks, etc.), Other Special Studies and Analyses, and moreby Army, Air Force, EPA, Navy, and others Signed by year:2000: $4,239,387; 2001: $9,455,902; 2002: $32,535,757; 2003: $23,616,909; 2004: $2,619,223; 2005: $1,206,006; 2006: $0.
Biggest contracts:
$4,498,289 with Army for ADP System Acquisition Support Services. Includes preparation of statement of work, benchmarks, specifications, etc.. Signed on 2003-01-28. Completion date: 2004-01-10.
$3,191,300, same as above.Signed on 2001-12-05. Completion date: 2002-12-15.
$2,452,470 with Air Force for Other Professional Services. Signed on 2001-04-13. Completion date: 2001-09-30.
$2,098,042, same as above.Signed on 2001-03-08. Completion date: 2001-07-01.
I T T INDUSTRIES, INC (1761 BUS CTR DR STE 200) : $71,914,906 in 232 contractsfrom 1999 to 2006
Contracts for Other ADP and Telecommunications Services (includes data storage on tapes, compact disks, etc.), Space Science and Applications -- Applied Research and Exploratory Development (R&D), Systems Engineering Services, Aeronautics and Space Technology -- Basic Research (R&D), and moreby NASA, Federal Technology Service, Department of Veterans Affairs, Army, and others Signed by year:2000: $9,381,000; 2001: $11,131,442; 2002: $10,830,556; 2003: $14,358,771; 2004: $5,436,961; 2005: $9,873,050; 2006: $9,505,126.
Biggest contracts:
$4,473,000 with NASA for Other ADP and Telecommunications Services (includes data storage on tapes, compact disks, etc.). Signed on 2000-09-15. Completion date: 2002-12-15.
$2,324,000, same as above.Signed on 2001-03-15. Completion date: 2002-12-15.
$1,941,000, same as above.Signed on 2001-04-15. Completion date: 2002-12-15.
$1,911,000, same as above.Signed on 2001-11-15. Completion date: 2002-12-15.
Top industries in this zip code by the number of employees in 2005:
Professional, Scientific, and Technical Services: Research and Development in the Physical, Engineering, and Life Sciences (250-499: 2, 100-249: 2, 5-9: 1, 1-4: 6)
Health Care and Social Assistance: Offices of Physicians (except Mental Health Specialists) (250-499: 1, 20-49: 9, 10-19: 8, 5-9: 19, 1-4: 33)
Construction: New Single-Family Housing Construction (except Operative Builders) (500-999: 1, 50-99: 1, 20-49: 1, 10-19: 3)
People in group quarters in 2010:
175 people in nursing facilities/skilled-nursing facilities
57 people in emergency and transitional shelters (with sleeping facilities) for people experiencing homelessness
45 people in other noninstitutional facilities
People in group quarters in 2000:
354 people in nursing homes
171 people in other noninstitutional group quarters
Fatal accident statistics in 2010:
Fatal accident count: 1
Vehicles involved in fatal accidents: 1
Fatal accidents caused by drunken drivers: 0
Fatalities: 1
Persons involved in fatal accidents: 1
Pedestrians involved in fatal accidents: 0
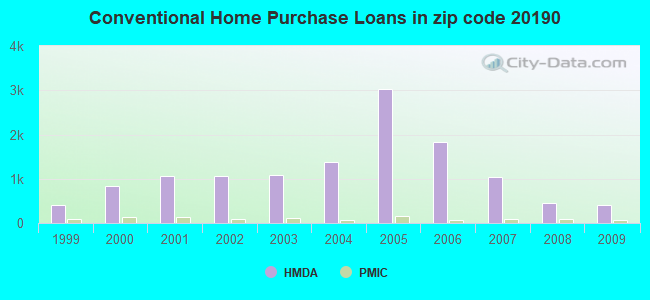
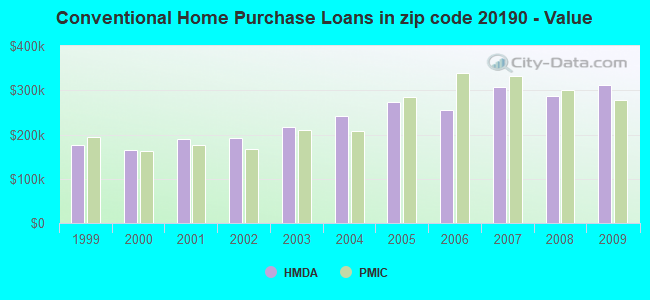
Home Mortgage Disclosure Act Aggregated Statistics For Year 2009 (Based on 4 full and 4 partial tracts)
A) FHA, FSA/RHS & VA Home Purchase Loans
B) Conventional Home Purchase Loans
C) Refinancings
D) Home Improvement Loans
E) Loans on Dwellings For 5+ Families
F) Non-occupant Loans on < 5 Family Dwellings (A B C & D)
Number
Average Value
Number
Average Value
Number
Average Value
Number
Average Value
Number
Average Value
Number
Average Value
LOANS ORIGINATED
195
$314,954
417
$310,862
1,097
$305,823
31
$227,911
2
$44,565,040
140
$247,975
APPLICATIONS APPROVED, NOT ACCEPTED
5
$410,584
10
$372,973
55
$287,246
2
$49,920
2
$1,996,800
6
$241,042
APPLICATIONS DENIED
17
$290,401
39
$238,922
256
$289,404
10
$73,459
0
$0
55
$218,422
APPLICATIONS WITHDRAWN
26
$244,742
66
$303,419
272
$320,714
7
$112,100
0
$0
34
$245,419
FILES CLOSED FOR INCOMPLETENESS
6
$242,020
10
$211,231
49
$327,734
2
$330,155
0
$0
10
$249,871
Aggregated Statistics For Year 2008 (Based on 4 full and 4 partial tracts)
A) FHA, FSA/RHS & VA Home Purchase Loans
B) Conventional Home Purchase Loans
C) Refinancings
D) Home Improvement Loans
E) Loans on Dwellings For 5+ Families
F) Non-occupant Loans on < 5 Family Dwellings (A B C & D)
Number
Average Value
Number
Average Value
Number
Average Value
Number
Average Value
Number
Average Value
Number
Average Value
LOANS ORIGINATED
110
$272,764
462
$286,468
418
$271,059
37
$86,872
2
$21,781,740
136
$228,807
APPLICATIONS APPROVED, NOT ACCEPTED
8
$230,326
56
$274,397
72
$284,257
8
$53,979
0
$0
16
$305,039
APPLICATIONS DENIED
14
$275,336
43
$376,253
201
$298,471
24
$142,437
0
$0
32
$212,774
APPLICATIONS WITHDRAWN
16
$270,504
77
$327,580
152
$329,173
10
$144,490
0
$0
13
$243,705
FILES CLOSED FOR INCOMPLETENESS
2
$199,915
6
$343,737
19
$350,319
2
$258,595
0
$0
4
$298,380
Aggregated Statistics For Year 2007 (Based on 4 full and 4 partial tracts)
A) FHA, FSA/RHS & VA Home Purchase Loans
B) Conventional Home Purchase Loans
C) Refinancings
D) Home Improvement Loans
F) Non-occupant Loans on < 5 Family Dwellings (A B C & D)
Number
Average Value
Number
Average Value
Number
Average Value
Number
Average Value
Number
Average Value
LOANS ORIGINATED
16
$256,886
1,042
$308,152
597
$282,977
63
$157,306
212
$282,301
APPLICATIONS APPROVED, NOT ACCEPTED
0
$0
130
$321,847
138
$255,846
14
$179,652
56
$252,513
APPLICATIONS DENIED
0
$0
117
$364,678
305
$316,690
34
$92,651
83
$299,540
APPLICATIONS WITHDRAWN
0
$0
97
$348,002
169
$297,716
9
$149,050
41
$287,570
FILES CLOSED FOR INCOMPLETENESS
0
$0
20
$277,330
40
$280,178
4
$117,502
12
$317,665
Aggregated Statistics For Year 2006 (Based on 4 full and 4 partial tracts)
A) FHA, FSA/RHS & VA Home Purchase Loans
B) Conventional Home Purchase Loans
C) Refinancings
D) Home Improvement Loans
E) Loans on Dwellings For 5+ Families
F) Non-occupant Loans on < 5 Family Dwellings (A B C & D)
Number
Average Value
Number
Average Value
Number
Average Value
Number
Average Value
Number
Average Value
Number
Average Value
LOANS ORIGINATED
16
$290,984
1,831
$254,934
751
$264,434
78
$115,729
10
$7,781,717
373
$246,546
APPLICATIONS APPROVED, NOT ACCEPTED
2
$182,705
162
$297,216
134
$260,851
11
$168,111
0
$0
48
$273,496
APPLICATIONS DENIED
0
$0
227
$284,556
282
$278,660
35
$150,621
0
$0
80
$317,785
APPLICATIONS WITHDRAWN
4
$319,602
198
$300,261
250
$275,999
12
$119,096
0
$0
56
$275,044
FILES CLOSED FOR INCOMPLETENESS
0
$0
37
$305,470
39
$285,736
4
$189,750
0
$0
5
$296,354
Aggregated Statistics For Year 2005 (Based on 4 full and 4 partial tracts)
A) FHA, FSA/RHS & VA Home Purchase Loans
B) Conventional Home Purchase Loans
C) Refinancings
D) Home Improvement Loans
E) Loans on Dwellings For 5+ Families
F) Non-occupant Loans on < 5 Family Dwellings (A B C & D)
G) Loans On Manufactured Home Dwelling (A B C & D)
Number
Average Value
Number
Average Value
Number
Average Value
Number
Average Value
Number
Average Value
Number
Average Value
Number
Average Value
LOANS ORIGINATED
6
$281,658
3,024
$272,335
1,175
$278,583
115
$120,080
0
$0
778
$276,374
2
$396,365
APPLICATIONS APPROVED, NOT ACCEPTED
2
$288,435
196
$258,493
140
$227,418
23
$58,984
0
$0
53
$222,073
0
$0
APPLICATIONS DENIED
0
$0
367
$285,701
225
$277,268
26
$170,008
2
$280,475
123
$281,675
0
$0
APPLICATIONS WITHDRAWN
0
$0
299
$271,020
224
$252,463
27
$153,719
0
$0
74
$242,405
0
$0
FILES CLOSED FOR INCOMPLETENESS
0
$0
38
$272,696
47
$275,762
2
$110,720
0
$0
6
$153,275
0
$0
Aggregated Statistics For Year 2004 (Based on 4 full and 4 partial tracts)
A) FHA, FSA/RHS & VA Home Purchase Loans
B) Conventional Home Purchase Loans
C) Refinancings
D) Home Improvement Loans
E) Loans on Dwellings For 5+ Families
F) Non-occupant Loans on < 5 Family Dwellings (A B C & D)
Number
Average Value
Number
Average Value
Number
Average Value
Number
Average Value
Number
Average Value
Number
Average Value
LOANS ORIGINATED
19
$188,386
1,382
$240,875
1,233
$223,018
72
$173,974
3
$4,969,553
291
$183,377
APPLICATIONS APPROVED, NOT ACCEPTED
0
$0
75
$232,829
117
$211,599
16
$99,052
0
$0
19
$115,168
APPLICATIONS DENIED
2
$210,830
106
$258,161
220
$214,108
39
$58,997
0
$0
32
$192,612
APPLICATIONS WITHDRAWN
2
$195,685
145
$241,241
183
$215,812
14
$93,179
0
$0
19
$202,169
FILES CLOSED FOR INCOMPLETENESS
0
$0
21
$239,999
33
$271,355
4
$72,798
0
$0
4
$137,235
Aggregated Statistics For Year 2003 (Based on 4 full and 4 partial tracts)
A) FHA, FSA/RHS & VA Home Purchase Loans
B) Conventional Home Purchase Loans
C) Refinancings
D) Home Improvement Loans
E) Loans on Dwellings For 5+ Families
F) Non-occupant Loans on < 5 Family Dwellings (A B C & D)
Number
Average Value
Number
Average Value
Number
Average Value
Number
Average Value
Number
Average Value
Number
Average Value
LOANS ORIGINATED
95
$166,189
1,074
$217,279
2,951
$205,165
37
$31,723
8
$6,563,614
338
$154,332
APPLICATIONS APPROVED, NOT ACCEPTED
0
$0
87
$222,800
289
$212,966
16
$61,047
0
$0
21
$154,909
APPLICATIONS DENIED
4
$181,310
62
$244,412
254
$232,211
27
$53,856
0
$0
29
$155,166
APPLICATIONS WITHDRAWN
6
$215,165
73
$260,521
295
$202,155
7
$80,411
0
$0
30
$159,644
FILES CLOSED FOR INCOMPLETENESS
5
$181,450
28
$269,051
60
$242,463
4
$38,462
0
$0
10
$157,056
Aggregated Statistics For Year 2002 (Based on 4 full and 4 partial tracts)
A) FHA, FSA/RHS & VA Home Purchase Loans
B) Conventional Home Purchase Loans
C) Refinancings
D) Home Improvement Loans
F) Non-occupant Loans on < 5 Family Dwellings (A B C & D)
Number
Average Value
Number
Average Value
Number
Average Value
Number
Average Value
Number
Average Value
LOANS ORIGINATED
90
$143,916
1,073
$191,062
1,873
$209,393
37
$56,388
228
$124,704
APPLICATIONS APPROVED, NOT ACCEPTED
2
$172,670
50
$169,447
207
$184,917
18
$43,005
30
$164,245
APPLICATIONS DENIED
2
$117,925
51
$173,298
209
$174,696
27
$19,958
13
$107,528
APPLICATIONS WITHDRAWN
5
$195,456
84
$192,863
197
$188,141
10
$41,261
17
$131,627
FILES CLOSED FOR INCOMPLETENESS
0
$0
20
$162,352
44
$189,584
0
$0
3
$136,060
Aggregated Statistics For Year 2001 (Based on 4 full and 4 partial tracts)
A) FHA, FSA/RHS & VA Home Purchase Loans
B) Conventional Home Purchase Loans
C) Refinancings
D) Home Improvement Loans
F) Non-occupant Loans on < 5 Family Dwellings (A B C & D)
Number
Average Value
Number
Average Value
Number
Average Value
Number
Average Value
Number
Average Value
LOANS ORIGINATED
221
$126,640
1,073
$190,564
1,331
$196,092
51
$36,464
176
$140,613
APPLICATIONS APPROVED, NOT ACCEPTED
3
$175,497
65
$170,986
105
$159,798
30
$75,485
11
$144,247
APPLICATIONS DENIED
12
$150,842
65
$206,060
169
$126,705
20
$28,670
12
$111,512
APPLICATIONS WITHDRAWN
9
$144,244
91
$196,279
149
$158,221
14
$47,779
13
$125,025
FILES CLOSED FOR INCOMPLETENESS
1
$77,220
10
$145,036
42
$155,348
4
$38,505
1
$135,430
Aggregated Statistics For Year 2000 (Based on 4 full and 4 partial tracts)
A) FHA, FSA/RHS & VA Home Purchase Loans
B) Conventional Home Purchase Loans
C) Refinancings
D) Home Improvement Loans
F) Non-occupant Loans on < 5 Family Dwellings (A B C & D)
Number
Average Value
Number
Average Value
Number
Average Value
Number
Average Value
Number
Average Value
LOANS ORIGINATED
296
$138,032
847
$165,331
174
$156,645
42
$39,314
96
$129,983
APPLICATIONS APPROVED, NOT ACCEPTED
6
$153,647
49
$158,877
34
$103,649
17
$42,846
10
$219,955
APPLICATIONS DENIED
5
$115,274
83
$165,419
62
$88,037
14
$72,210
14
$100,756
APPLICATIONS WITHDRAWN
25
$139,345
90
$137,375
56
$106,944
10
$90,025
11
$113,569
FILES CLOSED FOR INCOMPLETENESS
6
$139,623
16
$271,186
5
$137,832
3
$24,247
4
$59,778
Aggregated Statistics For Year 1999 (Based on 2 full and 2 partial tracts)
A) FHA, FSA/RHS & VA Home Purchase Loans
B) Conventional Home Purchase Loans
C) Refinancings
D) Home Improvement Loans
E) Loans on Dwellings For 5+ Families
F) Non-occupant Loans on < 5 Family Dwellings (A B C & D)
2004 - 2018 National Fire Incident Reporting System (NFIRS) incidents
According to the data from the years 2004 - 2018 the average number of fires per year is 25. The highest number of reported fires - 49 took place in 2018, and the least - 0 in 2007. The data has an increasing trend.
When looking into fire subcategories, the most reports belonged to: Structure Fires (40.1%), and Outside Fires (39.0%).
Fire incident types reported to NFIRS in Zip Code 20190


 Nearest zip codes: 20194, 20191, 20170, 22066, 22124, 20171.


 According to the data from the years 2004 - 2018 the average number of fires per year is 25. The highest number of reported fires - 49 took place in 2018, and the least - 0 in 2007. The data has an increasing trend.
 When looking into fire subcategories, the most reports belonged to: Structure Fires (40.1%), and Outside Fires (39.0%).