Estimated zip code population in 2022: 12,662 Zip code population in 2010: 13,165 Zip code population in 2000: 12,666
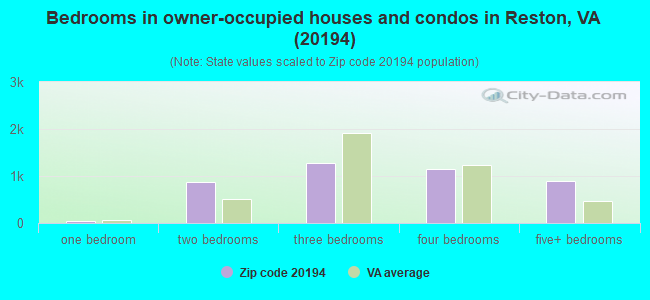
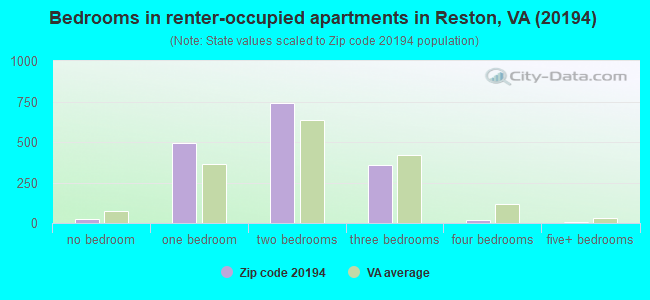
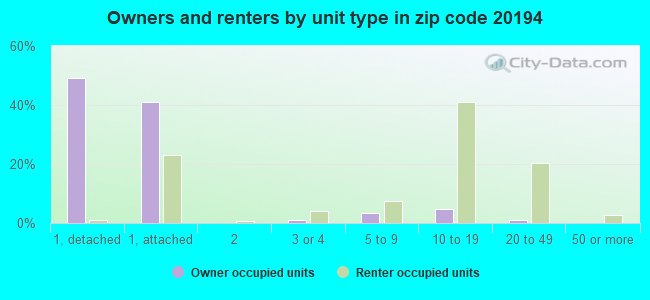
Houses and condos: 5,904 Renter-occupied apartments: 1,642
% of renters here:
28%
State:
33%
March 2022 cost of living index in zip code 20194: 166.3 (very high, U.S. average is 100)
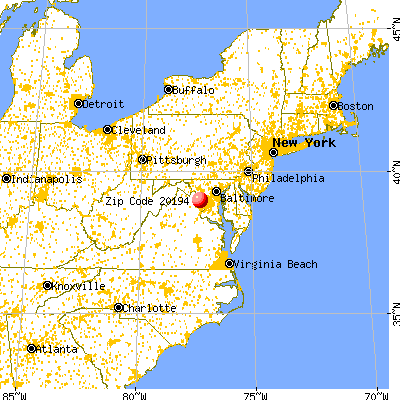
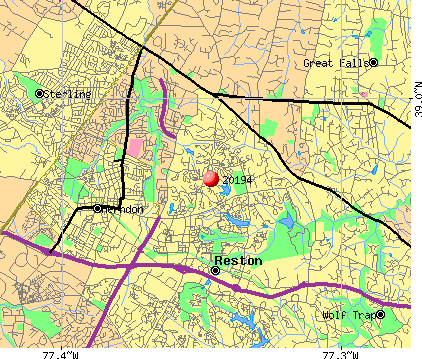
Land area: 3.2 sq. mi. Water area: 0.1 sq. mi.
Population density: 4,014 people per square mile
(average).
OSM Map
General Map
Google Map
MSN Map
OSM Map
General Map
Google Map
MSN Map
OSM Map
General Map
Google Map
MSN Map
OSM Map
General Map
Google Map
MSN Map
Please wait while loading the map...
Real estate property taxes paid for housing units in 2022:
This zip code:
1.0% ($7,711)
Virginia:
0.7% ($2,617)
Median real estate property taxes paid for housing units with mortgages in 2022: $7,254 (1.0%) Median real estate property taxes paid for housing units with no mortgage in 2022: $9,030 (1.0%)
Estimated median house/condo value in 2022: $799,202
20194:
$799,202
Virginia:
$365,700
According to our research of Virginia and other state lists, there were 5 registered sex offenders living in 20194 zip code as of April 27, 2024. The ratio of all residents to sex offenders in zip code 20194 is 2,641 to 1. The ratio of registered sex offenders to all residents in this zip code is much lower than the state average.
Median resident age:
This zip code:
42.6 years
Virginia median age:
39.0 years
Average household size:
This zip code:
2.2 people
Virginia:
2.5 people
Averages for the 2020 tax year for zip code 20194, filed in 2021:
Average Adjusted Gross Income (AGI) in 2020: $172,693 (Individual Income Tax Returns)
Here:
$172,693
State:
$86,446
Salary/wage: $143,631 (reported on 84.6% of returns)
Here:
$143,631
State:
$71,185
(% of AGI for various income ranges: 1239.7% for AGIs below $25k, 3870.0% for AGIs $25k-50k, 6545.4% for AGIs $50k-75k, 10280.6% for AGIs $75k-100k, 19349.9% for AGIs $100k-200k, 93596.5% for AGIs over 200k)
Taxable interest for individuals: $2,036 (reported on 53.7% of returns)
This zip code:
$2,036
Virginia:
$1,805
(% of AGI for various income ranges: 26.6% for AGIs below $25k, 54.7% for AGIs $25k-50k, 52.6% for AGIs $50k-75k, 79.8% for AGIs $75k-100k, 167.1% for AGIs $100k-200k, 839.1% for AGIs over 200k)
Ordinary dividends: $9,679 (reported on 47.1% of returns)
Here:
$9,679
State:
$8,327
(% of AGI for various income ranges: 87.4% for AGIs below $25k, 105.3% for AGIs $25k-50k, 186.0% for AGIs $50k-75k, 233.4% for AGIs $75k-100k, 614.9% for AGIs $100k-200k, 3932.4% for AGIs over 200k)
Net capital gain/loss in AGI: +$29,306 (reported on 43.3% of returns)
Here:
+$29,306
State:
+$24,644
(% of AGI for various income ranges: 44.3% for AGIs below $25k, 108.9% for AGIs $25k-50k, 111.1% for AGIs $50k-75k, 257.2% for AGIs $75k-100k, 641.3% for AGIs $100k-200k, 14238.7% for AGIs over 200k)
Profit/loss from business: +$38,556 (reported on 18.5% of returns)
Here:
+$38,556
State:
+$12,836
(% of AGI for various income ranges: 193.0% for AGIs below $25k, 236.4% for AGIs $25k-50k, 250.2% for AGIs $50k-75k, 294.0% for AGIs $75k-100k, 830.6% for AGIs $100k-200k, 6379.6% for AGIs over 200k)
Taxable individual retirement arrangement distribution: $31,896 (reported on 10.6% of returns)
20194:
$31,896
Virginia:
$21,535
(% of AGI for various income ranges: 59.2% for AGIs below $25k, 95.8% for AGIs $25k-50k, 235.1% for AGIs $50k-75k, 348.8% for AGIs $75k-100k, 799.9% for AGIs $100k-200k, 1950.6% for AGIs over 200k)
Self-employed (Keogh) retirement plans: $30,922 (reported on 3.4% of returns)
20194:
$30,922
Virginia:
$31,172
(% of AGI for various income ranges: 81.8% for AGIs $100k-200k, 1156.5% for AGIs over 200k)
Total itemized deductions: $32,674 (reported on 32.9% of returns)
Here:
$32,674
State:
$33,287
(% of AGI for various income ranges: 208.0% for AGIs below $25k, 289.6% for AGIs $25k-50k, 617.2% for AGIs $50k-75k, 989.8% for AGIs $75k-100k, 2137.7% for AGIs $100k-200k, 7270.0% for AGIs over 200k)
Charity contributions: $7,821 (reported on 26.7% of returns)
Here:
$7,821
State:
$10,381
(% of AGI for various income ranges: 3.9% for AGIs below $25k, 26.0% for AGIs $25k-50k, 62.1% for AGIs $50k-75k, 108.2% for AGIs $75k-100k, 324.7% for AGIs $100k-200k, 1802.8% for AGIs over 200k)
Taxes paid: $9,314 (reported on 32.9% of returns)
20194:
$9,314
State:
$8,284
(% of AGI for various income ranges: 33.6% for AGIs below $25k, 70.4% for AGIs $25k-50k, 159.1% for AGIs $50k-75k, 354.8% for AGIs $75k-100k, 726.6% for AGIs $100k-200k, 1833.7% for AGIs over 200k)
Earned income credit: $1,338 (reported on 3.5% of returns)
Here:
$1,338
State:
$2,214
(% of AGI for various income ranges: 36.2% for AGIs below $25k, 18.9% for AGIs $25k-50k)
Percentage of individuals using paid preparers for their 2020 taxes: 92.8%
Here:
93%
State:
92%
(% for various income ranges: 92.0% for AGIs below $25k, 90.3% for AGIs $25k-50k, 92.0% for AGIs $50k-75k, 92.0% for AGIs $75k-100k, 93.7% for AGIs $100k-200k, 94.1% for AGIs over 200k)
Averages for the 2012 tax year for zip code 20194, filed in 2013:
Average Adjusted Gross Income (AGI) in 2012: $149,475 (Individual Income Tax Returns)
Here:
$149,475
State:
$71,192
Salary/wage: $122,236 (reported on 89.2% of returns)
Here:
$122,236
State:
$59,229
(% of AGI for various income ranges: 80.9% for AGIs below $25k, 82.4% for AGIs $25k-50k, 82.4% for AGIs $50k-75k, 83.3% for AGIs $75k-100k, 83.3% for AGIs $100k-200k, 65.4% for AGIs over 200k)
Taxable interest for individuals: $1,883 (reported on 58.0% of returns)
This zip code:
$1,883
Virginia:
$1,600
(% of AGI for various income ranges: 2.4% for AGIs below $25k, 0.8% for AGIs $25k-50k, 0.7% for AGIs $50k-75k, 0.7% for AGIs $75k-100k, 0.7% for AGIs $100k-200k, 0.7% for AGIs over 200k)
Ordinary dividends: $8,615 (reported on 44.7% of returns)
Here:
$8,615
State:
$6,959
(% of AGI for various income ranges: 4.8% for AGIs below $25k, 1.9% for AGIs $25k-50k, 1.7% for AGIs $50k-75k, 1.6% for AGIs $75k-100k, 1.8% for AGIs $100k-200k, 3.1% for AGIs over 200k)
Net capital gain/loss in AGI: +$23,392 (reported on 38.0% of returns)
Here:
+$23,392
State:
+$16,672
(% of AGI for various income ranges: 0.7% for AGIs below $25k, 1.0% for AGIs $25k-50k, 0.4% for AGIs $50k-75k, 0.6% for AGIs $75k-100k, 0.5% for AGIs $100k-200k, 10.0% for AGIs over 200k)
Profit/loss from business: +$36,589 (reported on 17.4% of returns)
Here:
+$36,589
State:
+$14,116
(% of AGI for various income ranges: 7.9% for AGIs below $25k, 5.3% for AGIs $25k-50k, 5.4% for AGIs $50k-75k, 3.9% for AGIs $75k-100k, 3.4% for AGIs $100k-200k, 4.5% for AGIs over 200k)
Taxable individual retirement arrangement distribution: $27,059 (reported on 10.3% of returns)
20194:
$27,059
Virginia:
$16,667
(% of AGI for various income ranges: 2.8% for AGIs below $25k, 2.5% for AGIs $25k-50k, 2.0% for AGIs $50k-75k, 1.3% for AGIs $75k-100k, 2.0% for AGIs $100k-200k, 1.8% for AGIs over 200k)
Self-employment retirement plans: $31,165 (reported on 3.5% of returns)
20194:
$31,165
Virginia:
$25,373
(% of AGI for various income ranges: 1.4% for AGIs $50k-75k, 0.4% for AGIs $100k-200k, 1.0% for AGIs over 200k)
Total itemized deductions: $35,304 (17% of AGI, reported on 63.6% of returns)
Here:
$35,304
State:
$26,596
Here:
16.9% of AGI
State:
20.1% of AGI
(% of AGI for various income ranges: 24.8% for AGIs below $25k, 13.9% for AGIs $25k-50k, 16.2% for AGIs $50k-75k, 15.5% for AGIs $75k-100k, 17.6% for AGIs $100k-200k, 13.5% for AGIs over 200k)
Charity contributions: $4,376 (reported on 53.5% of returns)
Here:
$4,376
State:
$4,443
(% of AGI for various income ranges: 1.0% for AGIs below $25k, 1.1% for AGIs $25k-50k, 1.4% for AGIs $50k-75k, 1.4% for AGIs $75k-100k, 1.6% for AGIs $100k-200k, 1.6% for AGIs over 200k)
Taxes paid: $16,702 (reported on 63.3% of returns)
20194:
$16,702
State:
$9,951
(% of AGI for various income ranges: 5.0% for AGIs below $25k, 3.5% for AGIs $25k-50k, 5.2% for AGIs $50k-75k, 6.0% for AGIs $75k-100k, 7.8% for AGIs $100k-200k, 7.3% for AGIs over 200k)
Earned income credit: $1,382 (reported on 3.3% of returns)
Here:
$1,382
State:
$2,211
(% of AGI for various income ranges: 2.0% for AGIs below $25k, 0.3% for AGIs $25k-50k)
Percentage of individuals using paid preparers for their 2012 taxes: 42.6%
Here:
43%
State:
46%
(% for various income ranges: 36.1% for AGIs below $25k, 35.5% for AGIs $25k-50k, 38.8% for AGIs $50k-75k, 39.0% for AGIs $75k-100k, 41.2% for AGIs $100k-200k, 58.3% for AGIs over 200k)
Averages for the 2004 tax year for zip code 20194, filed in 2005:
Average Adjusted Gross Income (AGI) in 2004: $119,096 (Individual Income Tax Returns)
Here:
$119,096
State:
$56,704
Salary/wage: $100,761 (reported on 89.6% of returns)
Here:
$100,761
State:
$48,441
(% of AGI for various income ranges: 186.5% for AGIs below $10k, 83.2% for AGIs $10k-25k, 86.0% for AGIs $25k-50k, 87.7% for AGIs $50k-75k, 88.5% for AGIs $75k-100k, 72.2% for AGIs over 100k)
Taxable interest for individuals: $1,887 (reported on 65.0% of returns)
This zip code:
$1,887
Virginia:
$1,688
(% of AGI for various income ranges: 10.0% for AGIs below $10k, 2.9% for AGIs $10k-25k, 1.3% for AGIs $25k-50k, 1.0% for AGIs $50k-75k, 1.1% for AGIs $75k-100k, 0.9% for AGIs over 100k)
Taxable dividends: $4,695 (reported on 47.5% of returns)
Here:
$4,695
State:
$4,028
(% of AGI for various income ranges: 22.5% for AGIs below $10k, 3.0% for AGIs $10k-25k, 1.5% for AGIs $25k-50k, 1.0% for AGIs $50k-75k, 1.4% for AGIs $75k-100k, 2.0% for AGIs over 100k)
Net capital gain/loss: +$27,197 (reported on 40.9% of returns)
Here:
+$27,197
State:
+$14,375
(% of AGI for various income ranges: 18.6% for AGIs below $10k, 0.9% for AGIs $10k-25k, 0.9% for AGIs $25k-50k, 0.7% for AGIs $50k-75k, 0.6% for AGIs $75k-100k, 11.8% for AGIs over 100k)
Profit/loss from business: +$27,196 (reported on 16.4% of returns)
Here:
+$27,196
State:
+$13,342
(% of AGI for various income ranges: 10.5% for AGIs below $10k, 6.2% for AGIs $10k-25k, 4.4% for AGIs $25k-50k, 2.7% for AGIs $50k-75k, 2.4% for AGIs $75k-100k, 3.9% for AGIs over 100k)
IRA payment deduction: $3,143 (reported on 3.3% of returns)
20194:
$3,143
Virginia:
$2,943
(% of AGI for various income ranges: 0.5% for AGIs $10k-25k, 0.2% for AGIs $25k-50k, 0.2% for AGIs $50k-75k, 0.1% for AGIs $75k-100k, 0.1% for AGIs over 100k)
Self-employed pension: $20,578 (reported on 3.4% of returns)
Here:
$20,578
Virginia:
$17,430
(% of AGI for various income ranges: 0.3% for AGIs $25k-50k, 0.1% for AGIs $50k-75k, 0.2% for AGIs $75k-100k, 0.7% for AGIs over 100k)
Total itemized deductions: $29,550 (18% of AGI, reported on 64.2% of returns)
Here:
$29,550
State:
$21,492
Here:
17.7% of AGI
State:
21.0% of AGI
(% of AGI for various income ranges: 52.9% for AGIs below $10k, 20.6% for AGIs $10k-25k, 16.9% for AGIs $25k-50k, 18.7% for AGIs $50k-75k, 20.2% for AGIs $75k-100k, 14.9% for AGIs over 100k)
Charity contributions deductions: $3,423 (2% of AGI, reported on 56.8% of returns)
Here:
$3,423
State:
$3,794
Here:
1.9% of AGI
State:
3.5% of AGI
(% of AGI for various income ranges: 1.6% for AGIs below $10k, 1.3% for AGIs $10k-25k, 1.3% for AGIs $25k-50k, 1.6% for AGIs $50k-75k, 1.9% for AGIs $75k-100k, 1.6% for AGIs over 100k)
Total tax: $23,738 (reported on 89.2% of returns)
20194:
$23,738
State:
$9,537
(% of AGI for various income ranges: 10.3% for AGIs below $10k, 5.3% for AGIs $10k-25k, 8.8% for AGIs $25k-50k, 11.7% for AGIs $50k-75k, 12.8% for AGIs $75k-100k, 19.7% for AGIs over 100k)
Earned income credit: $1,319 (reported on 2.5% of returns)
Here:
$1,319
State:
$1,734
Percentage of individuals using paid preparers for their 2004 taxes: 44.0%
Here:
44%
State:
52%
(% for various income ranges: 35.0% for AGIs below $10k, 42.1% for AGIs $10k-25k, 43.2% for AGIs $25k-50k, 41.8% for AGIs $50k-75k, 40.2% for AGIs $75k-100k, 49.7% for AGIs over 100k)
Likely homosexual households (counted as self-reported same-sex unmarried-partner households)
Lesbian couples: 0.0% of all households
Gay men: 0.2% of all households
Household received Food Stamps/SNAP in the past 12 months: 39 Household did not receive Food Stamps/SNAP in the past 12 months: 5,713
Women who had a birth in the past 12 months: 86 (75 now married, 11 unmarried) Women who did not have a birth in the past 12 months: 2,818 (1,279 now married, 1,535 unmarried)
Housing units in zip code 20194 with a mortgage: 3,206 (409 second mortgage, 7 home equity loan, 356 both second mortgage and home equity loan) Houses without a mortgage: 74
Median monthly owner costs for units with a mortgage: $3,049 Median monthly owner costs for units without a mortgage: $1,092
Residents with income below the poverty level in 2022:
This zip code:
4.0%
Whole state:
10.6%
Residents with income below 50% of the poverty level in 2022:
This zip code:
1.8%
Whole state:
5.2%
Median number of rooms in houses and condos:
Here:
7.6
State:
7.0
Median number of rooms in apartments:
Here:
3.8
State:
4.3
Notable locations in this zip code not listed on our city pages
Churches in zip code 20194 include: Christ Baptist Church (A), Browns Chapel Church (B), Saint Annes Episcopal Church (C). Display/hide their locations on the map
Size of family households: 1,742 2-persons, 820 3-persons, 567 4-persons, 168 5-persons, 80 6-persons
Size of nonfamily households: 1,956 1-person, 477 2-persons, 36 3-persons
1,758 married couples with children.
419 single-parent households (163 men, 256 women).
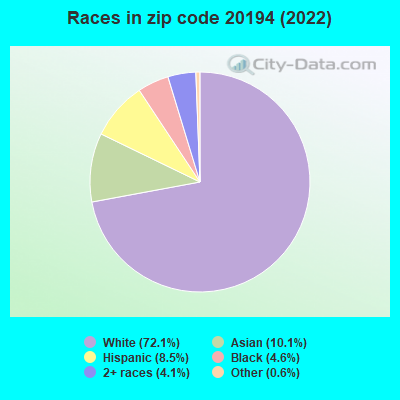
79.9% of residents of 20194 zip code speak English at home.
6.2% of residents speak Spanish at home (81% very well, 16% well, 2% not well).
6.5% of residents speak other Indo-European language at home (81% very well, 10% well, 8% not well, 1% not at all).
6.3% of residents speak Asian or Pacific Island language at home (84% very well, 15% well, 1% not well).
0.8% of residents speak other language at home (100% very well).
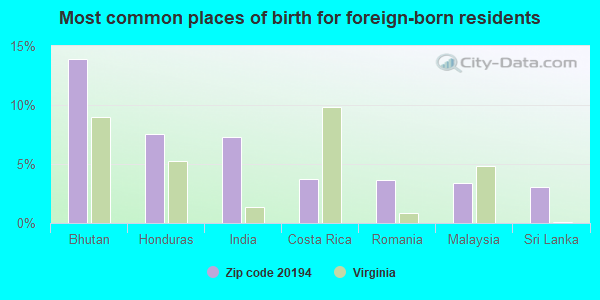
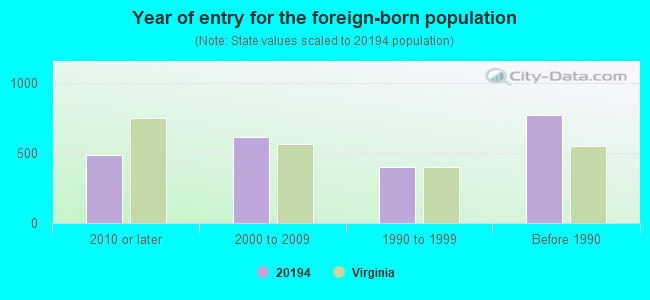
Foreign born population: 1,949 (15.4%) (70.2% of them are naturalized citizens)
Facilities with environmental interests located in this zip code:
ALDRIN ELEM (11375 CENTER HARBOUR RD in RESTON, VA)
(National Center for Education Statistics) - STATE ID-0292203 Organizations: FAIRFAX COUNTY PUBLIC SCHOOLS (SCHOOL DISTRICT)
Housing units lacking complete kitchen facilities: 0.1%
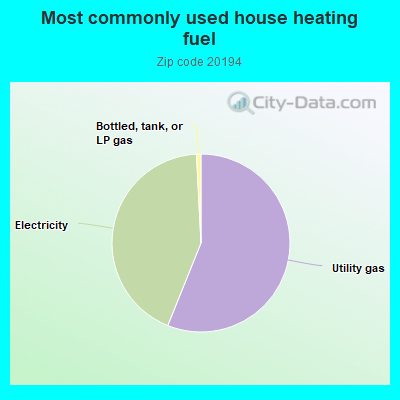
56.1%Utility gas
43.1%Electricity
0.8%Bottled, tank, or LP gas
Place of birth for U.S.-born residents:
This state: 3,153
Northeast: 2,522
Midwest: 1,182
South: 2,522
West: 1,025
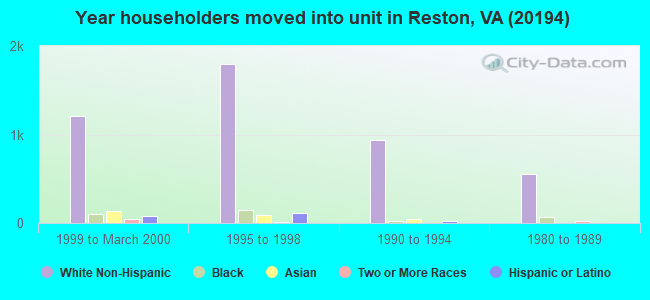
42% of the 20194 zip code residents lived in the same house 5 years ago. Out of people who lived in different houses, 44% lived in this county. Out of people who lived in different counties, 50% lived in Virginia.
87% of the 20194 zip code residents lived in the same house 1 year ago. Out of people who lived in different houses, 46% moved from this county. Out of people who lived in different houses, 12% moved from different county within same state. Out of people who lived in different houses, 31% moved from different state. Out of people who lived in different houses, 9% moved from abroad.
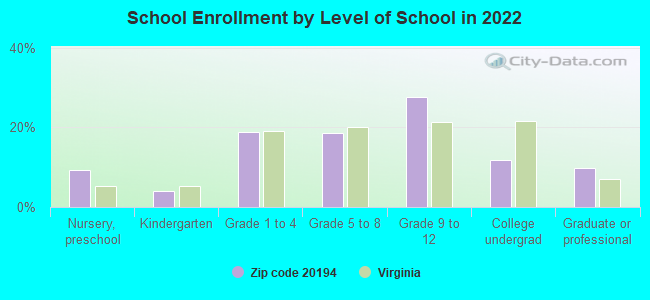
Private vs. public school enrollment:
Students in private schools in grades 1 to 8 (elementary and middle school): 104
Here:
11.2%
Virginia:
13.2%
Students in private schools in grades 9 to 12 (high school): 93
Here:
13.4%
Virginia:
10.2%
Students in private undergraduate colleges: 26
Here:
8.9%
Virginia:
18.7%
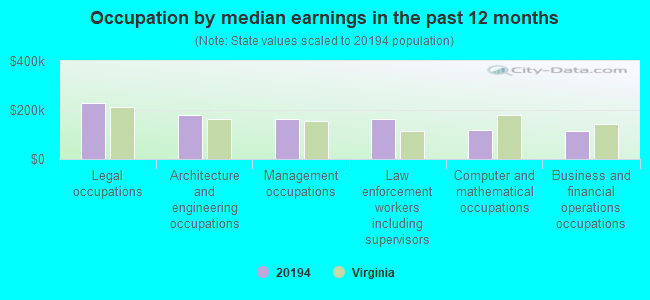
Occupation by median earnings in the past 12 months ($)
226,632Legal occupations
178,558Architecture and engineering occupations
163,919Management occupations
161,959Law enforcement workers including supervisors
117,916Computer and mathematical occupations
113,172Business and financial operations occupations
Companies with federal contracts located in this zip code (RESTON, VA):
TRIDEA WORKS, LLC (1163 FIELDVIEW DRIVE; small business) : $6,301,384 in 8 contractsfrom 2004 to 2006
Contracts for Technical Assistance by Navy Signed by year:2000: $0; 2001: $0; 2002: $0; 2003: $0; 2004: $1,000,000; 2005: $5,001,384; 2006: $300,000.
Biggest contracts:
$2,722,272 with Navy for Technical Assistance. Signed on 2005-09-20. Completion date: 2006-09-30.
$1,577,145, same as above.Signed on 2005-04-27. Completion date: 2005-09-30.
$1,000,000, same as above.Signed on 2004-09-28. Completion date: 2005-09-30.
$399,500, same as above.Signed on 2005-12-15. Completion date: 2006-09-30.
BRISTLECONE ENVIRONMENTAL TECH (1136 BRIGHT POND LANE; small business) : $423,550 in 3 contractsfrom 2000 to 2002
$390,000 with Federal Bureau of Investigation for Other Education and Training Services. Signed on 2000-09-15. Completion date: 2001-02-15.
$26,000 with Federal Bureau of Investigation for Miscellaneous Weapons. Signed on 2002-02-15. Completion date: 2002-09-15.
$7,550 with Army for Video Recording and Reproducing Equipment. Taking place in NY. Signed on 2002-09-20. Completion date: 2002-10-18.
SHERYL G COSING (10822 CRIPPEN VALE CT; small business) : $415,020 in 8 contractsfrom 1999 to 2006
Contracts for Other Professional Services by Army Signed by year:2000: $53,000; 2001: $55,000; 2002: $55,002; 2003: $55,000; 2004: $67,018; 2005: $0; 2006: $65,000.
Biggest contracts:
$65,000 with Army for Other Professional Services. Taking place in MD. Signed on 2006-01-13. Completion date: 2006-12-31.
$65,000, same as above.Signed on 2004-12-23. Completion date: 2005-12-31.
$65,000 with Army for Other Professional Services. Signed on 1999-12-02. Completion date: 2000-12-31.
$55,002 with Army for Other Professional Services. Taking place in MD. Signed on 2002-11-21. Completion date: 2003-12-31.
RESEARCH INSTITUTE FOR SMALL & (1311 GATES METAL WAY; small business)
$150,000 with Employment and Training Administration for Other Professional Services. Signed on 2002-07-15. Completion date: 2004-12-15.
BONNIE S GLASER (1325 WEDGEWOOD MANOR WAY; small business) : $121,603 in 2 contractsfrom 2001 to 2002
$83,893 with Department of Defense for Other Special Studies and Analyses. Taking place in DC. Signed on 2002-07-23. Completion date: 2003-07-31.
$37,710 with Army for Services -- Basic Research (R&D). Signed on 2001-05-08. Completion date: 2001-09-30.
SPIRER & ASSOCIATES (1312 SUNDIAL DRIVE; small business)
$48,000 with Army for Data Collection Services. Signed on 1999-11-22. Completion date: 2000-10-31.
SHEILA EGAN (1528 WOOD CREST DR.)
$37,440 with National Institutes of Health for Other Professional Services. Taking place in MD. Signed on 2005-10-19. Effective on 2005-11-01. Completion date: 2006-10-30.
BLUE CRANE LLC (1555 REGATTA LN; small business)
$10,640 with Navy for Miscellaneous Communication Equipment. Signed on 2005-09-19. Completion date: 2005-12-23.
Top industries in this zip code by the number of employees in 2005:
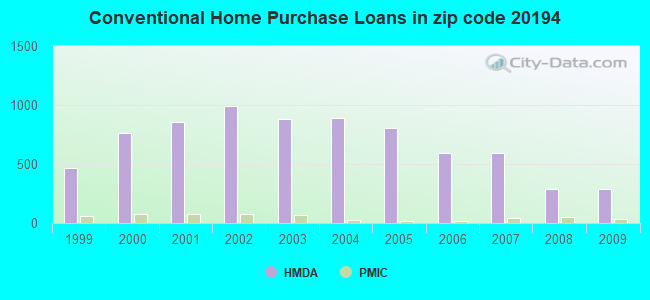
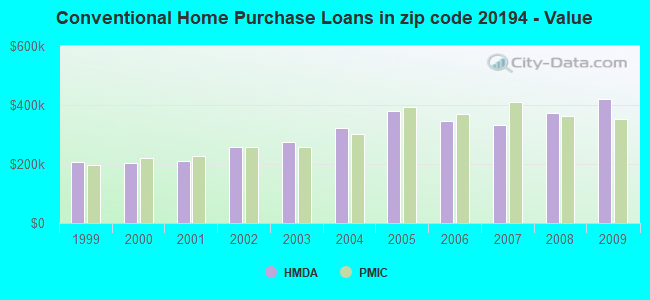
Detailed PMIC statistics for the following Tracts:4805.00
, 4820.00
2005 - 2018 National Fire Incident Reporting System (NFIRS) incidents
Based on the data from the years 2005 - 2018 the average number of fires per year is 14. The highest number of fire incidents - 22 took place in 2013, and the least - 9 in 2017. The data has a dropping trend.
When looking into fire subcategories, the most reports belonged to: Structure Fires (47.2%), and Outside Fires (34.7%).
Fire incident types reported to NFIRS in Zip Code 20194


 Nearest zip codes: 20190, 20170, 20191, 22066, 20164, 20171.


 Based on the data from the years 2005 - 2018 the average number of fires per year is 14. The highest number of fire incidents - 22 took place in 2013, and the least - 9 in 2017. The data has a dropping trend.
 When looking into fire subcategories, the most reports belonged to: Structure Fires (47.2%), and Outside Fires (34.7%).