Estimated zip code population in 2022: 18,575 Zip code population in 2010: 17,558 Zip code population in 2000: 13,867
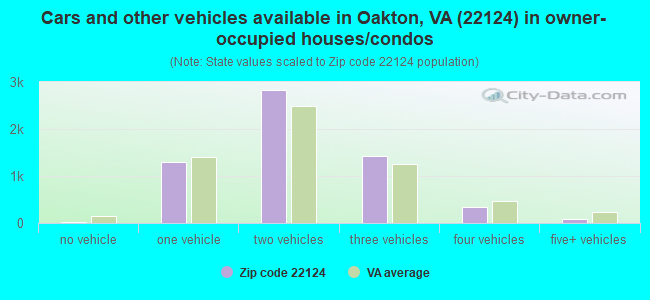
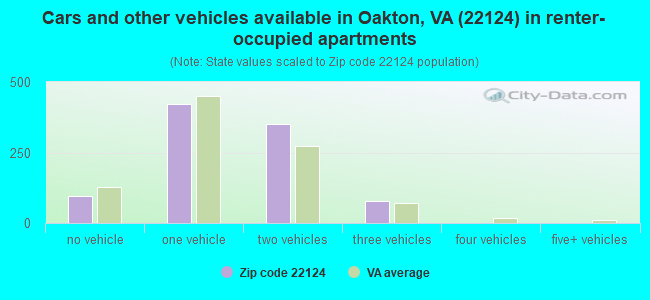
Houses and condos: 7,080 Renter-occupied apartments: 955
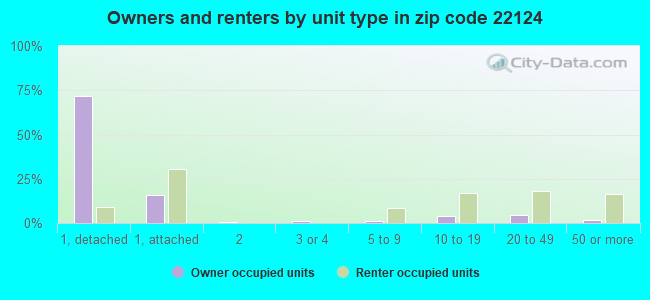
% of renters here:
14%
State:
33%
March 2022 cost of living index in zip code 22124: 167.3 (very high, U.S. average is 100)
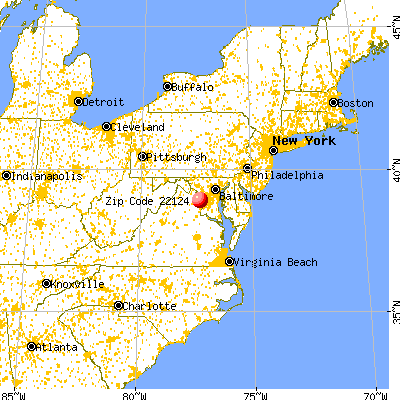
Land area: 10.1 sq. mi. Water area: 0.1 sq. mi.
Population density: 1,833 people per square mile
(low).
OSM Map
General Map
Google Map
MSN Map
OSM Map
General Map
Google Map
MSN Map
OSM Map
General Map
Google Map
MSN Map
OSM Map
General Map
Google Map
MSN Map
Please wait while loading the map...
Real estate property taxes paid for housing units in 2022:
This zip code:
1.0% ($9,359)
Virginia:
0.7% ($2,617)
Median real estate property taxes paid for housing units with mortgages in 2022: $9,344 (1.0%) Median real estate property taxes paid for housing units with no mortgage in 2022: $9,608 (1.0%)
Estimated median house/condo value in 2022: $984,097
22124:
$984,097
Virginia:
$365,700
According to our research of Virginia and other state lists, there were 7 registered sex offenders living in 22124 zip code as of April 26, 2024. The ratio of all residents to sex offenders in zip code 22124 is 2,696 to 1. The ratio of registered sex offenders to all residents in this zip code is much lower than the state average.
Median resident age:
This zip code:
43.4 years
Virginia median age:
39.0 years
Average household size:
This zip code:
2.7 people
Virginia:
2.5 people
Averages for the 2020 tax year for zip code 22124, filed in 2021:
Average Adjusted Gross Income (AGI) in 2020: $249,675 (Individual Income Tax Returns)
Here:
$249,675
State:
$86,446
Salary/wage: $179,176 (reported on 79.7% of returns)
Here:
$179,176
State:
$71,185
(% of AGI for various income ranges: 1156.9% for AGIs below $25k, 3816.7% for AGIs $25k-50k, 6789.0% for AGIs $50k-75k, 9723.8% for AGIs $75k-100k, 17712.7% for AGIs $100k-200k, 106365.1% for AGIs over 200k)
Taxable interest for individuals: $3,980 (reported on 60.9% of returns)
This zip code:
$3,980
Virginia:
$1,805
(% of AGI for various income ranges: 32.2% for AGIs below $25k, 84.9% for AGIs $25k-50k, 110.4% for AGIs $50k-75k, 118.8% for AGIs $75k-100k, 303.2% for AGIs $100k-200k, 1802.4% for AGIs over 200k)
Ordinary dividends: $17,668 (reported on 52.9% of returns)
Here:
$17,668
State:
$8,327
(% of AGI for various income ranges: 103.8% for AGIs below $25k, 162.2% for AGIs $25k-50k, 223.5% for AGIs $50k-75k, 361.0% for AGIs $75k-100k, 937.6% for AGIs $100k-200k, 7490.9% for AGIs over 200k)
Net capital gain/loss in AGI: +$57,027 (reported on 49.9% of returns)
Here:
+$57,027
State:
+$24,644
(% of AGI for various income ranges: 76.4% for AGIs below $25k, 199.6% for AGIs $25k-50k, 185.1% for AGIs $50k-75k, 370.7% for AGIs $75k-100k, 1154.5% for AGIs $100k-200k, 25765.8% for AGIs over 200k)
Profit/loss from business: +$38,275 (reported on 21.3% of returns)
Here:
+$38,275
State:
+$12,836
(% of AGI for various income ranges: 248.8% for AGIs below $25k, 352.0% for AGIs $25k-50k, 509.2% for AGIs $50k-75k, 363.1% for AGIs $75k-100k, 610.9% for AGIs $100k-200k, 6301.8% for AGIs over 200k)
Taxable individual retirement arrangement distribution: $37,992 (reported on 12.5% of returns)
22124:
$37,992
Virginia:
$21,535
(% of AGI for various income ranges: 50.7% for AGIs below $25k, 127.8% for AGIs $25k-50k, 303.1% for AGIs $50k-75k, 393.3% for AGIs $75k-100k, 1250.3% for AGIs $100k-200k, 2709.2% for AGIs over 200k)
Self-employed (Keogh) retirement plans: $42,859 (reported on 3.9% of returns)
22124:
$42,859
Virginia:
$31,172
(% of AGI for various income ranges: 98.4% for AGIs $100k-200k, 1525.6% for AGIs over 200k)
Total itemized deductions: $43,370 (reported on 37.2% of returns)
Here:
$43,370
State:
$33,287
(% of AGI for various income ranges: 187.9% for AGIs below $25k, 382.7% for AGIs $25k-50k, 886.9% for AGIs $50k-75k, 1459.8% for AGIs $75k-100k, 2513.2% for AGIs $100k-200k, 11188.8% for AGIs over 200k)
Charity contributions: $16,018 (reported on 31.4% of returns)
Here:
$16,018
State:
$10,381
(% of AGI for various income ranges: 7.6% for AGIs below $25k, 23.1% for AGIs $25k-50k, 77.1% for AGIs $50k-75k, 162.9% for AGIs $75k-100k, 406.3% for AGIs $100k-200k, 4274.9% for AGIs over 200k)
Taxes paid: $9,610 (reported on 37.0% of returns)
22124:
$9,610
State:
$8,284
(% of AGI for various income ranges: 33.0% for AGIs below $25k, 88.7% for AGIs $25k-50k, 252.2% for AGIs $50k-75k, 446.0% for AGIs $75k-100k, 781.4% for AGIs $100k-200k, 2120.7% for AGIs over 200k)
Earned income credit: $1,578 (reported on 3.7% of returns)
Here:
$1,578
State:
$2,214
(% of AGI for various income ranges: 33.6% for AGIs below $25k, 37.5% for AGIs $25k-50k)
Percentage of individuals using paid preparers for their 2020 taxes: 89.8%
Here:
90%
State:
92%
(% for various income ranges: 86.9% for AGIs below $25k, 90.2% for AGIs $25k-50k, 90.4% for AGIs $50k-75k, 89.6% for AGIs $75k-100k, 88.3% for AGIs $100k-200k, 92.1% for AGIs over 200k)
Averages for the 2012 tax year for zip code 22124, filed in 2013:
Average Adjusted Gross Income (AGI) in 2012: $200,587 (Individual Income Tax Returns)
Here:
$200,587
State:
$71,192
Salary/wage: $146,543 (reported on 83.4% of returns)
Here:
$146,543
State:
$59,229
(% of AGI for various income ranges: 77.7% for AGIs below $25k, 76.7% for AGIs $25k-50k, 75.0% for AGIs $50k-75k, 70.0% for AGIs $75k-100k, 71.0% for AGIs $100k-200k, 56.9% for AGIs over 200k)
Taxable interest for individuals: $4,317 (reported on 64.7% of returns)
This zip code:
$4,317
Virginia:
$1,600
(% of AGI for various income ranges: 2.9% for AGIs below $25k, 1.2% for AGIs $25k-50k, 1.2% for AGIs $50k-75k, 1.2% for AGIs $75k-100k, 1.1% for AGIs $100k-200k, 1.5% for AGIs over 200k)
Ordinary dividends: $15,270 (reported on 53.0% of returns)
Here:
$15,270
State:
$6,959
(% of AGI for various income ranges: 6.7% for AGIs below $25k, 2.6% for AGIs $25k-50k, 2.9% for AGIs $50k-75k, 2.5% for AGIs $75k-100k, 2.8% for AGIs $100k-200k, 4.4% for AGIs over 200k)
Net capital gain/loss in AGI: +$32,915 (reported on 45.9% of returns)
Here:
+$32,915
State:
+$16,672
(% of AGI for various income ranges: 1.9% for AGIs below $25k, 0.4% for AGIs $25k-50k, 0.6% for AGIs $50k-75k, 0.7% for AGIs $75k-100k, 1.6% for AGIs $100k-200k, 9.8% for AGIs over 200k)
Profit/loss from business: +$40,586 (reported on 19.6% of returns)
Here:
+$40,586
State:
+$14,116
(% of AGI for various income ranges: 9.2% for AGIs below $25k, 5.7% for AGIs $25k-50k, 4.3% for AGIs $50k-75k, 3.9% for AGIs $75k-100k, 4.7% for AGIs $100k-200k, 3.7% for AGIs over 200k)
Taxable individual retirement arrangement distribution: $29,198 (reported on 14.3% of returns)
22124:
$29,198
Virginia:
$16,667
(% of AGI for various income ranges: 2.8% for AGIs below $25k, 3.2% for AGIs $25k-50k, 2.7% for AGIs $50k-75k, 3.9% for AGIs $75k-100k, 3.3% for AGIs $100k-200k, 1.6% for AGIs over 200k)
Self-employment retirement plans: $31,427 (reported on 4.9% of returns)
22124:
$31,427
Virginia:
$25,373
(% of AGI for various income ranges: 0.6% for AGIs $50k-75k, 0.5% for AGIs $100k-200k, 0.9% for AGIs over 200k)
Total itemized deductions: $46,738 (16% of AGI, reported on 65.9% of returns)
Here:
$46,738
State:
$26,596
Here:
16.3% of AGI
State:
20.1% of AGI
(% of AGI for various income ranges: 22.7% for AGIs below $25k, 17.9% for AGIs $25k-50k, 19.7% for AGIs $50k-75k, 21.6% for AGIs $75k-100k, 20.4% for AGIs $100k-200k, 13.5% for AGIs over 200k)
Charity contributions: $6,647 (reported on 58.1% of returns)
Here:
$6,647
State:
$4,443
(% of AGI for various income ranges: 1.0% for AGIs below $25k, 1.3% for AGIs $25k-50k, 1.7% for AGIs $50k-75k, 2.1% for AGIs $75k-100k, 2.1% for AGIs $100k-200k, 1.9% for AGIs over 200k)
Taxes paid: $23,089 (reported on 65.6% of returns)
22124:
$23,089
State:
$9,951
(% of AGI for various income ranges: 4.9% for AGIs below $25k, 4.6% for AGIs $25k-50k, 6.7% for AGIs $50k-75k, 7.9% for AGIs $75k-100k, 8.6% for AGIs $100k-200k, 7.4% for AGIs over 200k)
Earned income credit: $1,659 (reported on 3.4% of returns)
Here:
$1,659
State:
$2,211
(% of AGI for various income ranges: 2.1% for AGIs below $25k, 0.4% for AGIs $25k-50k)
Percentage of individuals using paid preparers for their 2012 taxes: 46.4%
Here:
46%
State:
46%
(% for various income ranges: 40.4% for AGIs below $25k, 40.9% for AGIs $25k-50k, 42.7% for AGIs $50k-75k, 45.1% for AGIs $75k-100k, 42.9% for AGIs $100k-200k, 58.3% for AGIs over 200k)
Averages for the 2004 tax year for zip code 22124, filed in 2005:
Average Adjusted Gross Income (AGI) in 2004: $155,774 (Individual Income Tax Returns)
Here:
$155,774
State:
$56,704
Salary/wage: $128,817 (reported on 83.2% of returns)
Here:
$128,817
State:
$48,441
(% of AGI for various income ranges: 75.7% for AGIs $10k-25k, 76.7% for AGIs $25k-50k, 74.9% for AGIs $50k-75k, 72.5% for AGIs $75k-100k, 67.3% for AGIs over 100k)
Taxable interest for individuals: $3,228 (reported on 71.7% of returns)
This zip code:
$3,228
Virginia:
$1,688
(% of AGI for various income ranges: 4.6% for AGIs $10k-25k, 1.6% for AGIs $25k-50k, 1.9% for AGIs $50k-75k, 1.7% for AGIs $75k-100k, 1.4% for AGIs over 100k)
Taxable dividends: $7,035 (reported on 57.5% of returns)
Here:
$7,035
State:
$4,028
(% of AGI for various income ranges: 4.2% for AGIs $10k-25k, 2.1% for AGIs $25k-50k, 2.4% for AGIs $50k-75k, 2.5% for AGIs $75k-100k, 2.5% for AGIs over 100k)
Net capital gain/loss: +$25,561 (reported on 50.3% of returns)
Here:
+$25,561
State:
+$14,375
(% of AGI for various income ranges: 1.0% for AGIs $10k-25k, 0.8% for AGIs $25k-50k, 1.1% for AGIs $50k-75k, 1.9% for AGIs $75k-100k, 9.2% for AGIs over 100k)
Profit/loss from business: +$37,990 (reported on 18.1% of returns)
Here:
+$37,990
State:
+$13,342
(% of AGI for various income ranges: 8.0% for AGIs $10k-25k, 4.7% for AGIs $25k-50k, 3.0% for AGIs $50k-75k, 4.3% for AGIs $75k-100k, 4.4% for AGIs over 100k)
IRA payment deduction: $3,308 (reported on 3.6% of returns)
22124:
$3,308
Virginia:
$2,943
(% of AGI for various income ranges: 0.4% for AGIs $10k-25k, 0.3% for AGIs $25k-50k, 0.2% for AGIs $50k-75k, 0.2% for AGIs $75k-100k, 0.0% for AGIs over 100k)
Self-employed pension: $21,813 (reported on 5.5% of returns)
Here:
$21,813
Virginia:
$17,430
(% of AGI for various income ranges: 0.3% for AGIs $50k-75k, 0.5% for AGIs $75k-100k, 0.8% for AGIs over 100k)
Total itemized deductions: $40,210 (17% of AGI, reported on 64.3% of returns)
Here:
$40,210
State:
$21,492
Here:
17.5% of AGI
State:
21.0% of AGI
(% of AGI for various income ranges: 27.3% for AGIs $10k-25k, 18.7% for AGIs $25k-50k, 21.3% for AGIs $50k-75k, 23.2% for AGIs $75k-100k, 15.7% for AGIs over 100k)
Charity contributions deductions: $5,438 (2% of AGI, reported on 59.0% of returns)
Here:
$5,438
State:
$3,794
Here:
2.4% of AGI
State:
3.5% of AGI
(% of AGI for various income ranges: 1.2% for AGIs $10k-25k, 1.6% for AGIs $25k-50k, 2.1% for AGIs $50k-75k, 2.4% for AGIs $75k-100k, 2.0% for AGIs over 100k)
Total tax: $36,730 (reported on 86.1% of returns)
22124:
$36,730
State:
$9,537
(% of AGI for various income ranges: 5.1% for AGIs $10k-25k, 8.8% for AGIs $25k-50k, 10.7% for AGIs $50k-75k, 11.5% for AGIs $75k-100k, 21.7% for AGIs over 100k)
Earned income credit: $1,364 (reported on 2.5% of returns)
Here:
$1,364
State:
$1,734
Percentage of individuals using paid preparers for their 2004 taxes: 46.4%
Here:
46%
State:
52%
(% for various income ranges: 42.7% for AGIs below $10k, 48.3% for AGIs $10k-25k, 40.5% for AGIs $25k-50k, 41.2% for AGIs $50k-75k, 42.6% for AGIs $75k-100k, 51.4% for AGIs over 100k)
Likely homosexual households (counted as self-reported same-sex unmarried-partner households)
Lesbian couples: 0.1% of all households
Gay men: 0.0% of all households
Household received Food Stamps/SNAP in the past 12 months: 42 Household did not receive Food Stamps/SNAP in the past 12 months: 6,806
Women who had a birth in the past 12 months: 257 (246 now married, 16 unmarried) Women who did not have a birth in the past 12 months: 4,228 (2,126 now married, 2,090 unmarried)
Housing units in zip code 22124 with a mortgage: 4,446 (577 second mortgage, 6 home equity loan, 531 both second mortgage and home equity loan) Houses without a mortgage: 11
Median monthly owner costs for units with a mortgage: $3,567 Median monthly owner costs for units without a mortgage: $1,140
Residents with income below the poverty level in 2022:
This zip code:
2.3%
Whole state:
10.6%
Residents with income below 50% of the poverty level in 2022:
This zip code:
0.8%
Whole state:
5.2%
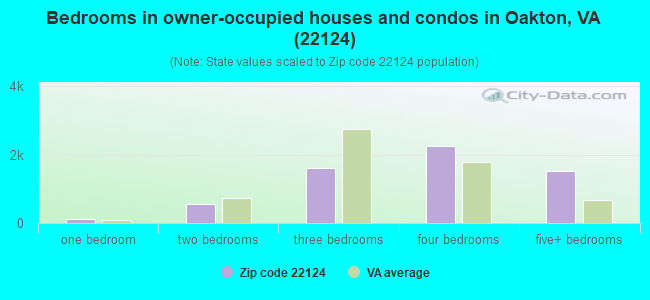
Median number of rooms in houses and condos:
Here:
10.0
State:
7.0
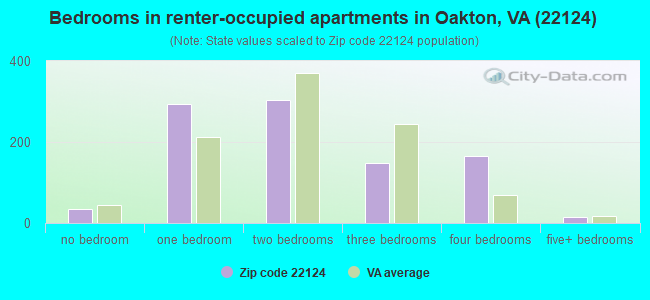
Median number of rooms in apartments:
Here:
5.5
State:
4.3
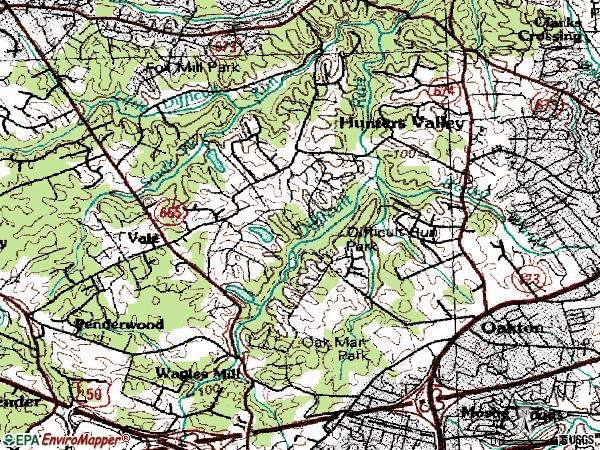
Notable locations in this zip code not listed on our city pages
Shopping Centers: Hunter Mill Plaza Shopping Center (1), Oakton Shopping Center (2), Twin Oakes Plaza Shopping Center (3). Display/hide their locations on the map
Churches in zip code 22124 include: Living Covenant Church (A), Cornerstone International Church (B), Fair Oaks Alliance Bible Church (C), Christ the Servant Lutheran Church (D), Fairfax Unitarian Church (E), The Church of Jesus Christ of Latter Day Saints (F), Whole World Fellowship Church (G), Vale Methodist Church (H), Baptist Fellowship Church (I). Display/hide their locations on the map
Parks in zip code 22124 include: Oakborough Square Park (1), Foxvale Park (2), Oak Marr Park (3), Tattersall Park (4). Display/hide their locations on the map
In group quarters: 14 (-1 institutionalized population)
Size of family households: 2,069 2-persons, 1,258 3-persons, 1,251 4-persons, 383 5-persons, 150 6-persons, 41 7-or-more-persons
Size of nonfamily households: 1,466 1-person, 272 2-persons, 23 3-persons
4,034 married couples with children.
368 single-parent households (170 men, 198 women).
75.1% of residents of 22124 zip code speak English at home.
5.1% of residents speak Spanish at home (85% very well, 9% well, 6% not well).
6.7% of residents speak other Indo-European language at home (84% very well, 11% well, 4% not well).
11.2% of residents speak Asian or Pacific Island language at home (68% very well, 21% well, 11% not well).
2.1% of residents speak other language at home (65% very well, 21% well, 13% not well, 1% not at all).
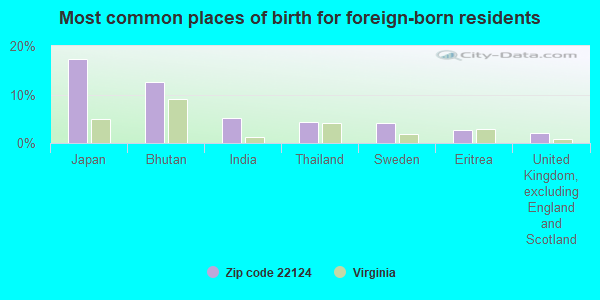
Foreign born population: 4,511 (24.3%) (78.4% of them are naturalized citizens)
This zip code:
24.3%
Whole state:
12.7%
17%Japan
13%Bhutan
5%India
4%Thailand
4%Sweden
3%Eritrea
2%United Kingdom, excluding England and Scotland
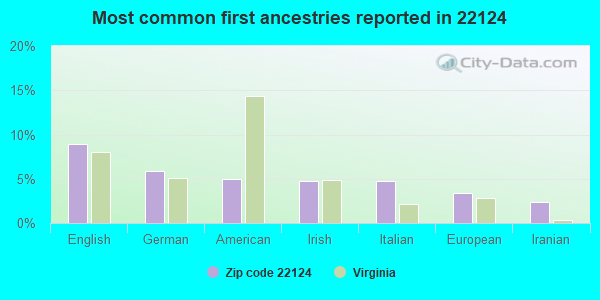
9%English
6%German
5%American
5%Irish
5%Italian
3%European
2%Iranian
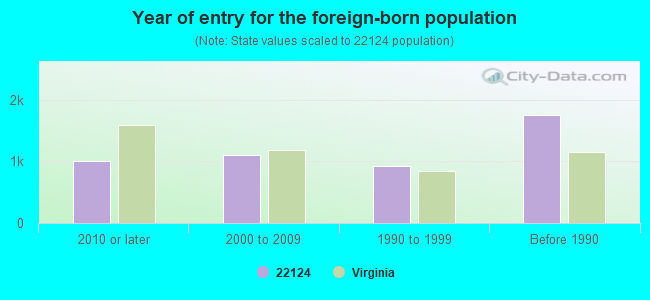
Year of entry for the foreign-born population
1,0132010 or later
1,1062000 to 2009
9181990 to 1999
1,753Before 1990
Facilities with environmental interests located in this zip code:
AIRSTON GROUP III, INC. (FOX MILL RD & FOX VALE DR in OAKTON, VA)
(Integrated Compliance Information System) - ICIS-03-2001-0185, FORMAL ENFORCEMENT ACTION Business SIC classification: GENERAL CONTRACTORS-INDUSTRIAL BUILDINGS AND WAREHOUSES
Housing units lacking complete kitchen facilities: 0.6%
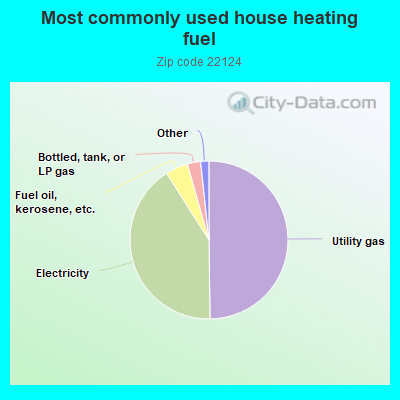
49.8%Utility gas
41.2%Electricity
4.6%Fuel oil, kerosene, etc.
2.7%Bottled, tank, or LP gas
0.9%No fuel used
0.7%Wood
Population in 1990: 13,019. Population change in the 1990s: +848 (+6.5%).
Place of birth for U.S.-born residents:
This state: 5,433
Northeast: 2,688
Midwest: 1,585
South: 2,900
West: 1,152
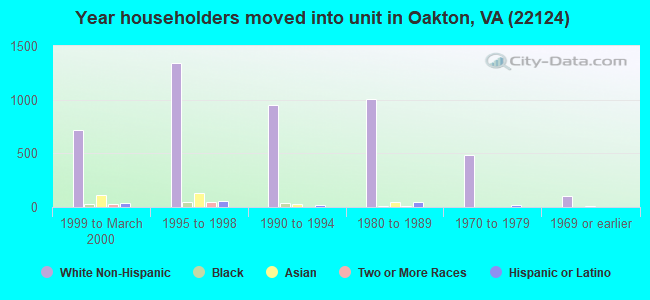
55% of the 22124 zip code residents lived in the same house 5 years ago. Out of people who lived in different houses, 45% lived in this county. Out of people who lived in different counties, 50% lived in Virginia.
89% of the 22124 zip code residents lived in the same house 1 year ago. Out of people who lived in different houses, 40% moved from this county. Out of people who lived in different houses, 19% moved from different county within same state. Out of people who lived in different houses, 33% moved from different state. Out of people who lived in different houses, 8% moved from abroad.
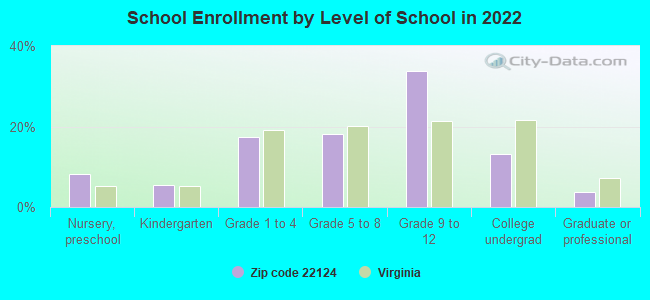
Private vs. public school enrollment:
Students in private schools in grades 1 to 8 (elementary and middle school): 311
Here:
18.7%
Virginia:
13.2%
Students in private schools in grades 9 to 12 (high school): 334
Here:
21.3%
Virginia:
10.2%
Students in private undergraduate colleges: 70
Here:
11.4%
Virginia:
18.7%
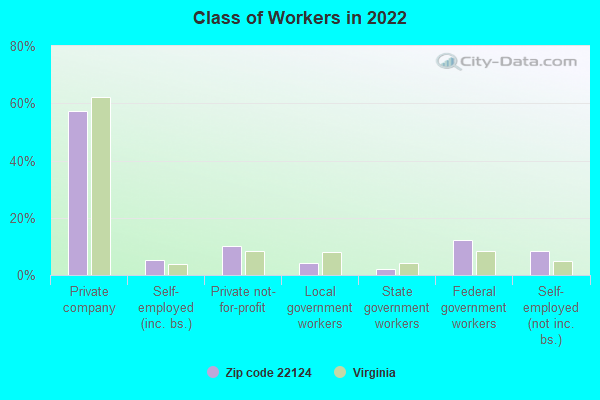
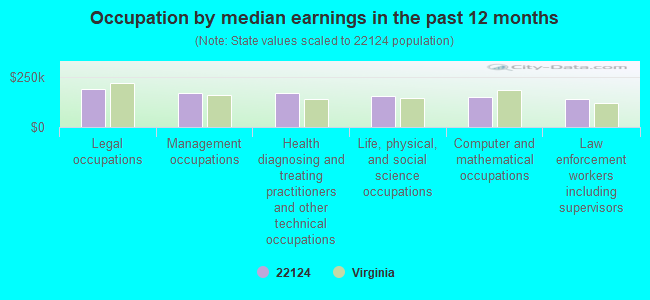
Occupation by median earnings in the past 12 months ($)
189,542Legal occupations
171,379Management occupations
169,143Health diagnosing and treating practitioners and other technical occupations
158,047Life, physical, and social science occupations
150,889Computer and mathematical occupations
138,907Law enforcement workers including supervisors
Companies with biggest federal contracts located in this zip code (OAKTON, VA):
A T & T CORP (3033 CHAIN BRIDGE RD) : $23,039,678 in 262 contractsfrom 1999 to 2004
Contracts for Lease or Rental of Equipment -- Communication, Detection, and Coherent Radiation Equipment, ADP Telecommunications and Transmission Services, Telecommunications Network Management Services, Other ADP and Telecommunications Services (includes data storage on tapes, compact disks, etc.), and moreby Department of Defense, Departmental Offices, NASA, Defense Information Systems Agency, and others Signed by year:2000: $4,461,204; 2001: $11,985,125; 2002: $3,652,030; 2003: $2,622,117; 2004: $205,827; 2005: $0; 2006: $0.
Biggest contracts:
$715,911 with Department of Defense for Lease or Rental of Equipment -- Communication, Detection, and Coherent Radiation Equipment. Signed on 2001-06-30. Completion date: 2006-01-27.
$576,959, same as above.Signed on 2001-04-30. Completion date: 2006-01-27.
$547,073, same as above.Signed on 2001-05-31. Completion date: 2006-01-27.
$498,552, same as above.Signed on 2001-04-30. Completion date: 2006-01-27.
BBE SALES & LEASING (2705 CLARKES LANDING DR; small business) : $1,696,241 in 80 contractsfrom 2001 to 2006
Contracts for Lease or Rental of Equipment -- Miscellaneous, Lease or Rental of Equipment -- Service and Trade Equipment, Lease or Rental of Equipment -- Household and Commercial Furnishings and Appliances, Maintenance, Repair and Rebuilding of Equipment -- Miscellaneous by Navy, Army, Air Force Signed by year:2000: $0; 2001: $192,173; 2002: $338,834; 2003: $315,078; 2004: $443,076; 2005: $388,636; 2006: $18,444.
Biggest contracts:
$89,299 with Navy for Lease or Rental of Equipment -- Miscellaneous. Taking place in SC. Signed on 2005-10-19. Completion date: 2006-09-30.
$86,977, same as above.Signed on 2004-11-12. Completion date: 2005-09-30.
$78,697 with Navy for Lease or Rental of Equipment -- Service and Trade Equipment. Signed on 2002-10-01. Completion date: 2003-09-30.
$78,262 with Navy for Lease or Rental of Equipment -- Miscellaneous. Signed on 2003-11-13. Completion date: 2004-09-30.
STATCOM, INC. (3007 WESTHURST LANE; small business) : $986,439 in 2 contractsfrom 1999 to 2000
$1,185,000 with Army for ADP Facility Operation and Maintenance Services. Signed on 1999-10-01. Completion date: 1999-09-30.
-$198,561 with Army for Automated Information System Design and Integration Services. Signed on 2000-09-05. Completion date: 1999-10-30.
MSC ASSOCIATES INC (2837 THAXTON LANE; small business) : $843,200 in 30 contractsfrom 2000 to 2006
Contracts for Other Education and Training Services, Education Services, Other Management Support Services, Training/Curriculum Development by U.S. Army Corps of Engineers - civil program financing only, Army Signed by year:2000: $126,000; 2001: $0; 2002: $32,400; 2003: $133,400; 2004: $213,000; 2005: $314,700; 2006: $23,700.
Biggest contracts:
$82,000 with U.S. Army Corps of Engineers - civil program financing only for Other Education and Training Services. Signed on 2005-05-19. Completion date: 2005-06-30.
$82,000 with Army for Other Education and Training Services. Signed on 2005-05-19. Completion date: 2005-06-30.
$81,500, same as above.Signed on 2005-08-30. Completion date: 2006-09-30.
$80,700 with U.S. Army Corps of Engineers - civil program financing only for Education Services. Signed on 2000-09-25. Completion date: 2001-07-13.
GALBO, CLAUDIA E (10102 OAKTON DR; small business) : $597,043 in 2 contractsfrom 2004 to 2005
$347,443 with Navy for Radiology Services. Taking place in MD. Signed on 2005-10-21. Completion date: 2005-09-30.
$249,600, same as above.Signed on 2004-12-14. Completion date: 2005-09-30.
JERE D DANDO (3103FOX DEN LANE; small business) : $551,954 in 18 contractsfrom 2002 to 2006
Contracts for Other Defense -- Management and Support (R&D), Other Defense -- Applied Research and Exploratory Development (R&D), Systems Engineering Services by Army Signed by year:2000: $0; 2001: $0; 2002: $174,416; 2003: $79,159; 2004: $119,088; 2005: $139,893; 2006: $39,398.
Biggest contracts:
$105,151 with Army for Other Defense -- Management and Support (R&D). Signed on 2005-09-13. Completion date: 2006-02-14.
$89,893 with Army for Other Defense -- Applied Research and Exploratory Development (R&D). Signed on 2002-09-30. Completion date: 2003-05-31.
$51,998, same as above.Signed on 2003-07-28. Completion date: 2004-01-28.
$43,450 with Army for Other Defense -- Management and Support (R&D). Signed on 2004-06-10. Completion date: 2004-12-15.
OPEN SOURCE SOLUTIONS INC (11005 LANGTON ARMS COURT; small business) : $350,874 in 4 contractsfrom 2000 to 2003
$99,999 with Department of Defense for Other Special Studies and Analyses. Signed on 2002-07-01. Completion date: 2003-06-30.
$99,875, same as above.Signed on 2003-07-01. Completion date: 2004-06-30.
$76,000, same as above.Signed on 2001-02-07. Completion date: 2002-02-06.
$75,000 with Department of Defense for Other Management Support Services. Signed on 2000-07-20. Completion date: 2001-01-31.
WORLD POOL SERVICE, INC (12110 WAYLAND STREET; small business) : $181,090 in 5 contractsfrom 2000 to 2003
Contracts for Recreational Services, Other Management Support Services, Construction of Structures and Facilities -- Recreation Facilities (Non-Building) by Army Signed by year:2000: $75,625; 2001: $155,040; 2002: -$80,980; 2003: $31,405; 2004: $0; 2005: $0; 2006: $0.
Biggest contracts:
$77,520 with Army for Recreational Services. Signed on 2001-05-01. Completion date: 2002-09-08.
$77,520 with Army for Other Management Support Services. Signed on 2001-08-22. Completion date: 2002-09-08.
$75,625, same as above.Signed on 2000-05-23. Completion date: 2002-09-08.
$31,405 with Army for Construction of Structures and Facilities -- Recreation Facilities (Non-Building). Signed on 2003-09-11. Completion date: 2003-10-30.
CHINN RIDGE CONSTRUCTION COMPA (10145 PALMER DR; small business) : $156,939 in 3 contractsin 2005
$67,156 with Air Force for Maintenance, Repair or Alteration of Real Property -- Other Administrative Facilities and Service Buildings. Taking place in NC. Signed on 2005-09-17. Completion date: 2006-01-15.
$49,703 with Air Force for Maintenance, Repair or Alteration of Real Property -- Heating and Cooling Plants. Taking place in NC. Signed on 2005-09-26. Completion date: 2005-11-25.
$40,080, same as above.Signed on 2005-09-27. Completion date: 2005-01-25.
OSS NET, INC (11005 LANGTON ARMS COURT; small business) : $151,738 in 6 contractsfrom 2004 to 2005
Contracts for Other Management Support Services, Educational Services by Army Signed by year:2000: $0; 2001: $0; 2002: $0; 2003: $0; 2004: $299,344; 2005: -$147,606; 2006: $0.
Biggest contracts:
$226,008 with Army for Other Management Support Services. Signed on 2004-09-30. Completion date: 2005-09-29.
$55,002, same as above.Signed on 2004-12-15. Completion date: 2005-09-29.
$36,668, same as above.Signed on 2005-02-16. Completion date: 2005-09-29.
$18,334, same as above.Signed on 2004-10-28. Completion date: 2005-09-29.
Top industries in this zip code by the number of employees in 2005:
Administrative and Support and Waste Management and Remediation Services: Security Guards and Patrol Services (over 1000 employees: 1 establishment, 500-999 employees: 1 establishment, 50-99 employees: 2 establishments, 20-49 employees: 1 establishment, 1-4 employees: 1 establishment)
2004 - 2018 National Fire Incident Reporting System (NFIRS) incidents
According to the data from the years 2004 - 2018 the average number of fires per year is 30. The highest number of fires - 46 took place in 2006, and the least - 3 in 2004. The data has a rising trend.
When looking into fire subcategories, the most reports belonged to: Outside Fires (40.0%), and Structure Fires (39.8%).
Fire incident types reported to NFIRS in Zip Code 22124


 Nearest zip codes: 22185, 22181, 22035, 20191, 22033, 22030.


 According to the data from the years 2004 - 2018 the average number of fires per year is 30. The highest number of fires - 46 took place in 2006, and the least - 3 in 2004. The data has a rising trend.
 When looking into fire subcategories, the most reports belonged to: Outside Fires (40.0%), and Structure Fires (39.8%).