Estimated zip code population in 2022: 38,874 Zip code population in 2010: 37,691 Zip code population in 2000: 33,043
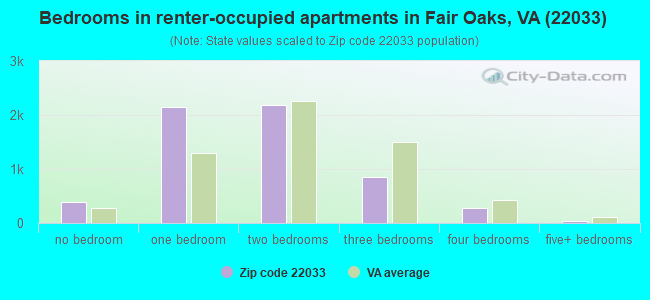
Houses and condos: 16,325 Renter-occupied apartments: 5,828
% of renters here:
37%
State:
33%
March 2022 cost of living index in zip code 22033: 165.8 (very high, U.S. average is 100)
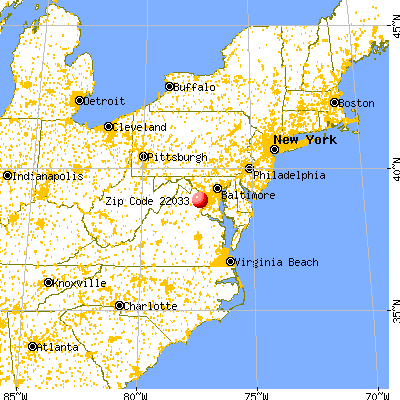
Land area: 7.6 sq. mi. Water area: 0.1 sq. mi.
Population density: 5,137 people per square mile
(average).
OSM Map
General Map
Google Map
MSN Map
OSM Map
General Map
Google Map
MSN Map
OSM Map
General Map
Google Map
MSN Map
OSM Map
General Map
Google Map
MSN Map
Please wait while loading the map...
Real estate property taxes paid for housing units in 2022:
This zip code:
0.9% ($6,025)
Virginia:
0.7% ($2,617)
Median real estate property taxes paid for housing units with mortgages in 2022: $5,904 (0.9%) Median real estate property taxes paid for housing units with no mortgage in 2022: $6,533 (1.0%)
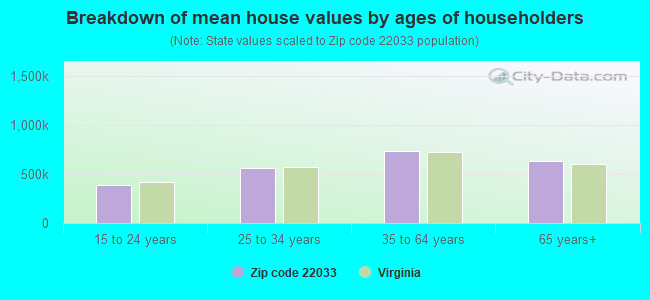
Estimated median house/condo value in 2022: $652,728
22033:
$652,728
Virginia:
$365,700
According to our research of Virginia and other state lists, there were 16 registered sex offenders living in 22033 zip code as of April 27, 2024. The ratio of all residents to sex offenders in zip code 22033 is 2,506 to 1. The ratio of registered sex offenders to all residents in this zip code is much lower than the state average.
Median resident age:
This zip code:
37.7 years
Virginia median age:
39.0 years
Average household size:
This zip code:
2.4 people
Virginia:
2.5 people
Averages for the 2020 tax year for zip code 22033, filed in 2021:
Average Adjusted Gross Income (AGI) in 2020: $116,405 (Individual Income Tax Returns)
Here:
$116,405
State:
$86,446
Salary/wage: $99,788 (reported on 86.4% of returns)
Here:
$99,788
State:
$71,185
(% of AGI for various income ranges: 1170.0% for AGIs below $25k, 3874.2% for AGIs $25k-50k, 7228.3% for AGIs $50k-75k, 10573.4% for AGIs $75k-100k, 19984.4% for AGIs $100k-200k, 74977.3% for AGIs over 200k)
Taxable interest for individuals: $1,740 (reported on 42.1% of returns)
This zip code:
$1,740
Virginia:
$1,805
(% of AGI for various income ranges: 22.2% for AGIs below $25k, 25.8% for AGIs $25k-50k, 38.5% for AGIs $50k-75k, 67.6% for AGIs $75k-100k, 137.8% for AGIs $100k-200k, 791.8% for AGIs over 200k)
Ordinary dividends: $5,362 (reported on 31.9% of returns)
Here:
$5,362
State:
$8,327
(% of AGI for various income ranges: 29.5% for AGIs below $25k, 44.6% for AGIs $25k-50k, 74.6% for AGIs $50k-75k, 131.6% for AGIs $75k-100k, 287.6% for AGIs $100k-200k, 2112.1% for AGIs over 200k)
Net capital gain/loss in AGI: +$20,999 (reported on 30.5% of returns)
Here:
+$20,999
State:
+$24,644
(% of AGI for various income ranges: 20.5% for AGIs below $25k, 49.9% for AGIs $25k-50k, 103.2% for AGIs $50k-75k, 169.3% for AGIs $75k-100k, 466.4% for AGIs $100k-200k, 11020.1% for AGIs over 200k)
Profit/loss from business: +$16,550 (reported on 18.6% of returns)
Here:
+$16,550
State:
+$12,836
(% of AGI for various income ranges: 179.3% for AGIs below $25k, 238.7% for AGIs $25k-50k, 202.8% for AGIs $50k-75k, 264.1% for AGIs $75k-100k, 479.9% for AGIs $100k-200k, 2980.7% for AGIs over 200k)
Taxable individual retirement arrangement distribution: $25,345 (reported on 7.1% of returns)
22033:
$25,345
Virginia:
$21,535
(% of AGI for various income ranges: 41.0% for AGIs below $25k, 56.6% for AGIs $25k-50k, 127.5% for AGIs $50k-75k, 235.9% for AGIs $75k-100k, 372.2% for AGIs $100k-200k, 1719.6% for AGIs over 200k)
Self-employed (Keogh) retirement plans: $29,240 (reported on 1.3% of returns)
22033:
$29,240
Virginia:
$31,172
(% of AGI for various income ranges: 13.3% for AGIs $50k-75k, 47.0% for AGIs $100k-200k, 586.0% for AGIs over 200k)
Total itemized deductions: $30,466 (reported on 23.8% of returns)
Here:
$30,466
State:
$33,287
(% of AGI for various income ranges: 83.9% for AGIs below $25k, 224.1% for AGIs $25k-50k, 529.5% for AGIs $50k-75k, 911.6% for AGIs $75k-100k, 1893.1% for AGIs $100k-200k, 6099.7% for AGIs over 200k)
Charity contributions: $7,807 (reported on 18.7% of returns)
Here:
$7,807
State:
$10,381
(% of AGI for various income ranges: 4.2% for AGIs below $25k, 24.2% for AGIs $25k-50k, 53.6% for AGIs $50k-75k, 108.2% for AGIs $75k-100k, 296.8% for AGIs $100k-200k, 1780.2% for AGIs over 200k)
Taxes paid: $9,023 (reported on 23.7% of returns)
22033:
$9,023
State:
$8,284
(% of AGI for various income ranges: 17.3% for AGIs below $25k, 55.9% for AGIs $25k-50k, 161.3% for AGIs $50k-75k, 311.1% for AGIs $75k-100k, 635.9% for AGIs $100k-200k, 1549.2% for AGIs over 200k)
Earned income credit: $1,827 (reported on 6.8% of returns)
Here:
$1,827
State:
$2,214
(% of AGI for various income ranges: 51.3% for AGIs below $25k, 45.8% for AGIs $25k-50k)
Percentage of individuals using paid preparers for their 2020 taxes: 91.6%
Here:
92%
State:
92%
(% for various income ranges: 89.4% for AGIs below $25k, 91.4% for AGIs $25k-50k, 93.2% for AGIs $50k-75k, 91.6% for AGIs $75k-100k, 91.8% for AGIs $100k-200k, 92.8% for AGIs over 200k)
Averages for the 2012 tax year for zip code 22033, filed in 2013:
Average Adjusted Gross Income (AGI) in 2012: $97,222 (Individual Income Tax Returns)
Here:
$97,222
State:
$71,192
Salary/wage: $87,577 (reported on 89.5% of returns)
Here:
$87,577
State:
$59,229
(% of AGI for various income ranges: 82.3% for AGIs below $25k, 87.6% for AGIs $25k-50k, 86.0% for AGIs $50k-75k, 84.7% for AGIs $75k-100k, 86.0% for AGIs $100k-200k, 71.4% for AGIs over 200k)
Taxable interest for individuals: $1,033 (reported on 45.7% of returns)
This zip code:
$1,033
Virginia:
$1,600
(% of AGI for various income ranges: 1.0% for AGIs below $25k, 0.4% for AGIs $25k-50k, 0.5% for AGIs $50k-75k, 0.4% for AGIs $75k-100k, 0.4% for AGIs $100k-200k, 0.6% for AGIs over 200k)
Ordinary dividends: $3,993 (reported on 29.5% of returns)
Here:
$3,993
State:
$6,959
(% of AGI for various income ranges: 1.6% for AGIs below $25k, 0.7% for AGIs $25k-50k, 0.7% for AGIs $50k-75k, 0.9% for AGIs $75k-100k, 0.9% for AGIs $100k-200k, 1.8% for AGIs over 200k)
Net capital gain/loss in AGI: +$6,951 (reported on 24.1% of returns)
Here:
+$6,951
State:
+$16,672
(% of AGI for various income ranges: 0.2% for AGIs below $25k, 0.2% for AGIs $25k-50k, 0.3% for AGIs $50k-75k, 0.3% for AGIs $75k-100k, 0.6% for AGIs $100k-200k, 3.9% for AGIs over 200k)
Profit/loss from business: +$19,042 (reported on 16.0% of returns)
Here:
+$19,042
State:
+$14,116
(% of AGI for various income ranges: 11.6% for AGIs below $25k, 5.4% for AGIs $25k-50k, 2.2% for AGIs $50k-75k, 2.6% for AGIs $75k-100k, 2.6% for AGIs $100k-200k, 3.0% for AGIs over 200k)
Taxable individual retirement arrangement distribution: $18,793 (reported on 6.9% of returns)
22033:
$18,793
Virginia:
$16,667
(% of AGI for various income ranges: 1.6% for AGIs below $25k, 1.0% for AGIs $25k-50k, 1.4% for AGIs $50k-75k, 1.5% for AGIs $75k-100k, 1.4% for AGIs $100k-200k, 1.2% for AGIs over 200k)
Self-employment retirement plans: $19,785 (reported on 1.4% of returns)
22033:
$19,785
Virginia:
$25,373
(% of AGI for various income ranges: 0.3% for AGIs $50k-75k, 0.2% for AGIs $100k-200k, 0.5% for AGIs over 200k)
Total itemized deductions: $29,093 (19% of AGI, reported on 51.8% of returns)
Here:
$29,093
State:
$26,596
Here:
19.5% of AGI
State:
20.1% of AGI
(% of AGI for various income ranges: 14.6% for AGIs below $25k, 11.9% for AGIs $25k-50k, 13.8% for AGIs $50k-75k, 17.2% for AGIs $75k-100k, 17.6% for AGIs $100k-200k, 14.2% for AGIs over 200k)
Charity contributions: $3,664 (reported on 42.2% of returns)
Here:
$3,664
State:
$4,443
(% of AGI for various income ranges: 0.7% for AGIs below $25k, 1.0% for AGIs $25k-50k, 1.3% for AGIs $50k-75k, 1.6% for AGIs $75k-100k, 1.7% for AGIs $100k-200k, 1.7% for AGIs over 200k)
Taxes paid: $12,160 (reported on 51.7% of returns)
22033:
$12,160
State:
$9,951
(% of AGI for various income ranges: 2.6% for AGIs below $25k, 2.9% for AGIs $25k-50k, 4.3% for AGIs $50k-75k, 5.9% for AGIs $75k-100k, 7.3% for AGIs $100k-200k, 7.3% for AGIs over 200k)
Earned income credit: $1,836 (reported on 6.8% of returns)
Here:
$1,836
State:
$2,211
(% of AGI for various income ranges: 3.5% for AGIs below $25k, 0.6% for AGIs $25k-50k)
Percentage of individuals using paid preparers for their 2012 taxes: 42.2%
Here:
42%
State:
46%
(% for various income ranges: 42.6% for AGIs below $25k, 41.9% for AGIs $25k-50k, 39.0% for AGIs $50k-75k, 41.7% for AGIs $75k-100k, 40.7% for AGIs $100k-200k, 50.8% for AGIs over 200k)
Averages for the 2004 tax year for zip code 22033, filed in 2005:
Average Adjusted Gross Income (AGI) in 2004: $78,292 (Individual Income Tax Returns)
Here:
$78,292
State:
$56,704
Salary/wage: $71,104 (reported on 91.2% of returns)
Here:
$71,104
State:
$48,441
(% of AGI for various income ranges: 111.8% for AGIs below $10k, 83.3% for AGIs $10k-25k, 89.1% for AGIs $25k-50k, 88.1% for AGIs $50k-75k, 87.9% for AGIs $75k-100k, 79.0% for AGIs over 100k)
Taxable interest for individuals: $1,164 (reported on 56.7% of returns)
This zip code:
$1,164
Virginia:
$1,688
(% of AGI for various income ranges: 3.0% for AGIs below $10k, 1.5% for AGIs $10k-25k, 0.7% for AGIs $25k-50k, 0.7% for AGIs $50k-75k, 0.6% for AGIs $75k-100k, 0.9% for AGIs over 100k)
Taxable dividends: $2,059 (reported on 33.4% of returns)
Here:
$2,059
State:
$4,028
(% of AGI for various income ranges: 4.5% for AGIs below $10k, 1.2% for AGIs $10k-25k, 0.7% for AGIs $25k-50k, 0.8% for AGIs $50k-75k, 0.8% for AGIs $75k-100k, 0.9% for AGIs over 100k)
Net capital gain/loss: +$12,048 (reported on 28.8% of returns)
Here:
+$12,048
State:
+$14,375
(% of AGI for various income ranges: -2.3% for AGIs below $10k, -0.1% for AGIs $10k-25k, 0.4% for AGIs $25k-50k, 0.3% for AGIs $50k-75k, 0.4% for AGIs $75k-100k, 7.3% for AGIs over 100k)
Profit/loss from business: +$17,067 (reported on 14.7% of returns)
Here:
+$17,067
State:
+$13,342
(% of AGI for various income ranges: 9.8% for AGIs below $10k, 9.0% for AGIs $10k-25k, 3.4% for AGIs $25k-50k, 2.5% for AGIs $50k-75k, 2.9% for AGIs $75k-100k, 3.1% for AGIs over 100k)
IRA payment deduction: $3,004 (reported on 3.2% of returns)
22033:
$3,004
Virginia:
$2,943
(% of AGI for various income ranges: 0.3% for AGIs $10k-25k, 0.3% for AGIs $25k-50k, 0.1% for AGIs $50k-75k, 0.2% for AGIs $75k-100k, 0.1% for AGIs over 100k)
Self-employed pension: $15,907 (reported on 1.6% of returns)
Here:
$15,907
Virginia:
$17,430
(% of AGI for various income ranges: 0.1% for AGIs $25k-50k, 0.1% for AGIs $50k-75k, 0.2% for AGIs $75k-100k, 0.5% for AGIs over 100k)
Total itemized deductions: $24,426 (21% of AGI, reported on 55.4% of returns)
Here:
$24,426
State:
$21,492
Here:
21.2% of AGI
State:
21.0% of AGI
(% of AGI for various income ranges: 17.7% for AGIs below $10k, 15.0% for AGIs $10k-25k, 14.8% for AGIs $25k-50k, 18.4% for AGIs $50k-75k, 19.9% for AGIs $75k-100k, 16.9% for AGIs over 100k)
Charity contributions deductions: $3,739 (3% of AGI, reported on 47.8% of returns)
Here:
$3,739
State:
$3,794
Here:
3.1% of AGI
State:
3.5% of AGI
(% of AGI for various income ranges: 0.5% for AGIs below $10k, 0.9% for AGIs $10k-25k, 1.4% for AGIs $25k-50k, 1.7% for AGIs $50k-75k, 2.0% for AGIs $75k-100k, 2.7% for AGIs over 100k)
Total tax: $13,014 (reported on 87.9% of returns)
22033:
$13,014
State:
$9,537
(% of AGI for various income ranges: 3.5% for AGIs below $10k, 5.5% for AGIs $10k-25k, 8.8% for AGIs $25k-50k, 11.2% for AGIs $50k-75k, 11.8% for AGIs $75k-100k, 17.6% for AGIs over 100k)
Earned income credit: $1,547 (reported on 4.6% of returns)
Here:
$1,547
State:
$1,734
Percentage of individuals using paid preparers for their 2004 taxes: 42.4%
Here:
42%
State:
52%
(% for various income ranges: 37.8% for AGIs below $10k, 46.7% for AGIs $10k-25k, 42.0% for AGIs $25k-50k, 42.1% for AGIs $50k-75k, 42.0% for AGIs $75k-100k, 43.2% for AGIs over 100k)
Likely homosexual households (counted as self-reported same-sex unmarried-partner households)
Lesbian couples: 0.1% of all households
Gay men: 0.1% of all households
Household received Food Stamps/SNAP in the past 12 months: 329 Household did not receive Food Stamps/SNAP in the past 12 months: 15,437
Women who had a birth in the past 12 months: 257 (234 now married, 27 unmarried) Women who did not have a birth in the past 12 months: 10,246 (5,069 now married, 5,149 unmarried)
Housing units in zip code 22033 with a mortgage: 7,539 (921 second mortgage, 775 both second mortgage and home equity loan) Houses without a mortgage: 298
Median monthly owner costs for units with a mortgage: $2,742 Median monthly owner costs for units without a mortgage: $902
Residents with income below the poverty level in 2022:
This zip code:
5.8%
Whole state:
10.6%
Residents with income below 50% of the poverty level in 2022:
This zip code:
3.5%
Whole state:
5.2%
Median number of rooms in houses and condos:
Here:
7.0
State:
7.0
Median number of rooms in apartments:
Here:
3.5
State:
4.3
Notable locations in this zip code not listed on our city pages
Notable locations in zip code 22033: International Country Club (A), Penderbrook Golf Course (B), Fairfax County Fire and Rescue Department Station 21 Fair Oaks (C), Fairfax Company Number 8 Police Station (D), Virginia Department of Highways (E). Display/hide their locations on the map
Shopping Centers: Greenbriar Shopping Center (1), Fair Oaks Mall Shopping Center (2), Fair Lakes Shopping Center (3). Display/hide their locations on the map
Churches in zip code 22033 include: Centerpointe Church at Fair Oaks (A), Fair Oaks Community Church (B), Saint Paul Chung Catholic Church (C), Temple of God Church (D), Fairfax Church of Christ (E), King of Kings Lutheran Church (F), Christ Presbyterian Church (G), Fairfax Assembly of God Church (H), Pender Church (I). Display/hide their locations on the map
6,409 married couples with children.
1,108 single-parent households (238 men, 870 women).
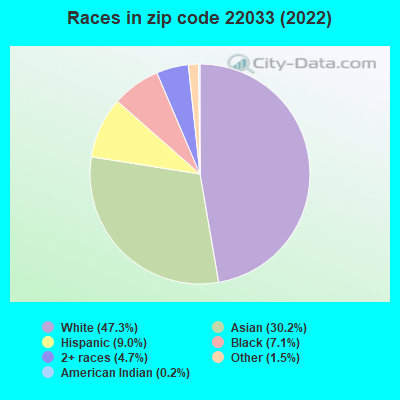
60.6% of residents of 22033 zip code speak English at home.
7.0% of residents speak Spanish at home (76% very well, 18% well, 3% not well, 3% not at all).
10.7% of residents speak other Indo-European language at home (61% very well, 26% well, 12% not well, 1% not at all).
18.8% of residents speak Asian or Pacific Island language at home (66% very well, 21% well, 12% not well, 2% not at all).
3.5% of residents speak other language at home (66% very well, 23% well, 10% not well, 1% not at all).
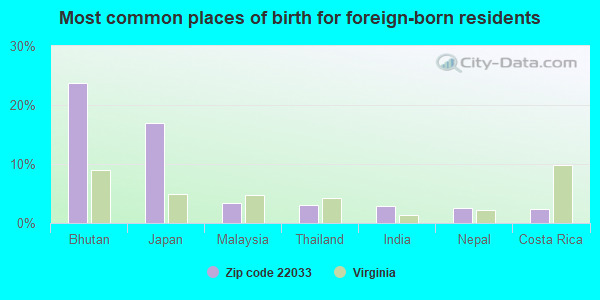
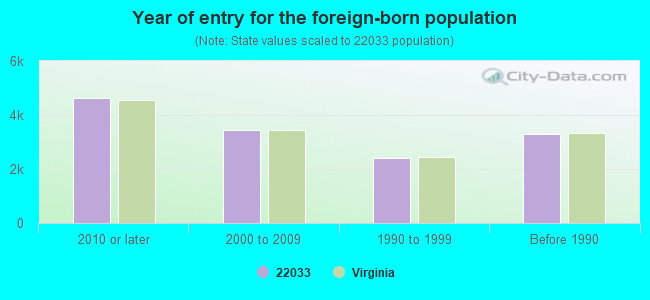
Foreign born population: 12,665 (32.6%) (65.5% of them are naturalized citizens)
Facilities with environmental interests located in this zip code:
DULLES DISCOVERY - PHASE 1 (13900 AIR AND SPACE MUSEUM PAR in CHANTILLY, VA)
AIR SYNTHETIC MINOR (AIRS/AFS) Business SIC classification: EXECUTIVE OFFICES
Housing units lacking complete plumbing facilities: 0.2% Housing units lacking complete kitchen facilities: 1.0%
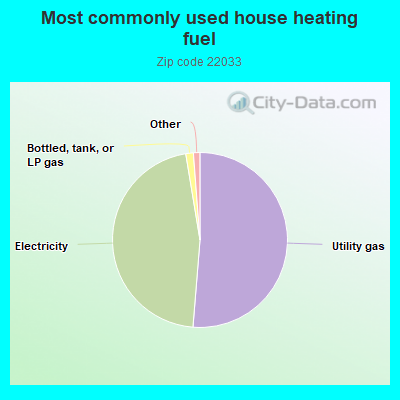
51.3%Utility gas
46.1%Electricity
1.4%Bottled, tank, or LP gas
Population in 1990: 20,873. Population change in the 1990s: +12,170 (+58.3%).
Place of birth for U.S.-born residents:
This state: 11,141
Northeast: 4,547
Midwest: 2,411
South: 5,553
West: 1,610
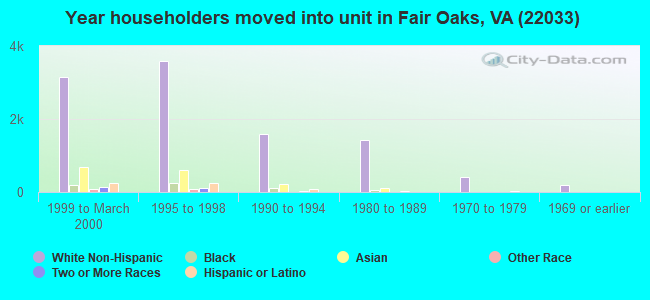
41% of the 22033 zip code residents lived in the same house 5 years ago. Out of people who lived in different houses, 39% lived in this county. Out of people who lived in different counties, 50% lived in Virginia.
84% of the 22033 zip code residents lived in the same house 1 year ago. Out of people who lived in different houses, 45% moved from this county. Out of people who lived in different houses, 23% moved from different county within same state. Out of people who lived in different houses, 19% moved from different state. Out of people who lived in different houses, 10% moved from abroad.
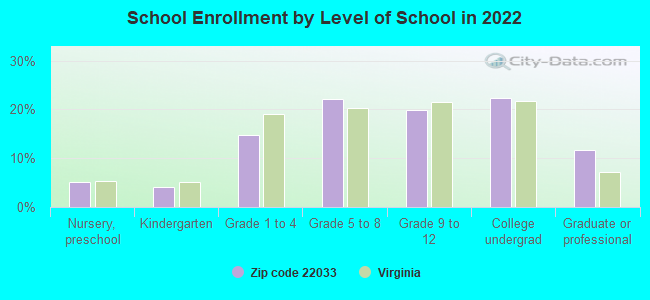
Private vs. public school enrollment:
Students in private schools in grades 1 to 8 (elementary and middle school): 334
Here:
8.8%
Virginia:
13.2%
Students in private schools in grades 9 to 12 (high school): 223
Here:
10.9%
Virginia:
10.2%
Students in private undergraduate colleges: 431
Here:
18.7%
Virginia:
18.7%
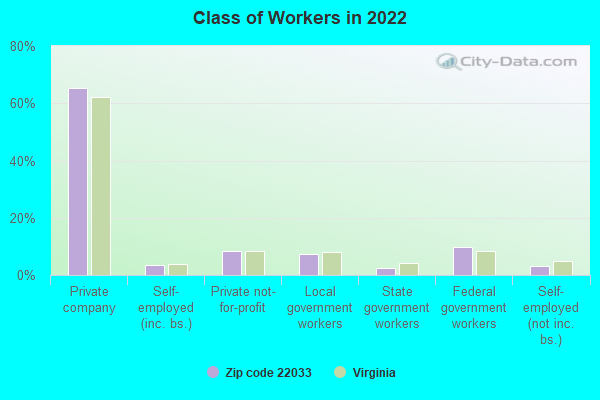
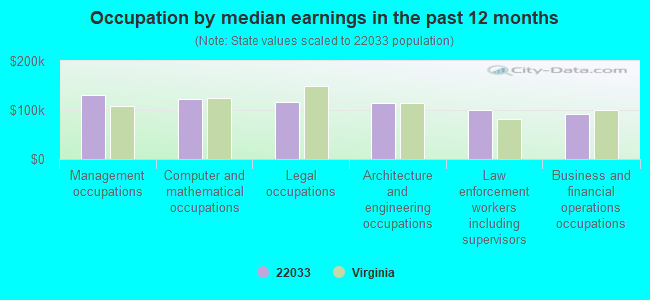
Occupation by median earnings in the past 12 months ($)
130,691Management occupations
123,129Computer and mathematical occupations
115,425Legal occupations
114,476Architecture and engineering occupations
100,302Law enforcement workers including supervisors
92,307Business and financial operations occupations
Companies with biggest federal contracts located in this zip code (FAIRFAX, VA):
TRW INC (1 FEDERAL SYSTEMS PARK DR) : $872,954,377 in 1411 contractsfrom 1999 to 2006
Contracts for Other Transportation Travel and Relocation Services, Services -- Basic Research (R&D), Engineering and Technical Services, Automated Information System Design and Integration Services, and moreby Army, Navy, Centers for Disease Control and Prevention, ENERGY, Department of, and others Signed by year:2000: $55,547,141; 2001: $77,257,456; 2002: $192,730,213; 2003: $208,129,560; 2004: $193,955,489; 2005: $71,447,435; 2006: $31,758,750.
Biggest contracts:
$43,745,533 with Army for Other Transportation Travel and Relocation Services. Signed on 2002-02-27. Completion date: 2002-09-30.
$35,901,896 with Army for Services -- Basic Research (R&D). Signed on 1999-10-29. Completion date: 2001-07-14.
$17,477,724 with Army for Other Transportation Travel and Relocation Services. Signed on 2002-12-30. Completion date: 2003-10-31.
$14,826,500, same as above.Signed on 2001-09-28. Completion date: 2001-09-28.
DIGITAL SYSTEM RESOURCES, INC (12450 FAIR LAKES CIRCLE, S; small business) : $723,656,621 in 652 contractsfrom 1999 to 2006
Contracts for Fire Control Systems, Complete, Defense Electronics and Communication Equipment -- Operational Systems Development (R&D), Underwater Sound Equipment, Defense Electronics and Communication Equipment -- Engineering Development (R&D), and moreby Navy, Federal Technology Service, Air Force, Army, and others Signed by year:2000: $87,978,571; 2001: $48,235,558; 2002: $114,461,747; 2003: $110,826,463; 2004: $104,466,857; 2005: $149,385,715; 2006: $75,279,934.
Biggest contracts:
$27,840,613 with Navy for Fire Control Systems, Complete. Signed on 2005-03-11. Completion date: 2009-09-30.
$27,467,361 with Navy for Defense Electronics and Communication Equipment -- Operational Systems Development (R&D). Signed on 2003-12-22. Completion date: 2005-08-10.
$20,600,000 with Navy for Underwater Sound Equipment. Signed on 2000-02-29. Completion date: 2000-12-31.
$18,144,942 with Navy for Defense Electronics and Communication Equipment -- Engineering Development (R&D). Signed on 1999-12-29. Completion date: 2001-08-24.
MANTECH SYSTEMS ENGINEERING CO (12015 LEE JACKSON HIGHWAY) : $523,150,094 in 1676 contractsfrom 1999 to 2006
Contracts for Inspection Services (including commercial testing and lab services, except medical/dental) -- Miscellaneous, Program Management/Support Services, Other Management Support Services, ADPE System Configuration, and moreby NASA, Defense Intelligence Agency, Department of Defense, Army, and others Signed by year:2000: $39,774,767; 2001: $47,098,634; 2002: $71,575,829; 2003: $116,924,792; 2004: $87,706,356; 2005: $98,307,278; 2006: $54,437,092.
Biggest contracts:
$29,903,266 with NASA for Inspection Services (including commercial testing and lab services, except medical/dental) -- Miscellaneous. Taking place in MD. Signed on 2004-09-23. Completion date: 2007-04-30.
$26,387,433, same as above.Signed on 2003-10-01. Completion date: 2004-02-19.
$10,159,204 with Defense Intelligence Agency for Program Management/Support Services. Taking place in DC. Signed on 2006-03-03. Completion date: 2006-04-04.
$8,802,110 with Department of Defense for Program Management/Support Services. Taking place in DC. Signed on 2005-04-04. Completion date: 2006-04-04.
TRW INC (12900 FEDERAL SYSTEMS PARK) : $335,712,132 in 126 contractsfrom 1999 to 2004
Contracts for Other Professional Services, Automated Information System Design and Integration Services, Space Operations (Tracking and Data Acquisition) -- Operational Systems Development (R&D), ADP Facility Operation and Maintenance Services, and moreby Bureau of the Census, Internal Revenue Service, NASA, Army, and others Signed by year:2000: $33,618,468; 2001: $34,628,252; 2002: $863,078; 2003: $0; 2004: -$12,666; 2005: $0; 2006: $0.
Biggest contracts:
$208,516,000 with Bureau of the Census for Other Professional Services. Signed on 1999-12-15. Completion date: 2001-03-15.
$17,500,000, same as above.Signed on 1999-11-15. Completion date: 2001-03-15.
$16,500,000 with Internal Revenue Service for Automated Information System Design and Integration Services. Signed on 2001-04-15. Completion date: 2001-09-15.
$16,000,000 with Bureau of the Census for Other Professional Services. Signed on 1999-10-15. Completion date: 2001-03-15.
AMERICAN MANAGEMENT SYSTEMS, I (4114 LEGATO ROAD) : $288,721,870 in 836 contractsfrom 2000 to 2006
Contracts for Defense Ships -- Management and Support (R&D), Programming Services, ADP Software, Equipment, and Telecommunications Training, ADP Software, and moreby Navy, Defense Logistics Agency, Department of Defense, Army, and others Signed by year:2000: $2,963,899; 2001: $42,821,795; 2002: $65,802,361; 2003: $55,918,430; 2004: $57,961,810; 2005: $57,036,025; 2006: $6,217,550.
Biggest contracts:
$26,814,064 with Navy for Defense Ships -- Management and Support (R&D). Signed on 2001-06-08. Completion date: 2006-06-30.
$9,380,000, same as above.Signed on 2003-09-08. Completion date: 2006-06-30.
$9,208,300, same as above.Signed on 2005-09-29. Completion date: 2006-06-30.
$8,900,000, same as above.Signed on 2004-12-22. Completion date: 2006-06-30.
IDENTIX PUBLIC SECTOR, INC (3975 FAIR RIDGE DRIVE) : $148,076,546 in 587 contractsfrom 1999 to 2006
Contracts for Engineering and Technical Services, ADPE System Configuration, Program Management/Support Services, ADP Systems Analysis Services, and moreby Federal Technology Service, Navy, Offices, Boards and Divisions (includes Attorney General, Deputy Attorney General, etc.), Internal Revenue Service, and others Signed by year:2000: $55,606,501; 2001: $30,717,970; 2002: $24,625,131; 2003: $27,472,046; 2004: $1,684,454; 2005: $1,383,147; 2006: $217,990.
Biggest contracts:
$8,333,826 with Federal Technology Service for Engineering and Technical Services. Signed on 2003-11-05. Completion date: 2005-09-30.
$7,000,000 with Navy for ADPE System Configuration. Taking place in DC. Signed on 2001-11-19. Completion date: 2002-09-30.
$4,932,133 with Navy for Program Management/Support Services. Signed on 2000-09-28. Completion date: 2001-09-30.
$3,480,493 with Navy for ADPE System Configuration. Signed on 2000-06-19. Completion date: 2000-09-30.
SYSTEMS 2000 INC (3998 FAIR RIDGE DR; small business) : $131,323,188 in 96 contractsfrom 1999 to 2006
Contracts for Food Items For Resale, Non-Food Items For Resale by Defense Commissary Agency, Department of Defense Signed by year:2000: $4,827,549; 2001: $4,193,216; 2002: $5,432,738; 2003: $2,455,861; 2004: $26,360,323; 2005: $64,417,588; 2006: $21,273,316.
Biggest contracts:
$10,485,908 with Defense Commissary Agency for Food Items For Resale. Signed on 2004-10-01. Completion date: 2005-02-28.
$9,571,849, same as above.Signed on 2005-04-01. Completion date: 2005-08-31.
$5,995,363 with Defense Commissary Agency for Non-Food Items For Resale. Signed on 2006-01-01. Completion date: 2006-03-31.
$5,955,792, same as above.Signed on 2005-10-01. Completion date: 2005-12-31.
MANDEX, INC (12500 FAIR LAKES CIRCLE; small business) : $121,931,396 in 937 contractsfrom 1999 to 2006
Contracts for Marine Architect and Engineering Services, Other Architect and Engineering Services, Maintenance, Repair and Rebuilding of Equipment -- Communication, Detection, and Coherent Radiation Equipment, Other Defense -- Applied Research and Exploratory Development (R&D), and moreby Navy, Nuclear Regulatory Commission, Federal Technology Service, Air Force, and others Signed by year:2000: $5,805,260; 2001: $28,943,595; 2002: $13,039,526; 2003: $25,731,577; 2004: $29,047,098; 2005: $14,917,757; 2006: $3,984,101.
Biggest contracts:
$19,096,705 with Navy for Marine Architect and Engineering Services. Taking place in SC. Signed on 2001-07-01. Completion date: 2002-06-30.
$4,607,626 with Navy for Other Architect and Engineering Services. Signed on 2003-04-10. Completion date: 2003-09-23.
$3,948,054 with Navy for Marine Architect and Engineering Services. Taking place in SC. Signed on 2001-01-23. Completion date: 2002-01-22.
$3,625,000 with Navy for Maintenance, Repair and Rebuilding of Equipment -- Communication, Detection, and Coherent Radiation Equipment. Taking place in SC. Signed on 2003-10-27. Completion date: 2004-02-28.
BDM INTERNATIONAL INC (12150 MONUMENT DR, SUITE 8) : $106,399,585 in 179 contractsfrom 1999 to 2006
Contracts for Other Transportation Travel and Relocation Services, ADP Systems Development Services, ADP Facility Operation and Maintenance Services, Engineering and Technical Services, and moreby Army, Securities and Exchange Commission, Air Force, Department of Defense, and others Signed by year:2000: $8,102,961; 2001: -$324,993; 2002: $0; 2003: -$98,643; 2004: $10,036,340; 2005: $53,733,716; 2006: $21,811,727.
Biggest contracts:
$7,652,854 with Army for Other Transportation Travel and Relocation Services. Signed on 2005-12-12. Completion date: 2006-09-29.
$6,147,935, same as above.Signed on 2005-02-11. Completion date: 2005-07-31.
$5,741,000 with Securities and Exchange Commission for ADP Systems Development Services. Taking place in DC. Signed on 1999-12-15. Completion date: 2001-06-15.
$5,234,509 with Army for ADP Facility Operation and Maintenance Services. Signed on 2006-06-30. Completion date: 2006-09-29.
COLONIAL ENERGY INC (VA) (3975 FAIR RIDGE DR T10N) : $106,376,179 in 21 contractsfrom 2000 to 2005
Contracts for Gases: Compressed and Liquefied by Defense Logistics Agency Signed by year:2000: $8,893,049; 2001: $5,456,023; 2002: $52,231,181; 2003: $0; 2004: $0; 2005: $39,795,926; 2006: $0.
Biggest contracts:
$39,389,204 with Defense Logistics Agency for Gases: Compressed and Liquefied. Signed on 2005-06-28. Completion date: 2008-09-30.
$26,425,692, same as above.Signed on 2002-06-28. Completion date: 2005-09-30.
$10,669,918, same as above.Signed on 2002-05-31. Completion date: 2005-09-30.
$9,651,628, same as above.Signed on 2002-08-15. Completion date: 2005-09-30.
Top industries in this zip code by the number of employees in 2005:
Management of Companies and Enterprises: Corporate, Subsidiary, and Regional Managing Offices (500-999: 1, 250-499: 1, 100-249: 1, 20-49: 1, 5-9: 4, 1-4: 1)
Professional, Scientific, and Technical Services: Administrative Management and General Management Consulting Services (500-999: 1, 100-249: 2, 20-49: 1, 10-19: 2, 5-9: 2, 1-4: 16)
Health Care and Social Assistance: Offices of Physicians (except Mental Health Specialists) (100-249: 1, 50-99: 1, 20-49: 7, 10-19: 19, 5-9: 15, 1-4: 28)
Administrative and Support and Waste Management and Remediation Services: Investigation Services (500-999: 1)
People in group quarters in 2010:
11 people in group homes intended for adults
People in group quarters in 2000:
164 people in nursing homes
Fatal accident statistics in 2014:
Fatal accident count: 2
Vehicles involved in fatal accidents: 2
Fatal accidents caused by drunken drivers: 0
Fatalities: 2
Persons involved in fatal accidents: 2
Pedestrians involved in fatal accidents: 1
Fatal accident statistics in 2013:
Fatal accident count: 1
Vehicles involved in fatal accidents: 1
Fatal accidents caused by drunken drivers: 0
Fatalities: 1
Persons involved in fatal accidents: 1
Pedestrians involved in fatal accidents: 1
Home Mortgage Disclosure Act Aggregated Statistics For Year 2009 (Based on 2 full and 6 partial tracts)
A) FHA, FSA/RHS & VA Home Purchase Loans
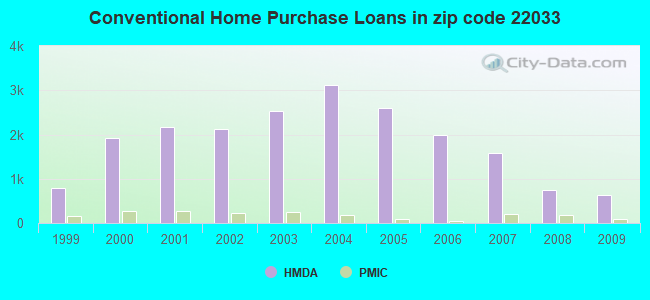
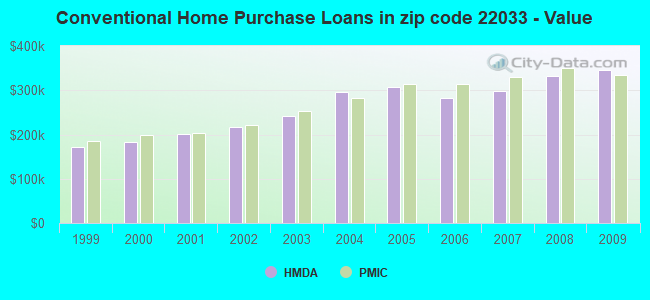
B) Conventional Home Purchase Loans
C) Refinancings
D) Home Improvement Loans
E) Loans on Dwellings For 5+ Families
F) Non-occupant Loans on < 5 Family Dwellings (A B C & D)
G) Loans On Manufactured Home Dwelling (A B C & D)
Number
Average Value
Number
Average Value
Number
Average Value
Number
Average Value
Number
Average Value
Number
Average Value
Number
Average Value
LOANS ORIGINATED
432
$353,150
643
$346,376
2,549
$318,101
64
$160,476
1
$60,820,450
122
$235,951
0
$0
APPLICATIONS APPROVED, NOT ACCEPTED
16
$397,320
34
$310,355
194
$297,748
7
$54,273
0
$0
11
$234,000
0
$0
APPLICATIONS DENIED
33
$346,463
57
$318,367
504
$316,093
24
$103,063
0
$0
33
$269,576
0
$0
APPLICATIONS WITHDRAWN
49
$349,511
104
$346,339
539
$343,318
12
$84,530
0
$0
25
$267,972
1
$102,590
FILES CLOSED FOR INCOMPLETENESS
6
$420,295
14
$335,531
101
$332,981
0
$0
0
$0
4
$225,808
0
$0
Aggregated Statistics For Year 2008 (Based on 2 full and 6 partial tracts)
A) FHA, FSA/RHS & VA Home Purchase Loans
B) Conventional Home Purchase Loans
C) Refinancings
D) Home Improvement Loans
E) Loans on Dwellings For 5+ Families
F) Non-occupant Loans on < 5 Family Dwellings (A B C & D)
Number
Average Value
Number
Average Value
Number
Average Value
Number
Average Value
Number
Average Value
Number
Average Value
LOANS ORIGINATED
229
$338,716
757
$333,055
922
$301,748
90
$113,372
2
$6,030,170
91
$237,776
APPLICATIONS APPROVED, NOT ACCEPTED
13
$319,850
90
$309,055
183
$295,479
18
$65,082
0
$0
12
$256,829
APPLICATIONS DENIED
30
$283,707
102
$365,940
360
$333,596
61
$83,421
0
$0
20
$222,315
APPLICATIONS WITHDRAWN
34
$381,111
129
$312,262
284
$345,369
19
$203,230
0
$0
14
$265,016
FILES CLOSED FOR INCOMPLETENESS
5
$395,896
22
$327,356
41
$362,384
2
$99,920
0
$0
5
$271,550
Aggregated Statistics For Year 2007 (Based on 2 full and 6 partial tracts)
A) FHA, FSA/RHS & VA Home Purchase Loans
B) Conventional Home Purchase Loans
C) Refinancings
D) Home Improvement Loans
E) Loans on Dwellings For 5+ Families
F) Non-occupant Loans on < 5 Family Dwellings (A B C & D)
G) Loans On Manufactured Home Dwelling (A B C & D)
Number
Average Value
Number
Average Value
Number
Average Value
Number
Average Value
Number
Average Value
Number
Average Value
Number
Average Value
LOANS ORIGINATED
17
$271,913
1,583
$297,609
1,049
$309,343
153
$120,909
0
$0
108
$279,853
0
$0
APPLICATIONS APPROVED, NOT ACCEPTED
0
$0
135
$287,695
217
$299,975
42
$103,316
2
$365,705
17
$274,194
2
$5,000
APPLICATIONS DENIED
5
$221,936
167
$269,449
532
$339,160
81
$126,835
4
$36,091,105
34
$226,406
2
$74,940
APPLICATIONS WITHDRAWN
2
$350,090
167
$278,997
270
$357,233
24
$111,730
0
$0
13
$306,461
0
$0
FILES CLOSED FOR INCOMPLETENESS
0
$0
27
$311,175
113
$389,103
6
$139,663
0
$0
7
$403,551
0
$0
Aggregated Statistics For Year 2006 (Based on 2 full and 6 partial tracts)
A) FHA, FSA/RHS & VA Home Purchase Loans
B) Conventional Home Purchase Loans
C) Refinancings
D) Home Improvement Loans
E) Loans on Dwellings For 5+ Families
F) Non-occupant Loans on < 5 Family Dwellings (A B C & D)
G) Loans On Manufactured Home Dwelling (A B C & D)
Number
Average Value
Number
Average Value
Number
Average Value
Number
Average Value
Number
Average Value
Number
Average Value
Number
Average Value
LOANS ORIGINATED
11
$218,839
1,991
$281,550
1,479
$304,198
216
$146,063
0
$0
161
$244,470
2
$55,955
APPLICATIONS APPROVED, NOT ACCEPTED
0
$0
138
$277,453
266
$278,290
51
$154,816
0
$0
12
$268,308
0
$0
APPLICATIONS DENIED
0
$0
216
$312,798
511
$347,312
71
$180,861
0
$0
42
$278,329
1
$81,780
APPLICATIONS WITHDRAWN
0
$0
141
$280,738
441
$337,754
34
$264,745
1
$369,510
42
$279,890
0
$0
FILES CLOSED FOR INCOMPLETENESS
0
$0
27
$260,921
79
$336,522
12
$150,820
0
$0
1
$419,680
0
$0
Aggregated Statistics For Year 2005 (Based on 2 full and 6 partial tracts)
A) FHA, FSA/RHS & VA Home Purchase Loans
B) Conventional Home Purchase Loans
C) Refinancings
D) Home Improvement Loans
E) Loans on Dwellings For 5+ Families
F) Non-occupant Loans on < 5 Family Dwellings (A B C & D)
G) Loans On Manufactured Home Dwelling (A B C & D)
Number
Average Value
Number
Average Value
Number
Average Value
Number
Average Value
Number
Average Value
Number
Average Value
Number
Average Value
LOANS ORIGINATED
7
$168,364
2,593
$308,421
2,445
$304,649
253
$176,464
1
$58,812,600
294
$263,907
1
$39,460
APPLICATIONS APPROVED, NOT ACCEPTED
1
$131,670
178
$277,180
249
$292,698
33
$76,655
0
$0
16
$250,034
2
$68,945
APPLICATIONS DENIED
1
$203,650
267
$283,969
435
$299,304
84
$78,468
0
$0
44
$264,644
1
$45,200
APPLICATIONS WITHDRAWN
0
$0
194
$314,578
386
$307,784
53
$147,761
0
$0
24
$192,855
1
$156,330
FILES CLOSED FOR INCOMPLETENESS
0
$0
50
$273,445
90
$336,568
12
$118,433
0
$0
4
$248,062
0
$0
Aggregated Statistics For Year 2004 (Based on 2 full and 6 partial tracts)
A) FHA, FSA/RHS & VA Home Purchase Loans
B) Conventional Home Purchase Loans
C) Refinancings
D) Home Improvement Loans
E) Loans on Dwellings For 5+ Families
F) Non-occupant Loans on < 5 Family Dwellings (A B C & D)
G) Loans On Manufactured Home Dwelling (A B C & D)
Number
Average Value
Number
Average Value
Number
Average Value
Number
Average Value
Number
Average Value
Number
Average Value
Number
Average Value
LOANS ORIGINATED
38
$239,985
3,118
$295,118
2,836
$263,076
193
$122,544
0
$0
289
$232,721
0
$0
APPLICATIONS APPROVED, NOT ACCEPTED
1
$176,440
255
$270,761
249
$234,274
29
$120,624
4
$97,380
19
$200,072
1
$14,040
APPLICATIONS DENIED
1
$246,790
257
$288,395
464
$260,190
88
$89,640
0
$0
30
$186,028
5
$51,302
APPLICATIONS WITHDRAWN
1
$269,740
253
$284,631
458
$244,307
59
$102,645
1
$25,110
42
$228,020
0
$0
FILES CLOSED FOR INCOMPLETENESS
2
$220,600
54
$282,513
95
$281,274
14
$53,674
0
$0
3
$144,200
0
$0
Aggregated Statistics For Year 2003 (Based on 2 full and 6 partial tracts)
A) FHA, FSA/RHS & VA Home Purchase Loans
B) Conventional Home Purchase Loans
C) Refinancings
D) Home Improvement Loans
E) Loans on Dwellings For 5+ Families
F) Non-occupant Loans on < 5 Family Dwellings (A B C & D)
Number
Average Value
Number
Average Value
Number
Average Value
Number
Average Value
Number
Average Value
Number
Average Value
LOANS ORIGINATED
127
$206,204
2,535
$240,886
7,386
$226,288
96
$50,128
2
$41,167,040
323
$158,858
APPLICATIONS APPROVED, NOT ACCEPTED
7
$224,639
165
$251,490
712
$230,056
45
$34,394
0
$0
21
$179,945
APPLICATIONS DENIED
1
$195,130
156
$238,858
607
$236,429
53
$61,084
0
$0
31
$193,763
APPLICATIONS WITHDRAWN
2
$256,070
167
$259,800
604
$228,529
32
$83,892
0
$0
30
$138,041
FILES CLOSED FOR INCOMPLETENESS
4
$148,325
35
$308,132
174
$259,059
4
$37,785
0
$0
8
$182,718
Aggregated Statistics For Year 2002 (Based on 2 full and 6 partial tracts)
A) FHA, FSA/RHS & VA Home Purchase Loans
B) Conventional Home Purchase Loans
C) Refinancings
D) Home Improvement Loans
E) Loans on Dwellings For 5+ Families
F) Non-occupant Loans on < 5 Family Dwellings (A B C & D)
Number
Average Value
Number
Average Value
Number
Average Value
Number
Average Value
Number
Average Value
Number
Average Value
LOANS ORIGINATED
189
$175,943
2,132
$217,859
4,933
$218,148
100
$45,939
2
$99,920
212
$162,855
APPLICATIONS APPROVED, NOT ACCEPTED
5
$149,462
131
$234,913
405
$208,707
41
$49,382
0
$0
12
$182,997
APPLICATIONS DENIED
2
$186,440
109
$204,383
470
$188,998
61
$52,098
1
$341,090
14
$133,063
APPLICATIONS WITHDRAWN
10
$144,678
153
$251,425
476
$199,111
31
$36,715
0
$0
19
$144,962
FILES CLOSED FOR INCOMPLETENESS
0
$0
22
$194,859
136
$212,589
2
$171,475
0
$0
11
$178,980
Aggregated Statistics For Year 2001 (Based on 2 full and 6 partial tracts)
A) FHA, FSA/RHS & VA Home Purchase Loans
B) Conventional Home Purchase Loans
C) Refinancings
D) Home Improvement Loans
E) Loans on Dwellings For 5+ Families
F) Non-occupant Loans on < 5 Family Dwellings (A B C & D)
Number
Average Value
Number
Average Value
Number
Average Value
Number
Average Value
Number
Average Value
Number
Average Value
LOANS ORIGINATED
339
$157,359
2,161
$201,681
3,324
$197,854
159
$41,019
1
$149,940
140
$144,135
APPLICATIONS APPROVED, NOT ACCEPTED
6
$115,603
139
$209,172
261
$156,724
54
$42,153
0
$0
9
$121,033
APPLICATIONS DENIED
30
$144,245
106
$190,349
383
$156,062
69
$31,396
0
$0
5
$174,296
APPLICATIONS WITHDRAWN
14
$152,967
193
$227,003
391
$163,718
53
$27,569
0
$0
21
$150,232
FILES CLOSED FOR INCOMPLETENESS
1
$145,710
25
$184,851
98
$156,474
9
$34,093
0
$0
6
$200,127
Aggregated Statistics For Year 2000 (Based on 2 full and 6 partial tracts)
A) FHA, FSA/RHS & VA Home Purchase Loans
B) Conventional Home Purchase Loans
C) Refinancings
D) Home Improvement Loans
F) Non-occupant Loans on < 5 Family Dwellings (A B C & D)
Number
Average Value
Number
Average Value
Number
Average Value
Number
Average Value
Number
Average Value
LOANS ORIGINATED
407
$144,148
1,911
$183,679
474
$150,963
191
$36,640
61
$133,859
APPLICATIONS APPROVED, NOT ACCEPTED
13
$152,748
170
$146,182
86
$101,002
55
$43,449
3
$56,843
APPLICATIONS DENIED
12
$130,861
142
$142,597
207
$103,684
75
$38,890
16
$55,495
APPLICATIONS WITHDRAWN
20
$136,947
176
$204,766
157
$113,828
27
$60,967
7
$150,403
FILES CLOSED FOR INCOMPLETENESS
2
$163,075
23
$234,876
27
$117,696
6
$77,763
0
$0
Aggregated Statistics For Year 1999 (Based on 1 full and 3 partial tracts)
A) FHA, FSA/RHS & VA Home Purchase Loans
B) Conventional Home Purchase Loans
C) Refinancings
D) Home Improvement Loans
F) Non-occupant Loans on < 5 Family Dwellings (A B C & D)
2004 - 2018 National Fire Incident Reporting System (NFIRS) incidents
According to the data from the years 2004 - 2018 the average number of fires per year is 61. The highest number of fires - 98 took place in 2011, and the least - 8 in 2004. The data has a rising trend.
When looking into fire subcategories, the most reports belonged to: Structure Fires (39.9%), and Outside Fires (38.3%).
Fire incident types reported to NFIRS in Zip Code 22033


 Nearest zip codes: 22035, 20171, 22124, 22030, 20151, 20191.


 According to the data from the years 2004 - 2018 the average number of fires per year is 61. The highest number of fires - 98 took place in 2011, and the least - 8 in 2004. The data has a rising trend.
 When looking into fire subcategories, the most reports belonged to: Structure Fires (39.9%), and Outside Fires (38.3%).