Estimated zip code population in 2022: 802 Zip code population in 2010: 347 Zip code population in 2000: 519
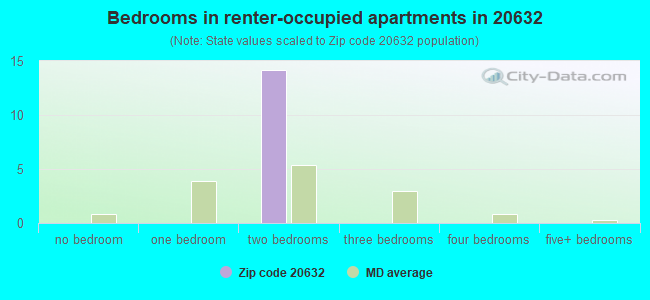
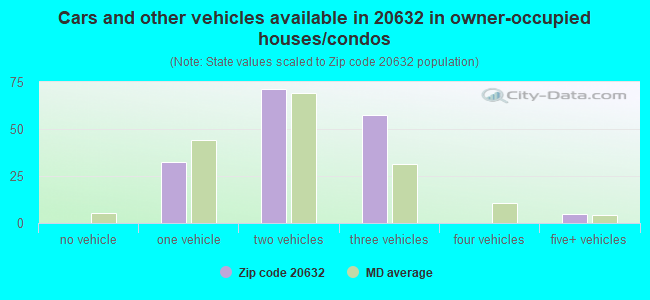
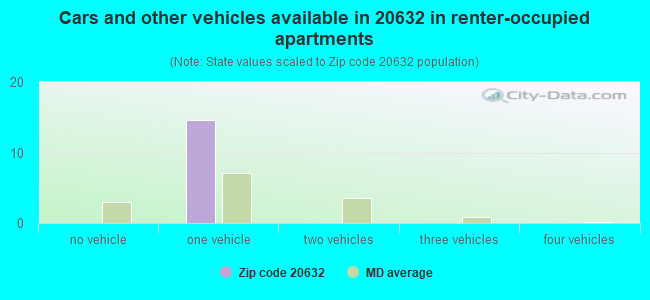
Houses and condos: 236 Renter-occupied apartments: 14
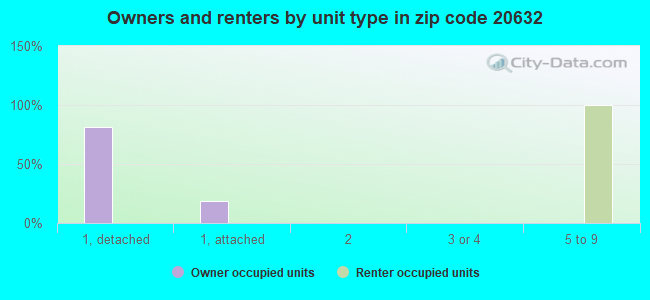
% of renters here:
8%
State:
32%
March 2022 cost of living index in zip code 20632: 128.8 (high, U.S. average is 100)
Land area: 7.3 sq. mi. Water area: 0.2 sq. mi.
Population density: 109 people per square mile
(very low).
OSM Map
General Map
Google Map
MSN Map
OSM Map
General Map
Google Map
MSN Map
OSM Map
General Map
Google Map
MSN Map
OSM Map
General Map
Google Map
MSN Map
Please wait while loading the map...
Real estate property taxes paid for housing units in 2022:
This zip code:
1.2% ($6,125)
Maryland:
0.9% ($3,777)
Median real estate property taxes paid for housing units with mortgages in 2022: $5,654 (1.0%) Median real estate property taxes paid for housing units with no mortgage in 2022: $6,963 (1.4%)
Business Search- 14 Million verified businesses
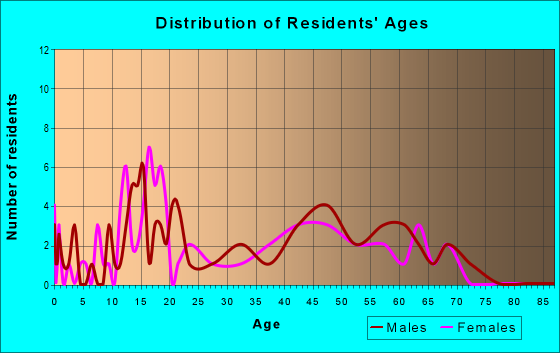
Males: 366
(45.6%)
Females: 436
(54.4%)
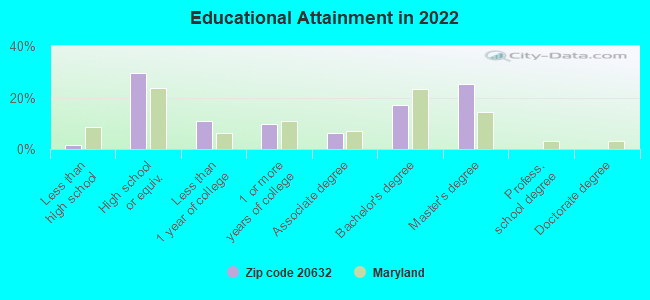
For population 25 years and over in 20632:
High school or higher: 98.3%
Bachelor's degree or higher: 42.1%
Graduate or professional degree: 25.0%
Unemployed: 2.3%
Mean travel time to work (commute): 29.6 minutes
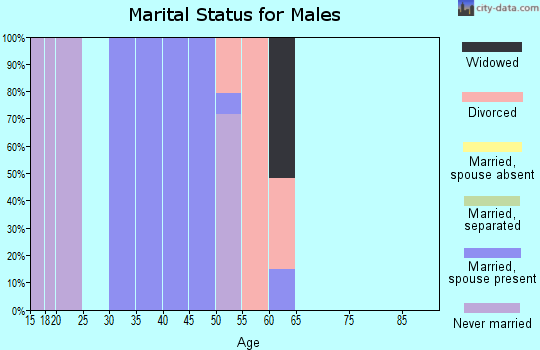
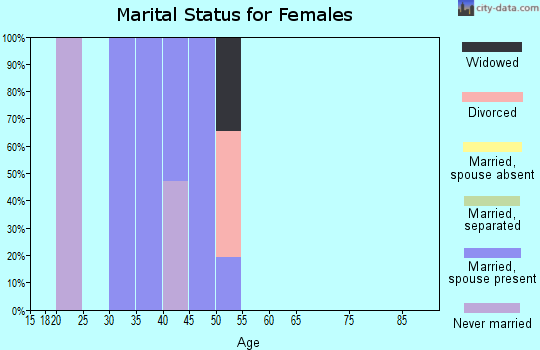
For population 15 years and over in 20632:
Never married: 15.4%
Now married: 69.5%
Separated: 0.0%
Widowed: 8.1%
Divorced: 7.0%
Zip code 20632 compared to state average:
Median household income above state average.
Unemployed percentage below state average.
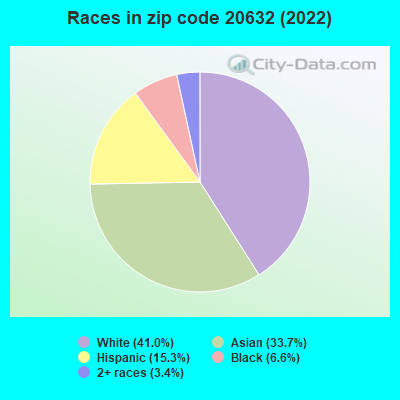
Black race population percentage significantly below state average.
Foreign-born population percentage above state average.
Renting percentage significantly below state average.
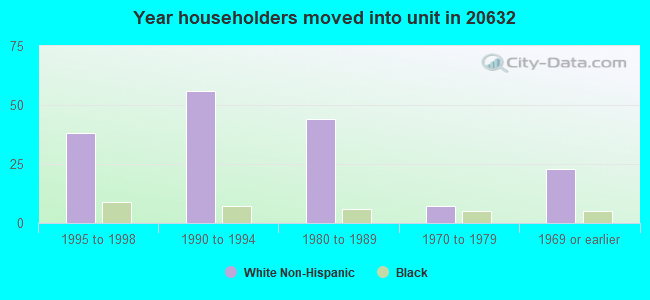
Length of stay since moving in significantly above state average.
Number of rooms per house significantly above state average.
Number of college students significantly below state average.
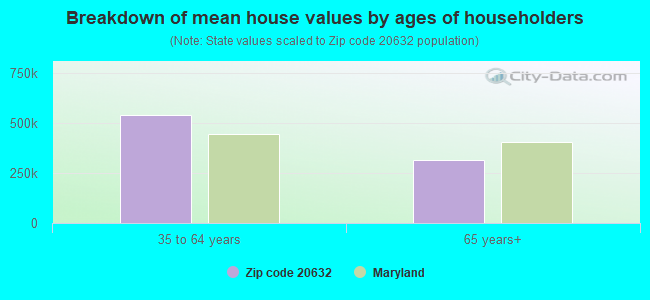
Estimated median house/condo value in 2022: $513,920
20632:
$513,920
Maryland:
$398,100
Median resident age:
This zip code:
39.9 years
Maryland median age:
39.7 years
Average household size:
This zip code:
4.3 people
Maryland:
2.5 people
Averages for the 2020 tax year for zip code 20632, filed in 2021:
Average Adjusted Gross Income (AGI) in 2020: $89,017 (Individual Income Tax Returns)
Here:
$89,017
State:
$86,905
Salary/wage: $80,390 (reported on 83.3% of returns)
Here:
$80,390
State:
$73,953
(% of AGI for various income ranges: 1000.0% for AGIs below $25k, 3305.0% for AGIs $25k-50k, 5140.0% for AGIs $50k-75k, 35666.7% for AGIs $100k-200k)
Taxable interest for individuals: $691 (reported on 45.8% of returns)
This zip code:
$691
Maryland:
$1,528
(% of AGI for various income ranges: 36.7% for AGIs below $25k, 27.5% for AGIs $50k-75k, 180.0% for AGIs $100k-200k)
Ordinary dividends: $1,980 (reported on 20.8% of returns)
Here:
$1,980
State:
$8,028
(% of AGI for various income ranges: 26.7% for AGIs below $25k, 303.3% for AGIs $100k-200k)
Net capital gain/loss in AGI: +$5,980 (reported on 20.8% of returns)
Here:
+$5,980
State:
+$25,238
(% of AGI for various income ranges: 40.0% for AGIs below $25k, 956.7% for AGIs $100k-200k)
Profit/loss from business: +$6,767 (reported on 12.5% of returns)
Here:
+$6,767
State:
+$11,398
(% of AGI for various income ranges: 507.5% for AGIs $50k-75k)
Total itemized deductions: $31,275 (reported on 16.7% of returns)
Here:
$31,275
State:
$30,672
(% of AGI for various income ranges: 4170.0% for AGIs $100k-200k)
Charity contributions: $5,275 (reported on 16.7% of returns)
Here:
$5,275
State:
$9,065
(% of AGI for various income ranges: 703.3% for AGIs $100k-200k)
Taxes paid: $10,150 (reported on 16.7% of returns)
20632:
$10,150
State:
$8,475
(% of AGI for various income ranges: 1353.3% for AGIs $100k-200k)
Percentage of individuals using paid preparers for their 2020 taxes: 87.5%
Here:
88%
State:
90%
(% for various income ranges: 100.0% for AGIs below $25k, 80.0% for AGIs $25k-50k, 100.0% for AGIs $50k-75k, 66.7% for AGIs $75k-100k, 87.5% for AGIs $100k-200k)
Averages for the 2012 tax year for zip code 20632, filed in 2013:
Average Adjusted Gross Income (AGI) in 2012: $62,286 (Individual Income Tax Returns)
Here:
$62,286
State:
$72,703
Salary/wage: $57,556 (reported on 85.7% of returns)
Here:
$57,556
State:
$62,228
(% of AGI for various income ranges: 68.6% for AGIs below $25k, 70.6% for AGIs $25k-50k, 81.0% for AGIs $50k-75k, 83.9% for AGIs $75k-100k, 80.7% for AGIs $100k-200k)
Taxable interest for individuals: $330 (reported on 47.6% of returns)
This zip code:
$330
Maryland:
$1,413
(% of AGI for various income ranges: 2.0% for AGIs below $25k, 0.3% for AGIs $50k-75k, 0.2% for AGIs $100k-200k)
Ordinary dividends: $2,400 (reported on 19.0% of returns)
Here:
$2,400
State:
$6,933
Profit/loss from business: +$2,400 (reported on 9.5% of returns)
Here:
+$2,400
State:
+$12,606
Total itemized deductions: $23,900 (23% of AGI, reported on 47.6% of returns)
Here:
$23,900
State:
$27,886
Here:
23.3% of AGI
State:
22.8% of AGI
Charity contributions: $2,788 (reported on 38.1% of returns)
Here:
$2,788
State:
$4,452
Taxes paid: $10,320 (reported on 47.6% of returns)
20632:
$10,320
State:
$11,690
Earned income credit: $1,650 (reported on 9.5% of returns)
Here:
$1,650
State:
$2,199
(% of AGI for various income ranges: 4.4% for AGIs below $25k)
Percentage of individuals using paid preparers for their 2012 taxes: 61.9%
Here:
62%
State:
52%
(% for various income ranges: 57.1% for AGIs below $25k, 60.0% for AGIs $25k-50k, 100.0% for AGIs $50k-75k, 75.0% for AGIs $100k-200k)
Averages for the 2004 tax year for zip code 20632, filed in 2005:
Average Adjusted Gross Income (AGI) in 2004: $50,680 (Individual Income Tax Returns)
Here:
$50,680
State:
$60,339
Salary/wage: $49,106 (reported on 81.1% of returns)
Here:
$49,106
State:
$52,211
(% of AGI for various income ranges: 72.3% for AGIs below $10k, 73.7% for AGIs $10k-25k, 79.7% for AGIs $25k-50k, 79.5% for AGIs $50k-75k, 72.2% for AGIs $75k-100k, 80.9% for AGIs over 100k)
Taxable interest for individuals: $631 (reported on 46.4% of returns)
This zip code:
$631
Maryland:
$1,701
(% of AGI for various income ranges: 2.1% for AGIs below $10k, 1.0% for AGIs $10k-25k, 0.5% for AGIs $25k-50k, 1.0% for AGIs $50k-75k, 0.5% for AGIs $75k-100k, 0.4% for AGIs over 100k)
Taxable dividends: $1,000 (reported on 17.6% of returns)
Here:
$1,000
State:
$4,235
(% of AGI for various income ranges: 2.1% for AGIs below $10k, 0.3% for AGIs $50k-75k, 0.6% for AGIs over 100k)
Net capital gain/loss: +$2,818 (reported on 9.9% of returns)
Here:
+$2,818
State:
+$15,888
Profit/loss from business: +$3,857 (reported on 9.5% of returns)
Here:
+$3,857
State:
+$12,221
Total itemized deductions: $20,388 (25% of AGI, reported on 44.1% of returns)
Here:
$20,388
State:
$22,960
Here:
24.8% of AGI
State:
23.3% of AGI
(% of AGI for various income ranges: 23.7% for AGIs $10k-25k, 18.8% for AGIs $25k-50k, 16.5% for AGIs $50k-75k, 16.6% for AGIs $75k-100k, 17.9% for AGIs over 100k)
Charity contributions deductions: $2,282 (3% of AGI, reported on 38.3% of returns)
Here:
$2,282
State:
$4,031
Here:
2.6% of AGI
State:
3.9% of AGI
(% of AGI for various income ranges: 2.0% for AGIs $25k-50k, 1.8% for AGIs $50k-75k, 1.5% for AGIs $75k-100k, 2.0% for AGIs over 100k)
Total tax: $6,835 (reported on 76.6% of returns)
20632:
$6,835
State:
$10,167
(% of AGI for various income ranges: 1.5% for AGIs below $10k, 3.8% for AGIs $10k-25k, 6.8% for AGIs $25k-50k, 7.3% for AGIs $50k-75k, 9.9% for AGIs $75k-100k, 14.3% for AGIs over 100k)
Earned income credit: $1,760 (reported on 11.3% of returns)
Here:
$1,760
State:
$1,700
Percentage of individuals using paid preparers for their 2004 taxes: 65.8%
Here:
66%
State:
55%
(% for various income ranges: 53.8% for AGIs below $10k, 66.7% for AGIs $10k-25k, 71.4% for AGIs $25k-50k, 64.3% for AGIs $50k-75k, 68.4% for AGIs $75k-100k, 68.6% for AGIs over 100k)
Household received Food Stamps/SNAP in the past 12 months: 43 Household did not receive Food Stamps/SNAP in the past 12 months: 138
Women who had a birth in the past 12 months: 6 (0 now married, 6 unmarried) Women who did not have a birth in the past 12 months: 164 (107 now married, 56 unmarried)
Housing units in zip code 20632 with a mortgage: 86 Median monthly owner costs for units with a mortgage: $2,896 Median monthly owner costs for units without a mortgage: $1,059
Residents with income below the poverty level in 2022:
This zip code:
2.0%
Whole state:
9.6%
Residents with income below 50% of the poverty level in 2022:
This zip code:
0.5%
Whole state:
4.7%
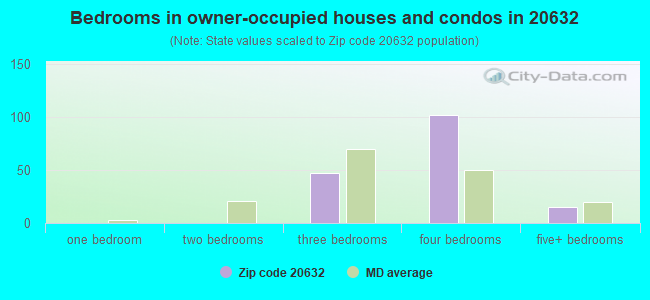
Median number of rooms in houses and condos:
Here:
10.0
State:
7.3
Notable locations in this zip code not listed on our city pages
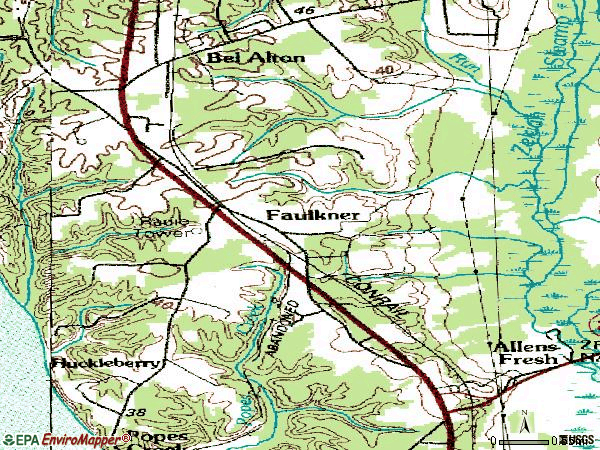
Streams, rivers, and creeks: Bunker Hill Branch (A), Zekiah Swamp Run (B), Mud Creek (C), Scar Branch (D), Clark Run (E), Ross Branch (F), Posey Creek (G). Display/hide their locations on the map
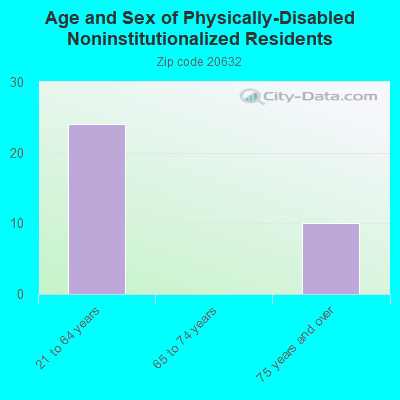
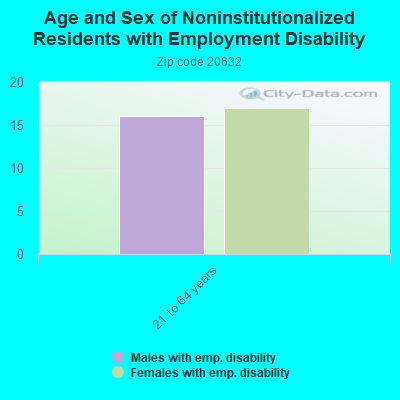
In group quarters: 25 (-1 institutionalized population)
Size of family households: 34 2-persons, 71 3-persons, 24 5-persons, 5 6-persons, 31 7-or-more-persons
Size of nonfamily households: 10 1-person
160 married couples with children.
0 single-parent households ().
65.1% of residents of 20632 zip code speak English at home.
7.0% of residents speak Spanish at home (100% very well).
26.5% of residents speak other Indo-European language at home (66% very well, 16% well, 18% not well).
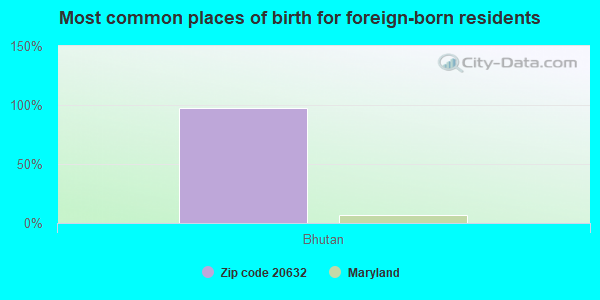
Foreign born population: 244 (30.5%) (65.6% of them are naturalized citizens)
This zip code:
30.5%
Whole state:
16.7%
97%Bhutan
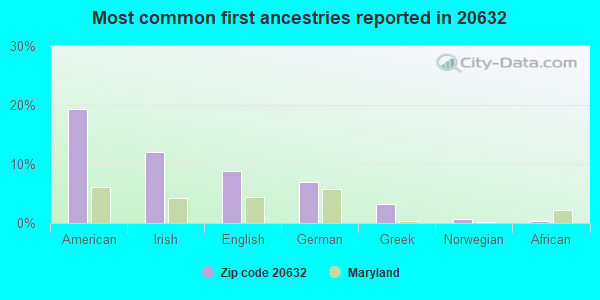
19%American
12%Irish
9%English
7%German
3%Greek
1%Norwegian
0%African
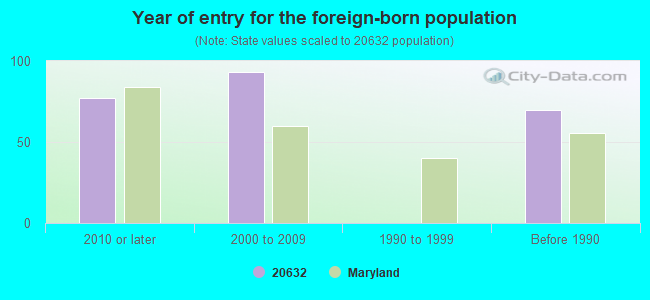
Year of entry for the foreign-born population
772010 or later
932000 to 2009
01990 to 1999
70Before 1990
Facilities with environmental interests located in this zip code:
A T & T NETWORK SERVICES - FAULKNER (10125 POPES CREEK ROAD in FAULKNER, MD)
AIR MINOR (AIRS/AFS) STATE MASTER (Maryland Permits tracking) - NPDES NON-MAJOR, OIL CONTROL STATE MASTER (Maryland Air Emissions Database) - AIR MINOR National Pollutant Discharge Elimination System NON-MAJOR (Tracking pollutant discharge elimination systems) - permit Small Quantity Generators, between 100 kg and 1000 kg of hazardous waste/month (Resource Conservation and Recovery Act (tracking hazardous waste)) - notification Business SIC classification: TELEPHONE AND TELEGRAPH APPARATUS; TELEPHONE COMMUNICATIONS, EXCEPT RADIOTELEPHONE Organizations: OPERNAME (CONTACT/OPERATOR)
, A T & T COMMUNICATIONS (CONTACT/OWNER)
Alternative names: AMERICAN TELEPHONE & TELEGRAPH, AT&T - FAULKNER, AT&T FAULKNER WWTP
MIRANT (10200 FAULKNER ROAD in FAULKNER, MD)
(Integrated Compliance Information System) - ICIS-03-1994-0175, FORMAL ENFORCEMENT ACTION STATE MASTER (Maryland Permits tracking) - NPDES NON-MAJOR National Pollutant Discharge Elimination System NON-MAJOR (Tracking pollutant discharge elimination systems) - permit Business SIC classification: REFUSE SYSTEMS Alternative names: MIRANT - FAULKNER FLYASH MANAGEMENT SITE, POTOMAAAC ELECTRIC POWER CO.E
Housing units lacking complete plumbing facilities: 1.7% Housing units lacking complete kitchen facilities: 1.9%
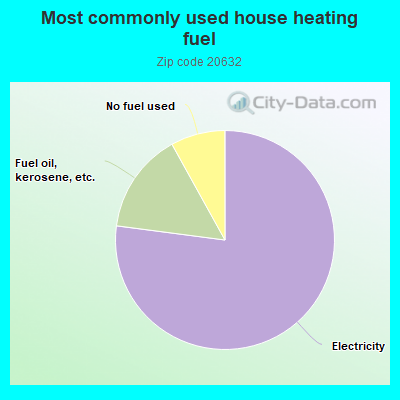
77.7%Electricity
15.0%Fuel oil, kerosene, etc.
8.1%No fuel used
Population in 1990: 459. Population change in the 1990s: +60 (+13.1%).
Place of birth for U.S.-born residents:
This state: 321
Northeast: 28
Midwest: 51
South: 154
West: 10
86% of the 20632 zip code residents lived in the same house 5 years ago. Out of people who lived in different houses, 73% lived in this county. Out of people who lived in different counties, 50% lived in Maryland.
99% of the 20632 zip code residents lived in the same house 1 year ago. Out of people who lived in different houses, 120% moved from this county. Out of people who lived in different houses, 20% moved from different county within same state.
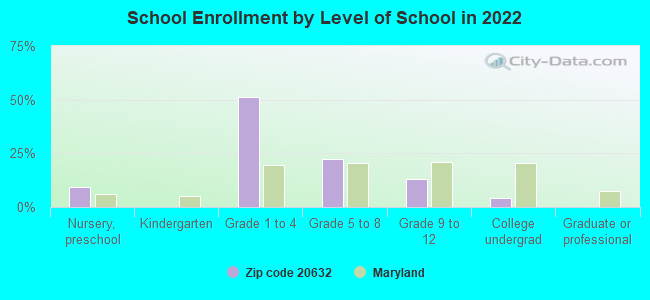
Private vs. public school enrollment:
Students in private schools in grades 1 to 8 (elementary and middle school):
Here:
0.0%
Maryland:
15.2%
Students in private schools in grades 9 to 12 (high school): 7
Here:
29.3%
Maryland:
14.4%
Students in private undergraduate colleges:
Here:
0.0%
Maryland:
20.2%
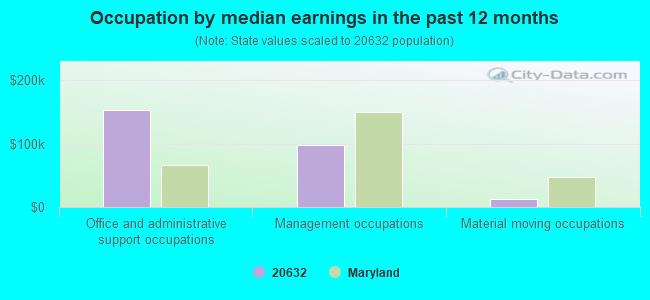
Occupation by median earnings in the past 12 months ($)
153,847Office and administrative support occupations
97,470Management occupations
13,035Material moving occupations
Companies with federal contracts located in this zip code:
HUGH C GARDINER INC (10030 CRAIN HWY in FAULKNER, MD; small business)
$2,951 with Army for Soil Preparation Equipment. Signed on 2002-08-29. Completion date: 2002-09-27.
Top industries in this zip code by the number of employees in 2005:
Other Services (except Public Administration): Religious Organizations (10-19 employees: 1 establishment)
Construction: Drywall and Insulation Contractors (10-19: 1)
Administrative and Support and Waste Management and Remediation Services: Janitorial Services (1-4: 1)
Other Services (except Public Administration): Automotive Body, Paint, and Interior Repair and Maintenance (1-4: 1)
Other Services (except Public Administration): Business Associations (1-4: 1)
Utilities: Electric Power Distribution (1-4: 1)
Accommodation and Food Services: Hotels (except Casino Hotels) and Motels (1-4: 1)
Real Estate and Rental and Leasing: Offices of Real Estate Agents and Brokers (1-4: 1)
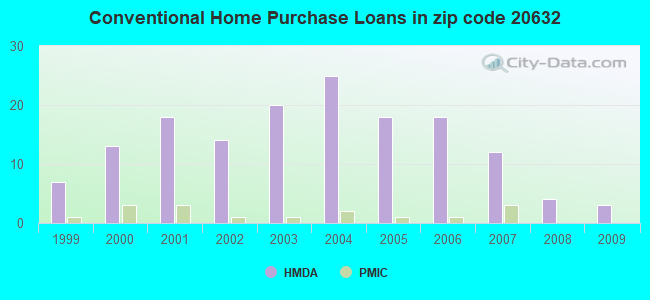
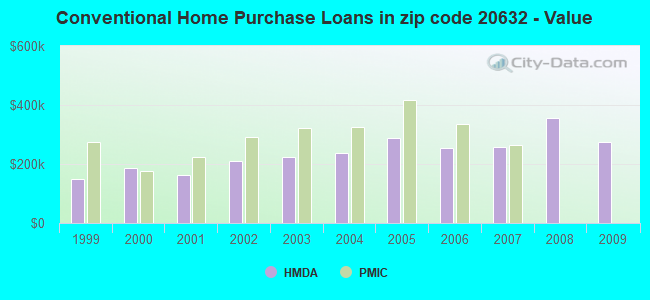
Home Mortgage Disclosure Act Aggregated Statistics For Year 2009 (Based on 2 partial tracts)
A) FHA, FSA/RHS & VA Home Purchase Loans
B) Conventional Home Purchase Loans
C) Refinancings
D) Home Improvement Loans
Number
Average Value
Number
Average Value
Number
Average Value
Number
Average Value
LOANS ORIGINATED
7
$280,331
3
$274,580
41
$280,203
1
$24,440
APPLICATIONS APPROVED, NOT ACCEPTED
0
$0
0
$0
2
$224,985
0
$0
APPLICATIONS DENIED
0
$0
1
$227,140
15
$296,113
2
$119,320
APPLICATIONS WITHDRAWN
0
$0
0
$0
6
$341,190
0
$0
FILES CLOSED FOR INCOMPLETENESS
0
$0
0
$0
2
$400,130
0
$0
Aggregated Statistics For Year 2008 (Based on 2 partial tracts)
A) FHA, FSA/RHS & VA Home Purchase Loans
B) Conventional Home Purchase Loans
C) Refinancings
D) Home Improvement Loans
F) Non-occupant Loans on < 5 Family Dwellings (A B C & D)
Number
Average Value
Number
Average Value
Number
Average Value
Number
Average Value
Number
Average Value
LOANS ORIGINATED
2
$487,105
4
$355,448
24
$311,180
3
$130,503
1
$513,700
APPLICATIONS APPROVED, NOT ACCEPTED
0
$0
0
$0
3
$261,163
1
$36,900
0
$0
APPLICATIONS DENIED
0
$0
0
$0
16
$317,111
3
$168,520
1
$203,660
APPLICATIONS WITHDRAWN
1
$445,660
2
$524,725
9
$305,091
1
$280,810
0
$0
FILES CLOSED FOR INCOMPLETENESS
0
$0
0
$0
2
$243,675
0
$0
0
$0
Aggregated Statistics For Year 2007 (Based on 2 partial tracts)
B) Conventional Home Purchase Loans
C) Refinancings
D) Home Improvement Loans
F) Non-occupant Loans on < 5 Family Dwellings (A B C & D)
G) Loans On Manufactured Home Dwelling (A B C & D)
Number
Average Value
Number
Average Value
Number
Average Value
Number
Average Value
Number
Average Value
LOANS ORIGINATED
12
$259,207
35
$285,959
7
$127,810
1
$281,290
0
$0
APPLICATIONS APPROVED, NOT ACCEPTED
1
$528,080
5
$268,832
2
$417,385
0
$0
0
$0
APPLICATIONS DENIED
4
$270,270
17
$329,689
1
$171,070
0
$0
1
$41,210
APPLICATIONS WITHDRAWN
2
$437,510
12
$298,981
1
$309,080
0
$0
0
$0
FILES CLOSED FOR INCOMPLETENESS
0
$0
3
$303,493
0
$0
0
$0
0
$0
Aggregated Statistics For Year 2006 (Based on 2 partial tracts)
B) Conventional Home Purchase Loans
C) Refinancings
D) Home Improvement Loans
F) Non-occupant Loans on < 5 Family Dwellings (A B C & D)
Number
Average Value
Number
Average Value
Number
Average Value
Number
Average Value
LOANS ORIGINATED
18
$254,588
58
$284,926
12
$157,298
3
$173,310
APPLICATIONS APPROVED, NOT ACCEPTED
3
$248,387
5
$238,450
2
$210,130
0
$0
APPLICATIONS DENIED
5
$456,870
24
$301,676
6
$159,175
3
$131,460
APPLICATIONS WITHDRAWN
4
$204,380
16
$292,881
1
$352,690
1
$293,750
FILES CLOSED FOR INCOMPLETENESS
2
$354,130
5
$299,308
0
$0
0
$0
Aggregated Statistics For Year 2005 (Based on 2 partial tracts)
A) FHA, FSA/RHS & VA Home Purchase Loans
B) Conventional Home Purchase Loans
C) Refinancings
D) Home Improvement Loans
F) Non-occupant Loans on < 5 Family Dwellings (A B C & D)
Number
Average Value
Number
Average Value
Number
Average Value
Number
Average Value
Number
Average Value
LOANS ORIGINATED
1
$345,980
18
$288,239
63
$237,090
11
$140,928
1
$258,770
APPLICATIONS APPROVED, NOT ACCEPTED
0
$0
3
$291,673
4
$308,365
1
$210,850
0
$0
APPLICATIONS DENIED
0
$0
5
$582,994
15
$225,671
2
$238,400
1
$307,170
APPLICATIONS WITHDRAWN
0
$0
6
$324,738
16
$264,998
1
$181,140
1
$134,660
FILES CLOSED FOR INCOMPLETENESS
0
$0
1
$608,100
6
$293,830
0
$0
0
$0
Aggregated Statistics For Year 2004 (Based on 2 partial tracts)
A) FHA, FSA/RHS & VA Home Purchase Loans
B) Conventional Home Purchase Loans
C) Refinancings
D) Home Improvement Loans
F) Non-occupant Loans on < 5 Family Dwellings (A B C & D)
Number
Average Value
Number
Average Value
Number
Average Value
Number
Average Value
Number
Average Value
LOANS ORIGINATED
2
$225,465
25
$238,009
59
$223,429
9
$108,779
3
$199,027
APPLICATIONS APPROVED, NOT ACCEPTED
0
$0
1
$239,600
6
$180,418
1
$63,250
0
$0
APPLICATIONS DENIED
0
$0
2
$162,210
15
$171,170
5
$59,038
2
$158,375
APPLICATIONS WITHDRAWN
0
$0
3
$269,630
20
$235,000
2
$74,275
0
$0
FILES CLOSED FOR INCOMPLETENESS
0
$0
0
$0
2
$328,250
0
$0
0
$0
Aggregated Statistics For Year 2003 (Based on 2 partial tracts)
A) FHA, FSA/RHS & VA Home Purchase Loans
B) Conventional Home Purchase Loans
C) Refinancings
D) Home Improvement Loans
F) Non-occupant Loans on < 5 Family Dwellings (A B C & D)
Number
Average Value
Number
Average Value
Number
Average Value
Number
Average Value
Number
Average Value
LOANS ORIGINATED
2
$256,610
20
$223,858
117
$183,566
5
$175,962
2
$254,215
APPLICATIONS APPROVED, NOT ACCEPTED
1
$194,560
0
$0
12
$182,575
2
$40,490
0
$0
APPLICATIONS DENIED
0
$0
1
$389,590
17
$204,646
4
$51,395
0
$0
APPLICATIONS WITHDRAWN
0
$0
3
$257,010
18
$194,476
0
$0
0
$0
FILES CLOSED FOR INCOMPLETENESS
0
$0
0
$0
1
$284,640
0
$0
0
$0
Aggregated Statistics For Year 2002 (Based on 2 partial tracts)
A) FHA, FSA/RHS & VA Home Purchase Loans
B) Conventional Home Purchase Loans
C) Refinancings
D) Home Improvement Loans
F) Non-occupant Loans on < 5 Family Dwellings (A B C & D)
Number
Average Value
Number
Average Value
Number
Average Value
Number
Average Value
Number
Average Value
LOANS ORIGINATED
5
$174,812
14
$209,856
63
$165,415
3
$39,613
2
$95,360
APPLICATIONS APPROVED, NOT ACCEPTED
0
$0
1
$187,850
8
$150,409
2
$60,380
0
$0
APPLICATIONS DENIED
0
$0
1
$147,110
12
$160,292
3
$25,877
0
$0
APPLICATIONS WITHDRAWN
0
$0
1
$195,030
12
$164,006
1
$68,530
0
$0
FILES CLOSED FOR INCOMPLETENESS
0
$0
0
$0
4
$125,310
0
$0
0
$0
Aggregated Statistics For Year 2001 (Based on 2 partial tracts)
A) FHA, FSA/RHS & VA Home Purchase Loans
B) Conventional Home Purchase Loans
C) Refinancings
D) Home Improvement Loans
F) Non-occupant Loans on < 5 Family Dwellings (A B C & D)
Number
Average Value
Number
Average Value
Number
Average Value
Number
Average Value
Number
Average Value
LOANS ORIGINATED
8
$158,555
18
$162,901
43
$169,626
8
$28,092
1
$187,850
APPLICATIONS APPROVED, NOT ACCEPTED
0
$0
0
$0
5
$165,612
2
$25,875
0
$0
APPLICATIONS DENIED
0
$0
0
$0
15
$151,171
2
$72,840
1
$122,200
APPLICATIONS WITHDRAWN
1
$121,240
1
$175,390
14
$175,798
2
$46,720
0
$0
FILES CLOSED FOR INCOMPLETENESS
0
$0
0
$0
0
$0
0
$0
0
$0
Aggregated Statistics For Year 2000 (Based on 2 partial tracts)
A) FHA, FSA/RHS & VA Home Purchase Loans
B) Conventional Home Purchase Loans
C) Refinancings
D) Home Improvement Loans
F) Non-occupant Loans on < 5 Family Dwellings (A B C & D)
Number
Average Value
Number
Average Value
Number
Average Value
Number
Average Value
Number
Average Value
LOANS ORIGINATED
6
$176,745
13
$185,377
14
$167,926
4
$30,908
1
$94,400
APPLICATIONS APPROVED, NOT ACCEPTED
0
$0
1
$156,700
2
$170,115
1
$32,590
0
$0
APPLICATIONS DENIED
0
$0
3
$169,637
11
$76,236
2
$29,950
1
$251,580
APPLICATIONS WITHDRAWN
0
$0
1
$513,220
4
$118,602
0
$0
0
$0
FILES CLOSED FOR INCOMPLETENESS
0
$0
0
$0
1
$53,190
0
$0
0
$0
Aggregated Statistics For Year 1999 (Based on 1 partial tract)
Detailed PMIC statistics for the following Tracts:8511.00
2002 - 2018 National Fire Incident Reporting System (NFIRS) incidents
Based on the data from the years 2002 - 2018 the average number of fire incidents per year is 7. The highest number of reported fires - 17 took place in 2017, and the least - 0 in 2010. The data has a constant trend.
When looking into fire subcategories, the most reports belonged to: Outside Fires (49.2%), and Structure Fires (30.6%).
Fire incident types reported to NFIRS in Zip Code 20632


 Nearest zip codes: 20611, 20622, 20664, 20646, 20677, 22448.
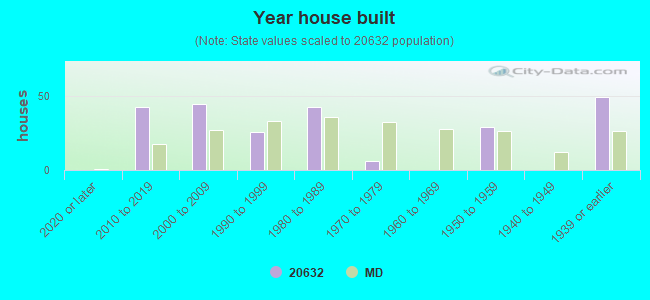


 Based on the data from the years 2002 - 2018 the average number of fire incidents per year is 7. The highest number of reported fires - 17 took place in 2017, and the least - 0 in 2010. The data has a constant trend.
 When looking into fire subcategories, the most reports belonged to: Outside Fires (49.2%), and Structure Fires (30.6%).