Estimated zip code population in 2022: 2,781 Zip code population in 2010: 2,987 Zip code population in 2000: 2,716
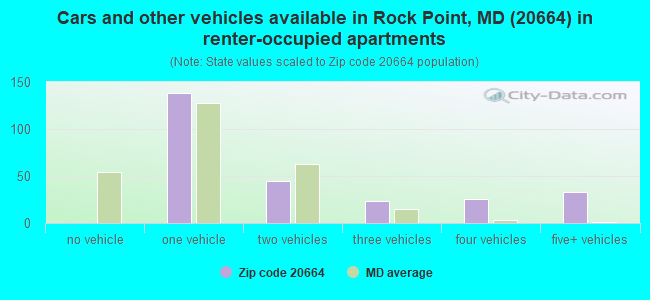
Houses and condos: 1,432 Renter-occupied apartments: 272
% of renters here:
25%
State:
32%
March 2022 cost of living index in zip code 20664: 138.5 (high, U.S. average is 100)
Land area: 41.1 sq. mi. Water area: 5.5 sq. mi.
Population density: 68 people per square mile
(very low).
OSM Map
General Map
Google Map
MSN Map
OSM Map
General Map
Google Map
MSN Map
OSM Map
General Map
Google Map
MSN Map
OSM Map
General Map
Google Map
MSN Map
Please wait while loading the map...
Real estate property taxes paid for housing units in 2022:
This zip code:
1.0% ($3,561)
Maryland:
0.9% ($3,777)
Median real estate property taxes paid for housing units with mortgages in 2022: $3,420 (1.0%) Median real estate property taxes paid for housing units with no mortgage in 2022: $3,883 (0.9%)
Business Search- 14 Million verified businesses
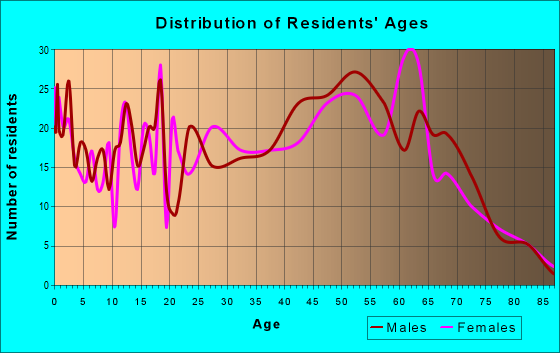
Males: 1,606
(57.8%)
Females: 1,174
(42.2%)
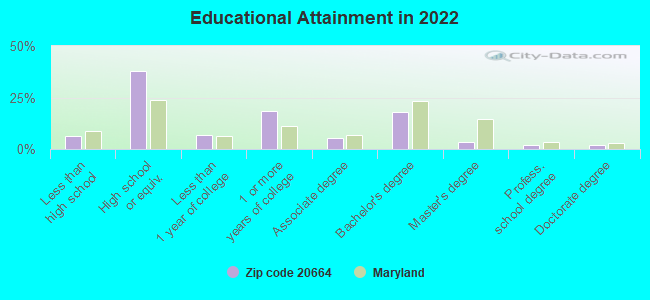
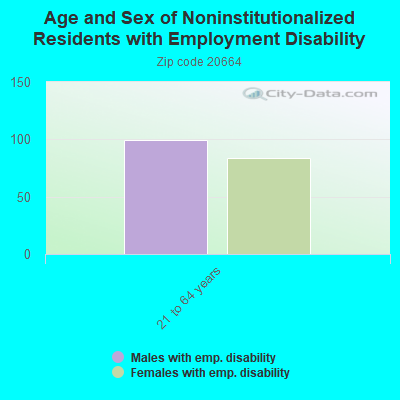
For population 25 years and over in 20664:
High school or higher: 91.7%
Bachelor's degree or higher: 24.4%
Graduate or professional degree: 6.9%
Unemployed: 2.3%
Mean travel time to work (commute): 48.8 minutes
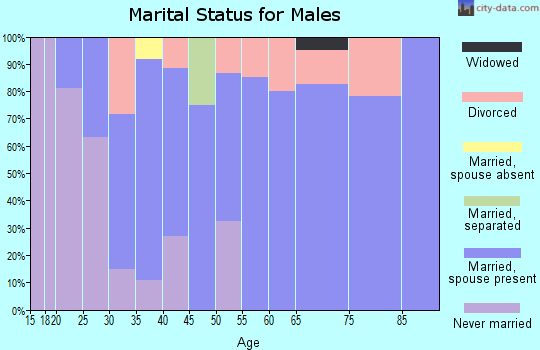
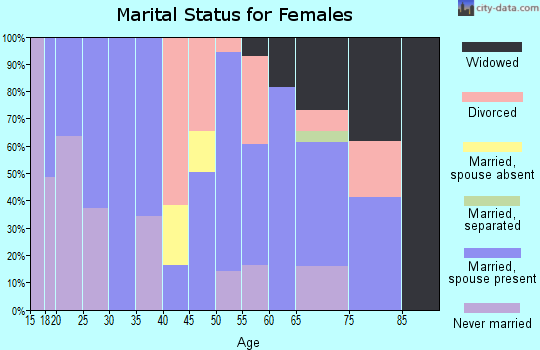
For population 15 years and over in 20664:
Never married: 22.4%
Now married: 67.6%
Separated: 0.0%
Widowed: 3.7%
Divorced: 6.2%
Zip code 20664 compared to state average:
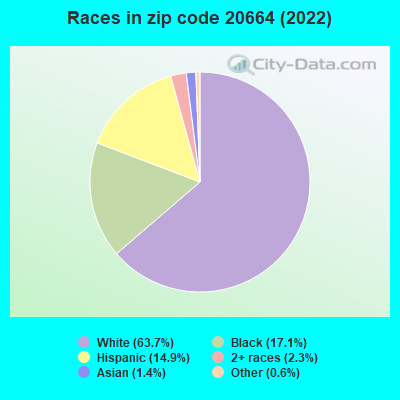
Black race population percentage below state average.
Foreign-born population percentage significantly below state average.
Number of college students significantly below state average.
Percentage of population with a bachelor's degree or higher below state average.
Averages for the 2020 tax year for zip code 20664, filed in 2021:
Average Adjusted Gross Income (AGI) in 2020: $81,340 (Individual Income Tax Returns)
Here:
$81,340
State:
$86,905
Salary/wage: $67,499 (reported on 81.0% of returns)
Here:
$67,499
State:
$73,953
(% of AGI for various income ranges: 1031.8% for AGIs below $25k, 3750.4% for AGIs $25k-50k, 6306.2% for AGIs $50k-75k, 9206.4% for AGIs $75k-100k, 18306.9% for AGIs $100k-200k, 81130.0% for AGIs over 200k)
Taxable interest for individuals: $1,514 (reported on 34.5% of returns)
This zip code:
$1,514
Maryland:
$1,528
(% of AGI for various income ranges: 9.3% for AGIs below $25k, 16.7% for AGIs $25k-50k, 35.0% for AGIs $50k-75k, 63.6% for AGIs $75k-100k, 76.9% for AGIs $100k-200k, 2135.0% for AGIs over 200k)
Ordinary dividends: $6,432 (reported on 13.4% of returns)
Here:
$6,432
State:
$8,028
(% of AGI for various income ranges: 8.6% for AGIs below $25k, 16.7% for AGIs $25k-50k, 62.5% for AGIs $50k-75k, 25.5% for AGIs $75k-100k, 267.5% for AGIs $100k-200k, 3010.0% for AGIs over 200k)
Net capital gain/loss in AGI: +$13,319 (reported on 14.8% of returns)
Here:
+$13,319
State:
+$25,238
(% of AGI for various income ranges: 26.7% for AGIs $25k-50k, 148.1% for AGIs $50k-75k, 351.2% for AGIs $100k-200k, 9670.0% for AGIs over 200k)
Profit/loss from business: +$7,262 (reported on 14.8% of returns)
Here:
+$7,262
State:
+$11,398
(% of AGI for various income ranges: 67.9% for AGIs below $25k, 16.9% for AGIs $50k-75k, 101.8% for AGIs $75k-100k, 750.0% for AGIs $100k-200k)
Taxable individual retirement arrangement distribution: $15,444 (reported on 6.3% of returns)
20664:
$15,444
Maryland:
$20,944
(% of AGI for various income ranges: 75.0% for AGIs below $25k, 215.0% for AGIs $50k-75k, 522.5% for AGIs $100k-200k)
Total itemized deductions: $30,687 (reported on 21.1% of returns)
Here:
$30,687
State:
$30,672
(% of AGI for various income ranges: 327.5% for AGIs $25k-50k, 723.8% for AGIs $50k-75k, 1169.1% for AGIs $75k-100k, 2065.0% for AGIs $100k-200k, 13360.0% for AGIs over 200k)
Charity contributions: $7,252 (reported on 17.6% of returns)
Here:
$7,252
State:
$9,065
(% of AGI for various income ranges: 42.5% for AGIs $25k-50k, 95.0% for AGIs $50k-75k, 143.6% for AGIs $75k-100k, 407.5% for AGIs $100k-200k, 3745.0% for AGIs over 200k)
Taxes paid: $8,693 (reported on 21.1% of returns)
20664:
$8,693
State:
$8,475
(% of AGI for various income ranges: 85.4% for AGIs $25k-50k, 235.6% for AGIs $50k-75k, 407.3% for AGIs $75k-100k, 661.2% for AGIs $100k-200k, 2600.0% for AGIs over 200k)
Earned income credit: $1,955 (reported on 14.1% of returns)
Here:
$1,955
State:
$2,151
(% of AGI for various income ranges: 86.4% for AGIs below $25k, 62.1% for AGIs $25k-50k)
Percentage of individuals using paid preparers for their 2020 taxes: 89.4%
Here:
89%
State:
90%
(% for various income ranges: 89.2% for AGIs below $25k, 84.8% for AGIs $25k-50k, 90.9% for AGIs $50k-75k, 93.3% for AGIs $75k-100k, 89.3% for AGIs $100k-200k, 100.0% for AGIs over 200k)
Averages for the 2012 tax year for zip code 20664, filed in 2013:
Average Adjusted Gross Income (AGI) in 2012: $69,566 (Individual Income Tax Returns)
Here:
$69,566
State:
$72,703
Salary/wage: $54,286 (reported on 82.1% of returns)
Here:
$54,286
State:
$62,228
(% of AGI for various income ranges: 69.3% for AGIs below $25k, 80.0% for AGIs $25k-50k, 77.1% for AGIs $50k-75k, 77.2% for AGIs $75k-100k, 75.8% for AGIs $100k-200k, 29.5% for AGIs over 200k)
Taxable interest for individuals: $1,098 (reported on 35.8% of returns)
This zip code:
$1,098
Maryland:
$1,413
(% of AGI for various income ranges: 0.8% for AGIs below $25k, 0.8% for AGIs $25k-50k, 0.5% for AGIs $50k-75k, 0.6% for AGIs $75k-100k, 0.4% for AGIs $100k-200k, 0.6% for AGIs over 200k)
Ordinary dividends: $2,790 (reported on 14.9% of returns)
Here:
$2,790
State:
$6,933
(% of AGI for various income ranges: 0.8% for AGIs below $25k, 0.2% for AGIs $25k-50k, 0.4% for AGIs $50k-75k, 0.6% for AGIs $75k-100k, 0.9% for AGIs $100k-200k, 0.5% for AGIs over 200k)
Net capital gain/loss in AGI: +$6,086 (reported on 10.4% of returns)
Here:
+$6,086
State:
+$14,830
(% of AGI for various income ranges: 0.4% for AGIs $75k-100k, 3.2% for AGIs $100k-200k)
Profit/loss from business: +$11,155 (reported on 16.4% of returns)
Here:
+$11,155
State:
+$12,606
(% of AGI for various income ranges: 10.7% for AGIs below $25k, 3.5% for AGIs $50k-75k, 0.8% for AGIs $75k-100k, 5.5% for AGIs $100k-200k)
Taxable individual retirement arrangement distribution: $14,118 (reported on 8.2% of returns)
20664:
$14,118
Maryland:
$17,065
(% of AGI for various income ranges: 5.6% for AGIs below $25k, 3.5% for AGIs $50k-75k, 3.2% for AGIs $100k-200k)
Total itemized deductions: $26,818 (24% of AGI, reported on 49.3% of returns)
Here:
$26,818
State:
$27,886
Here:
24.2% of AGI
State:
22.8% of AGI
(% of AGI for various income ranges: 16.2% for AGIs below $25k, 20.2% for AGIs $25k-50k, 20.1% for AGIs $50k-75k, 19.7% for AGIs $75k-100k, 21.8% for AGIs $100k-200k, 15.1% for AGIs over 200k)
Charity contributions: $2,967 (reported on 38.8% of returns)
Here:
$2,967
State:
$4,452
(% of AGI for various income ranges: 0.7% for AGIs below $25k, 2.6% for AGIs $25k-50k, 1.4% for AGIs $50k-75k, 1.5% for AGIs $75k-100k, 2.0% for AGIs $100k-200k, 1.2% for AGIs over 200k)
Taxes paid: $11,491 (reported on 49.3% of returns)
20664:
$11,491
State:
$11,690
(% of AGI for various income ranges: 3.1% for AGIs below $25k, 5.4% for AGIs $25k-50k, 7.0% for AGIs $50k-75k, 7.8% for AGIs $75k-100k, 9.5% for AGIs $100k-200k, 9.9% for AGIs over 200k)
Earned income credit: $2,247 (reported on 14.2% of returns)
Here:
$2,247
State:
$2,199
(% of AGI for various income ranges: 6.3% for AGIs below $25k, 0.6% for AGIs $25k-50k)
Percentage of individuals using paid preparers for their 2012 taxes: 53.7%
Here:
54%
State:
52%
(% for various income ranges: 51.2% for AGIs below $25k, 46.9% for AGIs $25k-50k, 57.9% for AGIs $50k-75k, 56.2% for AGIs $75k-100k, 60.0% for AGIs $100k-200k, 75.0% for AGIs over 200k)
Averages for the 2004 tax year for zip code 20664, filed in 2005:
Average Adjusted Gross Income (AGI) in 2004: $57,471 (Individual Income Tax Returns)
Here:
$57,471
State:
$60,339
Salary/wage: $44,637 (reported on 86.0% of returns)
Here:
$44,637
State:
$52,211
(% of AGI for various income ranges: 148.2% for AGIs below $10k, 76.2% for AGIs $10k-25k, 81.5% for AGIs $25k-50k, 81.6% for AGIs $50k-75k, 84.2% for AGIs $75k-100k, 48.7% for AGIs over 100k)
Taxable interest for individuals: $2,555 (reported on 42.5% of returns)
This zip code:
$2,555
Maryland:
$1,701
(% of AGI for various income ranges: 7.0% for AGIs below $10k, 2.3% for AGIs $10k-25k, 1.2% for AGIs $25k-50k, 1.5% for AGIs $50k-75k, 1.4% for AGIs $75k-100k, 2.2% for AGIs over 100k)
Taxable dividends: $4,463 (reported on 16.4% of returns)
Here:
$4,463
State:
$4,235
(% of AGI for various income ranges: 3.5% for AGIs below $10k, 1.0% for AGIs $10k-25k, 0.6% for AGIs $25k-50k, 0.5% for AGIs $50k-75k, 0.4% for AGIs $75k-100k, 2.0% for AGIs over 100k)
Net capital gain/loss: +$12,883 (reported on 13.5% of returns)
Here:
+$12,883
State:
+$15,888
(% of AGI for various income ranges: -1.5% for AGIs below $10k, -0.1% for AGIs $10k-25k, 0.3% for AGIs $25k-50k, 0.0% for AGIs $50k-75k, 1.3% for AGIs $75k-100k, 6.0% for AGIs over 100k)
Profit/loss from business: +$7,287 (reported on 14.2% of returns)
Here:
+$7,287
State:
+$12,221
(% of AGI for various income ranges: 0.9% for AGIs below $10k, 3.4% for AGIs $10k-25k, 2.0% for AGIs $25k-50k, 0.1% for AGIs $50k-75k, 0.3% for AGIs $75k-100k, 2.5% for AGIs over 100k)
IRA payment deduction: $3,600 (reported on 2.3% of returns)
20664:
$3,600
Maryland:
$2,968
Total itemized deductions: $25,015 (25% of AGI, reported on 45.4% of returns)
Here:
$25,015
State:
$22,960
Here:
25.0% of AGI
State:
23.3% of AGI
(% of AGI for various income ranges: 35.9% for AGIs below $10k, 14.0% for AGIs $10k-25k, 18.2% for AGIs $25k-50k, 22.3% for AGIs $50k-75k, 20.9% for AGIs $75k-100k, 19.7% for AGIs over 100k)
Charity contributions deductions: $3,151 (3% of AGI, reported on 40.0% of returns)
Here:
$3,151
State:
$4,031
Here:
3.2% of AGI
State:
3.9% of AGI
(% of AGI for various income ranges: 1.7% for AGIs $10k-25k, 2.3% for AGIs $25k-50k, 2.8% for AGIs $50k-75k, 2.3% for AGIs $75k-100k, 2.1% for AGIs over 100k)
Total tax: $10,122 (reported on 77.5% of returns)
20664:
$10,122
State:
$10,167
(% of AGI for various income ranges: 4.4% for AGIs below $10k, 4.3% for AGIs $10k-25k, 6.5% for AGIs $25k-50k, 8.5% for AGIs $50k-75k, 9.4% for AGIs $75k-100k, 20.7% for AGIs over 100k)
Earned income credit: $1,792 (reported on 13.8% of returns)
Here:
$1,792
State:
$1,700
Percentage of individuals using paid preparers for their 2004 taxes: 60.0%
Here:
60%
State:
55%
(% for various income ranges: 51.4% for AGIs below $10k, 61.6% for AGIs $10k-25k, 57.7% for AGIs $25k-50k, 55.1% for AGIs $50k-75k, 70.7% for AGIs $75k-100k, 73.5% for AGIs over 100k)
Household received Food Stamps/SNAP in the past 12 months: 77 Household did not receive Food Stamps/SNAP in the past 12 months: 1,005
Women who had a birth in the past 12 months: 37 (38 now married, 0 unmarried) Women who did not have a birth in the past 12 months: 357 (268 now married, 88 unmarried)
Housing units in zip code 20664 with a mortgage: 544 (79 second mortgage, 60 both second mortgage and home equity loan) Median monthly owner costs for units with a mortgage: $2,071 Median monthly owner costs for units without a mortgage: $760
Residents with income below the poverty level in 2022:
This zip code:
7.3%
Whole state:
9.6%
Residents with income below 50% of the poverty level in 2022:
This zip code:
0.2%
Whole state:
4.7%
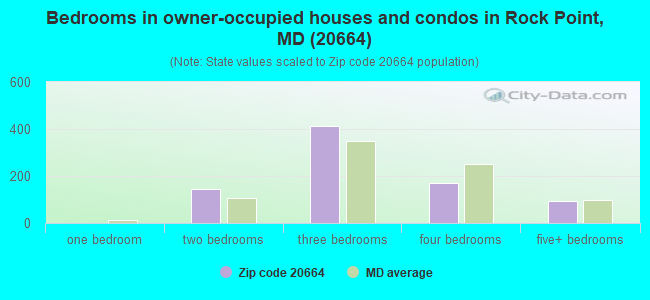
Median number of rooms in houses and condos:
Here:
7.0
State:
7.3
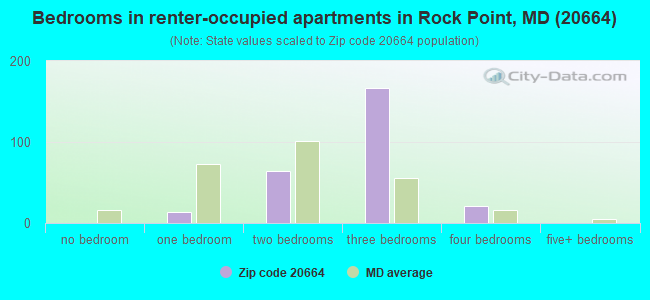
Median number of rooms in apartments:
Here:
5.8
State:
4.2
Notable locations in this zip code not listed on our city pages
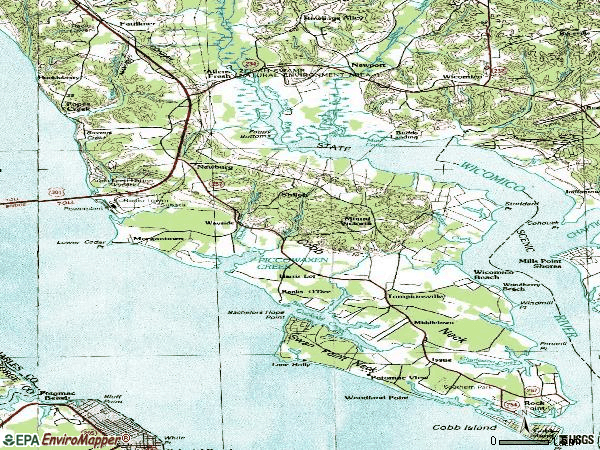
Notable locations in zip code 20664: Aqua-Land Marina (A), Banks O'Dee (B), Lancaster Wharf (C), Harris Lot (D), Issue (E), Woodland Point (F), Wayside (G), Laidlow Ferry (H), Camp Saint Charles (I), Our Ladys Manor (J), Morgantown Generating Plant (K), Newburg Volunteer Rescue Squad and Fire Department Station 14 (L). Display/hide their locations on the map
Streams, rivers, and creeks: Port Tobacco River (A), Swindler Creek (B), Ellenboro Hill Run (C), Drinks Run (D), Ditchley Prong (E), Pasquahanza Creek (F), Mill Run (G), Middletown Branch (H), Piccowaxen Creek (I). Display/hide their locations on the map
Size of family households: 401 2-persons, 174 3-persons, 191 4-persons, 40 5-persons, 10 6-persons
Size of nonfamily households: 238 1-person, 32 2-persons
577 married couples with children.
201 single-parent households (94 men, 107 women).
91.0% of residents of 20664 zip code speak English at home.
6.6% of residents speak Spanish at home (75% very well, 25% not at all).
1.5% of residents speak Asian or Pacific Island language at home (100% very well).
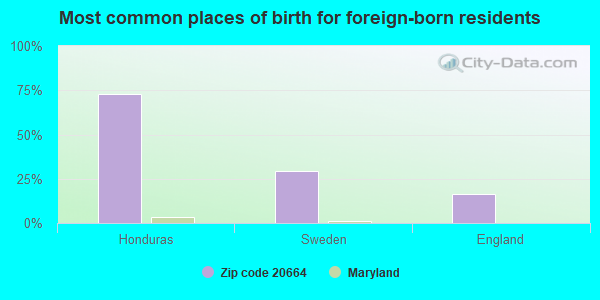
Foreign born population: 151 (5.4%) (27.6% of them are naturalized citizens)
This zip code:
5.4%
Whole state:
16.7%
73%Honduras
29%Sweden
17%England
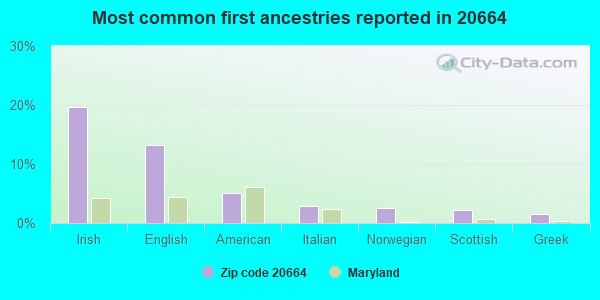
20%Irish
13%English
5%American
3%Italian
2%Norwegian
2%Scottish
2%Greek
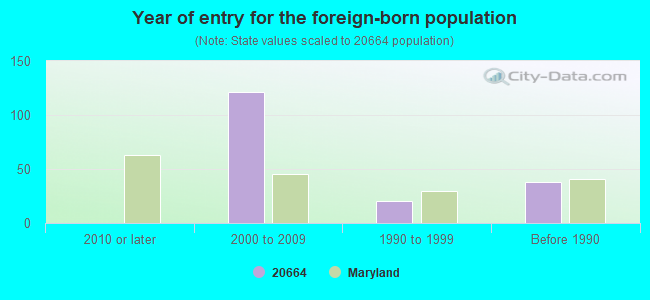
Year of entry for the foreign-born population
02010 or later
1212000 to 2009
201990 to 1999
38Before 1990
Facilities with environmental interests located in this zip code:
PEPCO MORGANTOWN GENERATING STATION (12620 CRAIN HIGHWAY in NEWBURG, MD)
AIR MAJOR (AIRS/AFS) AIR MINOR (AIRS/AFS) AIR PROGRAM (Clean Air Markets Division Business System) OIL CONTROL (Facility Response Plan for oil discharge) STATE MASTER (Maryland Permits tracking) - NPDES MAJOR, OIL CONTROL STATE MASTER (Maryland Permits tracking) - OIL CONTROL STATE MASTER (Maryland Air Emissions Database) - AIR MAJOR STATE MASTER (Maryland Air Emissions Database) - AIR MINOR COMPLIANCE ACTIVITY (Tracking inspections of insecticide, fungicide, and rodenticide, and toxic substances) CRITERIA AND HAZARDOUS AIR POLLUTANT INVENTORY (Inventory of air pollution sources) National Pollutant Discharge Elimination System MAJOR (Tracking pollutant discharge elimination systems) - permit HAZARDOUS WASTE BIENNIAL REPORTER (Resource Conservation and Recovery Act (tracking hazardous waste)) Large Quantity Generators, more that 1000 kg of hazardous waste/month (Resource Conservation and Recovery Act (tracking hazardous waste)) - notification USED OIL PROGRAM (Resource Conservation and Recovery Act (tracking hazardous waste)) TRI REPORTER (Tracking of toxic chemicals releasing facilities) Business SIC classification: BITUMINOUS COAL AND LIGNITE SURFACE MINING; INDUSTRIAL ORGANIC CHEMICALS; ELECTRIC SERVICES; ELECTRIC AND OTHER SERVICES COMBINED Business NAICS classification: FOSSIL FUEL ELECTRIC POWER GENERATION.; FOSSIL FUEL ELECTRIC POWER GENERATION. Organizations: MIRANT MID-ATLANTIC, LLC (CONTACT/GENERAL)
, MIRANT MID ATLANTIC LLC (CONTACT/OWNER)
, MIRANT MID-ATLANTIC, LLC (OWNER/OPERATOR)
Alternative names: MIRANT, MIRANT - MORGANTOWN, MIRANT - MORGANTOWN GEN STA, MIRANT- MORGANTOWN STATION, MORGANTOWN BOTTOM ASH PLANT, OAK MOUNTAIN PRODUCTS, PEPCO'S MORGANTOWN SWITCHYARD FACILITY, POTOMAC ELECTRIC POWER CO., POTOMAC ELECTRIC POWER COMPANY-NEW BERG, POTOMAC ELECTRIC POWER COMPANY (PEPCO), SOUTHERN ENERGY-MORGANTOWN GEN STA, (WWTP)
PICCOWAXEN MIDDLE SCHOOL (12834 ROCK POINT ROAD in NEWBURG, MD)
AIR MINOR (AIRS/AFS) (Geographic Names Information System) STATE MASTER (Maryland Air Emissions Database) - AIR MINOR (National Center for Education Statistics) - STATE ID-080503 Business SIC classification: ELEMENTARY AND SECONDARY SCHOOLS Organizations: CHARLES COUNTY BOARD OF EDUCATION (SCHOOL DISTRICT)
MATTHEWS MANOR (15460 MATTHEW MANOR RD in NEWBURG, MD)
(Integrated Compliance Information System) - ICIS-03-2000-0418, FORMAL ENFORCEMENT ACTION COMMUNITY WATER SYSTEM (SDWIS) - SDWIS-MD0080027 1, WATER TREATMENT PLANT
PICCOWAXEN MIDDLE SCHOOL WWTP (ROUTE 257 ROCK POINT ROAD in NEWBURG, MD)
STATE MASTER (Maryland Permits tracking) - NPDES NON-MAJOR National Pollutant Discharge Elimination System NON-MAJOR (Tracking pollutant discharge elimination systems) - permit Business SIC classification: ELEMENTARY AND SECONDARY SCHOOLS Organizations: BOARD OF EDUCATION CHARLES CO. (CONTACT/OWNER)
Alternative names: CHARLES CO. BOARD OF EDUCATION
CLIFTON ON THE POTOMAC WWTP (CLIFFTON DRIVE AT INGLESIDE DRIVE in NEWBURG, MD)
STATE MASTER (Maryland Permits tracking) - NPDES NON-MAJOR National Pollutant Discharge Elimination System NON-MAJOR (Tracking pollutant discharge elimination systems) - permit Business SIC classification: SEWERAGE SYSTEMS Alternative names: CHARLES COUNTY COMMISSIONERS
MTA HARRY W NICE BRIDGE MAINTENCE (BOX 8 U.S. ROUTE 301 SOUTH in NEWBURG, MD)
AIR MINOR (AIRS/AFS) STATE MASTER (Maryland Air Emissions Database) - AIR MINOR Business SIC classification: GASOLINE SERVICE STATIONS; REGULATION AND ADMINISTRATION OF TRANSPORTATION PROGRAMS
POTOMAC ELECTRIC POWER COMPANY, INC. (P.O. BOX 218 in NEWBURG, MD)
COMPLIANCE ACTIVITY (Tracking inspections of insecticide, fungicide, and rodenticide, and toxic substances) Business SIC classification: ELECTRIC SERVICES Alternative names: POTOMAC ELECTRIC POWER COMPANY (PEPCO)
TRI REPORTER (Tracking of toxic chemicals releasing facilities) Business SIC classification: PRODUCTS OF PETROLEUM AND COAL Alternative names: BMA SERVICES L.L.C., BMA SERVICES L.L.C. MORGANTOWN PLANT
Housing units lacking complete plumbing facilities: 5.8% Housing units lacking complete kitchen facilities: 6.3%
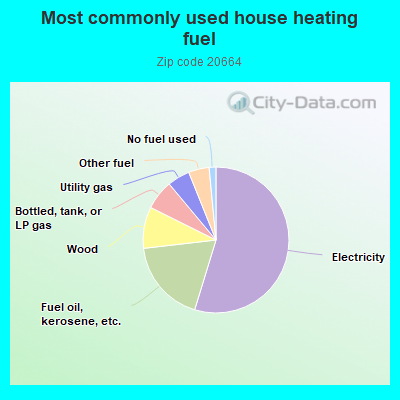
54.9%Electricity
18.5%Fuel oil, kerosene, etc.
9.2%Wood
6.6%Bottled, tank, or LP gas
5.0%Utility gas
4.6%Other fuel
1.5%No fuel used
Population in 1990: 3,612.
Place of birth for U.S.-born residents:
This state: 1,747
Northeast: 157
Midwest: 168
South: 443
West: 57
68% of the 20664 zip code residents lived in the same house 5 years ago. Out of people who lived in different houses, 67% lived in this county. Out of people who lived in different counties, 50% lived in Maryland.
93% of the 20664 zip code residents lived in the same house 1 year ago. Out of people who lived in different houses, 43% moved from this county. Out of people who lived in different houses, 18% moved from different county within same state. Out of people who lived in different houses, 40% moved from different state.
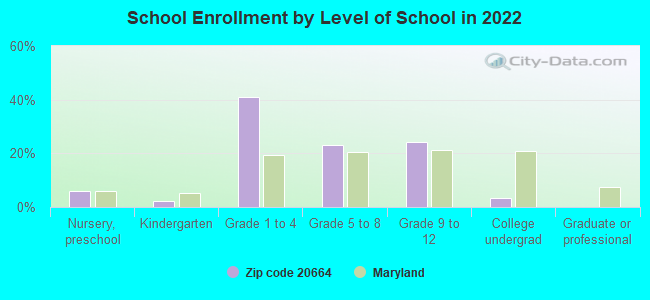
Private vs. public school enrollment:
Students in private schools in grades 1 to 8 (elementary and middle school): 3
Here:
0.8%
Maryland:
15.2%
Students in private schools in grades 9 to 12 (high school): 2
Here:
1.9%
Maryland:
14.4%
Students in private undergraduate colleges:
Here:
0.0%
Maryland:
20.2%
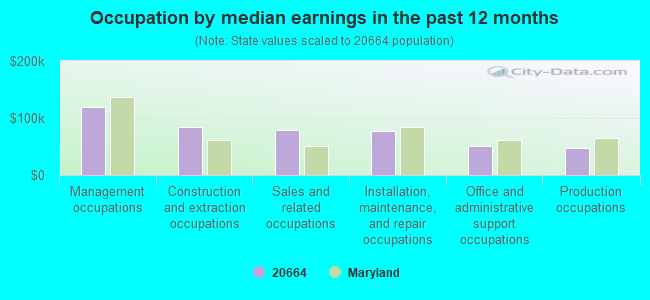
Occupation by median earnings in the past 12 months ($)
119,869Management occupations
84,516Construction and extraction occupations
78,503Sales and related occupations
77,964Installation, maintenance, and repair occupations
50,733Office and administrative support occupations
47,961Production occupations
Companies with federal contracts located in this zip code:
NEWBURG SERVICE CENTER, INC (12095 CRAIN HWY in NEWBURG, MD; small business)
$4,940 with Army for Generators and Generators Sets, Electrical. Signed on 2002-09-30. Completion date: 2002-10-31.
BARBER, KEITH CONSTRUCTION INC (14150 RIVER RD in NEWBURG, MD; small business)
$1,407 with Navy for Maintenance, Repair or Alteration of Real Property -- Government-Owned Government-Operated (GOGO) R&D Facilities. Taking place in VA. Signed on 2001-03-13. Completion date: 1999-08-21.
Top industries in this zip code by the number of employees in 2005:
Utilities: Fossil Fuel Electric Power Generation (100-249 employees: 1 establishment)
Accommodation and Food Services: Full-Service Restaurants (20-49: 1, 10-19: 2)
Accommodation and Food Services: Limited-Service Restaurants (10-19: 1)
Professional, Scientific, and Technical Services: Computer Systems Design Services (10-19: 1)
Construction: New Single-Family Housing Construction (except Operative Builders) (10-19: 1)
Other Services (except Public Administration): Cemeteries and Crematories (10-19: 1)
Wholesale Trade: Sporting and Recreational Goods and Supplies Merchant Wholesalers (10-19: 1)
People in group quarters in 2010:
10 people in group homes for juveniles (non-correctional)
People in group quarters in 2000:
5 people in religious group quarters
Fatal accident statistics in 2013:
Fatal accident count: 1
Vehicles involved in fatal accidents: 2
Fatal accidents caused by drunken drivers: 0
Fatalities: 1
Persons involved in fatal accidents: 5
Pedestrians involved in fatal accidents: 0
Fatal accident statistics in 2011:
Fatal accident count: 1
Vehicles involved in fatal accidents: 1
Fatal accidents caused by drunken drivers: 1
Fatalities: 1
Persons involved in fatal accidents: 2
Pedestrians involved in fatal accidents: 0
Home Mortgage Disclosure Act Aggregated Statistics For Year 2009 (Based on 2 partial tracts)
A) FHA, FSA/RHS & VA Home Purchase Loans
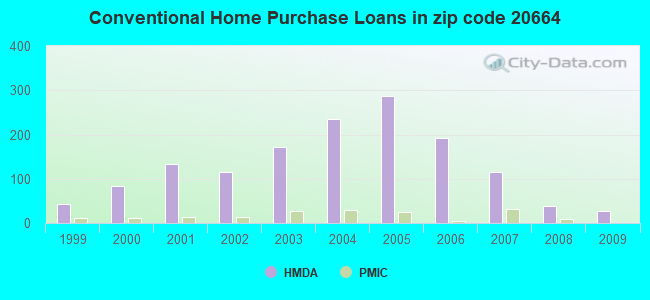
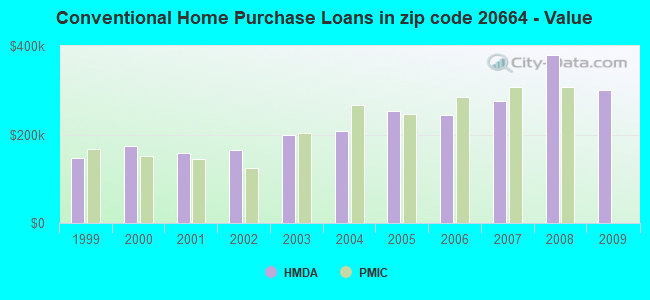
B) Conventional Home Purchase Loans
C) Refinancings
D) Home Improvement Loans
F) Non-occupant Loans on < 5 Family Dwellings (A B C & D)
G) Loans On Manufactured Home Dwelling (A B C & D)
Number
Average Value
Number
Average Value
Number
Average Value
Number
Average Value
Number
Average Value
Number
Average Value
LOANS ORIGINATED
42
$233,521
26
$299,955
233
$267,459
15
$139,213
44
$333,130
2
$153,425
APPLICATIONS APPROVED, NOT ACCEPTED
3
$326,230
2
$91,250
26
$281,196
0
$0
5
$168,928
0
$0
APPLICATIONS DENIED
8
$253,151
5
$275,842
113
$282,954
15
$68,691
5
$298,130
0
$0
APPLICATIONS WITHDRAWN
10
$278,911
6
$259,477
45
$287,972
3
$290,700
2
$359,335
0
$0
FILES CLOSED FOR INCOMPLETENESS
2
$246,285
0
$0
16
$279,496
3
$134,043
2
$118,705
0
$0
Aggregated Statistics For Year 2008 (Based on 2 partial tracts)
A) FHA, FSA/RHS & VA Home Purchase Loans
B) Conventional Home Purchase Loans
C) Refinancings
D) Home Improvement Loans
F) Non-occupant Loans on < 5 Family Dwellings (A B C & D)
Number
Average Value
Number
Average Value
Number
Average Value
Number
Average Value
Number
Average Value
LOANS ORIGINATED
36
$294,020
39
$379,194
178
$254,753
21
$135,275
29
$289,029
APPLICATIONS APPROVED, NOT ACCEPTED
3
$415,057
3
$206,180
19
$250,240
2
$113,050
2
$113,050
APPLICATIONS DENIED
5
$302,328
15
$578,601
87
$314,461
26
$110,131
15
$265,613
APPLICATIONS WITHDRAWN
6
$256,247
13
$245,232
37
$289,696
10
$114,019
5
$172,482
FILES CLOSED FOR INCOMPLETENESS
0
$0
0
$0
15
$310,834
2
$28,260
0
$0
Aggregated Statistics For Year 2007 (Based on 2 partial tracts)
A) FHA, FSA/RHS & VA Home Purchase Loans
B) Conventional Home Purchase Loans
C) Refinancings
D) Home Improvement Loans
F) Non-occupant Loans on < 5 Family Dwellings (A B C & D)
G) Loans On Manufactured Home Dwelling (A B C & D)
Number
Average Value
Number
Average Value
Number
Average Value
Number
Average Value
Number
Average Value
Number
Average Value
LOANS ORIGINATED
21
$284,009
116
$274,731
247
$258,851
50
$106,558
40
$280,929
0
$0
APPLICATIONS APPROVED, NOT ACCEPTED
0
$0
18
$340,855
39
$262,500
10
$86,241
8
$248,105
2
$67,020
APPLICATIONS DENIED
6
$265,398
21
$293,238
197
$291,528
31
$87,366
19
$290,275
2
$67,020
APPLICATIONS WITHDRAWN
5
$249,680
16
$216,208
68
$268,684
5
$197,352
6
$247,363
0
$0
FILES CLOSED FOR INCOMPLETENESS
2
$172,000
5
$82,688
26
$284,675
3
$242,250
3
$166,883
0
$0
Aggregated Statistics For Year 2006 (Based on 2 partial tracts)
A) FHA, FSA/RHS & VA Home Purchase Loans
B) Conventional Home Purchase Loans
C) Refinancings
D) Home Improvement Loans
F) Non-occupant Loans on < 5 Family Dwellings (A B C & D)
Number
Average Value
Number
Average Value
Number
Average Value
Number
Average Value
Number
Average Value
LOANS ORIGINATED
10
$263,245
191
$243,518
428
$210,135
66
$72,773
42
$237,982
APPLICATIONS APPROVED, NOT ACCEPTED
0
$0
23
$280,308
53
$241,884
10
$138,890
3
$299,850
APPLICATIONS DENIED
5
$225,454
39
$200,715
170
$251,189
29
$100,241
8
$202,279
APPLICATIONS WITHDRAWN
2
$141,315
15
$254,201
147
$277,264
11
$159,005
10
$218,509
FILES CLOSED FOR INCOMPLETENESS
0
$0
10
$280,849
37
$197,248
2
$194,605
3
$200,260
Aggregated Statistics For Year 2005 (Based on 2 partial tracts)
A) FHA, FSA/RHS & VA Home Purchase Loans
B) Conventional Home Purchase Loans
C) Refinancings
D) Home Improvement Loans
F) Non-occupant Loans on < 5 Family Dwellings (A B C & D)
G) Loans On Manufactured Home Dwelling (A B C & D)
Number
Average Value
Number
Average Value
Number
Average Value
Number
Average Value
Number
Average Value
Number
Average Value
LOANS ORIGINATED
11
$251,940
286
$253,442
465
$223,228
61
$108,417
69
$242,648
0
$0
APPLICATIONS APPROVED, NOT ACCEPTED
2
$197,030
18
$282,984
65
$188,309
11
$108,058
10
$317,024
0
$0
APPLICATIONS DENIED
0
$0
55
$212,593
157
$209,631
37
$68,310
11
$204,812
2
$15,340
APPLICATIONS WITHDRAWN
3
$158,270
45
$265,685
160
$226,847
13
$144,605
15
$228,469
5
$203,812
FILES CLOSED FOR INCOMPLETENESS
0
$0
6
$114,935
40
$210,152
3
$158,810
3
$55,450
2
$218,025
Aggregated Statistics For Year 2004 (Based on 2 partial tracts)
A) FHA, FSA/RHS & VA Home Purchase Loans
B) Conventional Home Purchase Loans
C) Refinancings
D) Home Improvement Loans
F) Non-occupant Loans on < 5 Family Dwellings (A B C & D)
G) Loans On Manufactured Home Dwelling (A B C & D)
Number
Average Value
Number
Average Value
Number
Average Value
Number
Average Value
Number
Average Value
Number
Average Value
LOANS ORIGINATED
15
$187,771
234
$208,335
331
$191,980
52
$91,185
58
$208,808
0
$0
APPLICATIONS APPROVED, NOT ACCEPTED
0
$0
19
$150,450
42
$157,116
13
$61,991
10
$148,742
0
$0
APPLICATIONS DENIED
5
$171,512
34
$230,470
134
$174,456
29
$47,058
3
$156,117
2
$107,395
APPLICATIONS WITHDRAWN
3
$165,807
18
$210,399
147
$190,054
15
$32,085
3
$202,953
0
$0
FILES CLOSED FOR INCOMPLETENESS
0
$0
6
$299,045
23
$203,771
0
$0
0
$0
0
$0
Aggregated Statistics For Year 2003 (Based on 2 partial tracts)
A) FHA, FSA/RHS & VA Home Purchase Loans
B) Conventional Home Purchase Loans
C) Refinancings
D) Home Improvement Loans
F) Non-occupant Loans on < 5 Family Dwellings (A B C & D)
Number
Average Value
Number
Average Value
Number
Average Value
Number
Average Value
Number
Average Value
LOANS ORIGINATED
39
$158,933
171
$198,418
630
$159,229
21
$29,378
60
$162,926
APPLICATIONS APPROVED, NOT ACCEPTED
2
$109,015
13
$212,435
57
$146,880
8
$32,099
3
$290,163
APPLICATIONS DENIED
2
$104,170
10
$139,859
115
$139,297
16
$25,133
3
$69,983
APPLICATIONS WITHDRAWN
13
$153,798
11
$195,709
115
$139,522
3
$8,077
3
$193,260
FILES CLOSED FOR INCOMPLETENESS
2
$130,815
0
$0
18
$132,609
2
$40,375
0
$0
Aggregated Statistics For Year 2002 (Based on 2 partial tracts)
A) FHA, FSA/RHS & VA Home Purchase Loans
B) Conventional Home Purchase Loans
C) Refinancings
D) Home Improvement Loans
F) Non-occupant Loans on < 5 Family Dwellings (A B C & D)
Number
Average Value
Number
Average Value
Number
Average Value
Number
Average Value
Number
Average Value
LOANS ORIGINATED
52
$135,753
115
$164,056
323
$158,260
18
$18,662
34
$142,215
APPLICATIONS APPROVED, NOT ACCEPTED
5
$193,800
10
$119,025
27
$147,084
3
$24,763
5
$162,470
APPLICATIONS DENIED
3
$125,970
10
$167,960
82
$121,893
16
$34,823
10
$114,827
APPLICATIONS WITHDRAWN
6
$167,153
11
$104,681
81
$148,480
0
$0
6
$71,867
FILES CLOSED FOR INCOMPLETENESS
2
$91,250
2
$123,550
10
$113,535
0
$0
0
$0
Aggregated Statistics For Year 2001 (Based on 2 partial tracts)
A) FHA, FSA/RHS & VA Home Purchase Loans
B) Conventional Home Purchase Loans
C) Refinancings
D) Home Improvement Loans
F) Non-occupant Loans on < 5 Family Dwellings (A B C & D)
Number
Average Value
Number
Average Value
Number
Average Value
Number
Average Value
Number
Average Value
LOANS ORIGINATED
37
$137,974
134
$157,595
234
$159,740
24
$22,879
27
$122,979
APPLICATIONS APPROVED, NOT ACCEPTED
3
$121,663
11
$150,489
45
$144,238
5
$21,642
3
$195,953
APPLICATIONS DENIED
0
$0
13
$85,968
90
$135,768
16
$28,868
2
$40,375
APPLICATIONS WITHDRAWN
6
$142,390
13
$131,561
86
$145,632
0
$0
6
$137,543
FILES CLOSED FOR INCOMPLETENESS
0
$0
0
$0
8
$149,791
0
$0
0
$0
Aggregated Statistics For Year 2000 (Based on 2 partial tracts)
A) FHA, FSA/RHS & VA Home Purchase Loans
B) Conventional Home Purchase Loans
C) Refinancings
D) Home Improvement Loans
F) Non-occupant Loans on < 5 Family Dwellings (A B C & D)
Number
Average Value
Number
Average Value
Number
Average Value
Number
Average Value
Number
Average Value
LOANS ORIGINATED
37
$112,352
84
$174,632
66
$129,004
37
$18,944
13
$162,618
APPLICATIONS APPROVED, NOT ACCEPTED
2
$121,935
5
$289,408
18
$101,476
5
$113,050
5
$42,958
APPLICATIONS DENIED
2
$90,440
18
$137,634
66
$379,329
27
$20,397
6
$82,635
APPLICATIONS WITHDRAWN
6
$124,625
8
$205,710
37
$86,512
0
$0
2
$28,260
FILES CLOSED FOR INCOMPLETENESS
0
$0
5
$139,212
6
$85,325
2
$104,975
0
$0
Aggregated Statistics For Year 1999 (Based on 1 partial tract)
A) FHA, FSA/RHS & VA Home Purchase Loans
B) Conventional Home Purchase Loans
C) Refinancings
D) Home Improvement Loans
F) Non-occupant Loans on < 5 Family Dwellings (A B C & D)
Detailed PMIC statistics for the following Tracts:8512.00
2002 - 2018 National Fire Incident Reporting System (NFIRS) incidents
According to the data from the years 2002 - 2018 the average number of fire incidents per year is 61. The highest number of fires - 112 took place in 2004, and the least - 21 in 2009. The data has an increasing trend.
When looking into fire subcategories, the most incidents belonged to: Structure Fires (48.0%), and Outside Fires (33.2%).
Fire incident types reported to NFIRS in Zip Code 20664


 Nearest zip codes: 20645, 20622, 20632, 22448, 20611, 20625.


 According to the data from the years 2002 - 2018 the average number of fire incidents per year is 61. The highest number of fires - 112 took place in 2004, and the least - 21 in 2009. The data has an increasing trend.
 When looking into fire subcategories, the most incidents belonged to: Structure Fires (48.0%), and Outside Fires (33.2%).