Charles County, Maryland (MD)
County owner-occupied free and clear houses and condos in 2010: 5,659
County owner-occupied houses and condos in 2000: 32,567
Renter-occupied apartments: 10,897 (it was 9,101 in 2000)
| % of renters here: | 22% |
| State: | 32% |
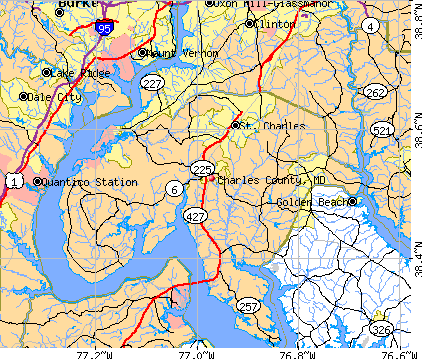
Land area: 461 sq. mi.
Water area: 182.2 sq. mi.
Population density: 369 people per square mile (high).
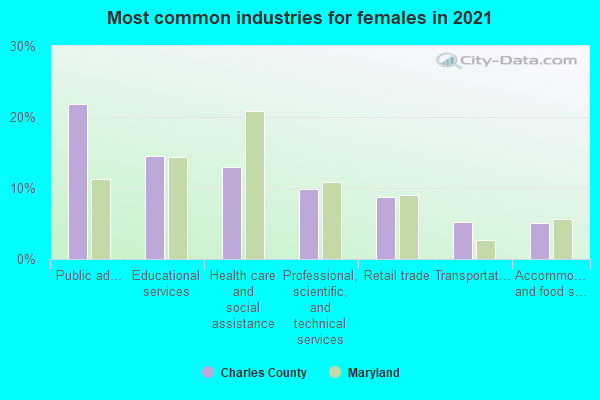
Industries providing employment: Public administration (20.9%), Educational, health and social services (19.0%), Professional, scientific, management, administrative, and waste management services (15.2%).
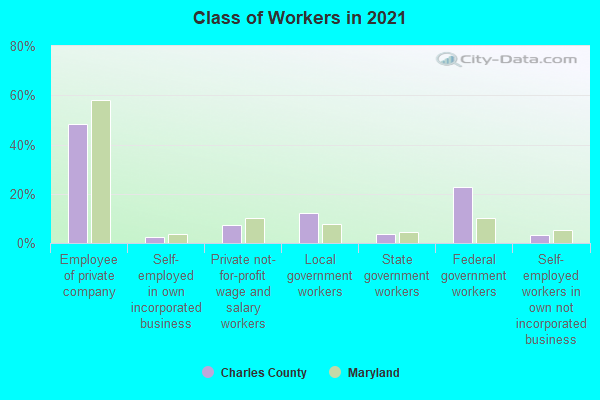
Type of workers:
- Private wage or salary: 59%
- Government: 37%
- Self-employed, not incorporated: 3%
- Unpaid family work: 0%
- OSM Map
- General Map
- Google Map
- MSN Map

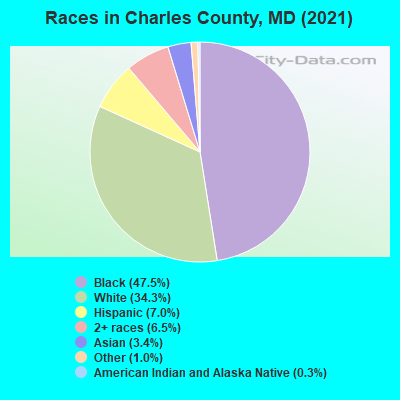
- 84,36649.6%Black Non-Hispanic Alone
- 55,25732.5%White Non-Hispanic Alone
- 12,7547.5%Hispanic or Latino
- 12,2937.2%Two or more races
- 4,9032.9%Asian alone
- 2690.2%American Indian and Alaska Native alone
- 2600.2%Some other race alone
| Median resident age: | 38.3 years |
| Maryland median age: | 39.7 years |
| Males: 82,338 | |
| Females: 87,764 |

 | Wealthiest Black Majority County is Charles County (68 replies) |
| PG County Executive Alsobrooks Running for Senate. Deserves Election? (23 replies) |
| Moving from Florida to Maryland. Where should I live? (18 replies) |
| How is Waldorf, MD? (59 replies) |
| Looking for a working class or middle class Black community in Maryland to move to (24 replies) |
| PG County Trash? (8 replies) |
| Charles County: | 2.0 people |
| Maryland: | 3 people |
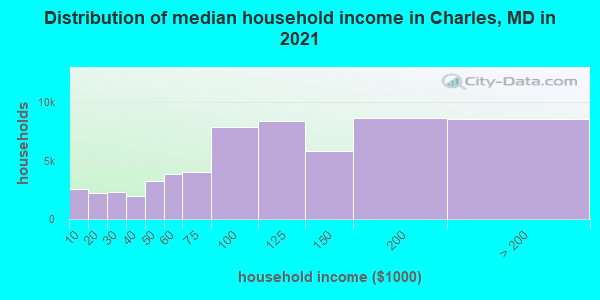
Estimated median household income in 2022: $115,880 ($62,199 in 1999)
| This county: | $115,880 |
| Maryland: | $94,991 |
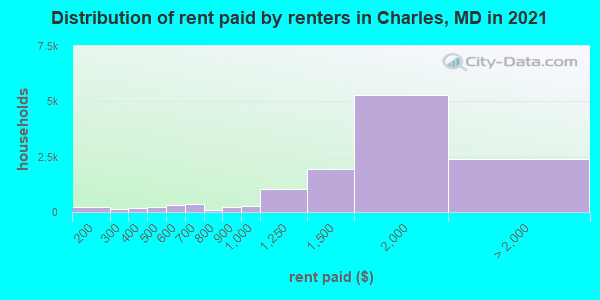
Median contract rent in 2022 for apartments: $1,628 (lower quartile is $994, upper quartile is $2,017)
| This county: | $1628 |
| State: | $1388 |
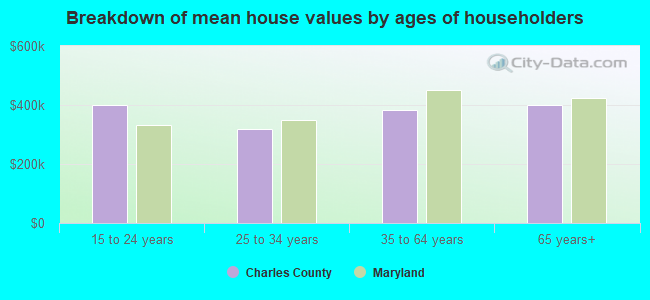
Estimated median house or condo value in 2022: $399,500 (it was $153,500 in 2000)
| Charles: | $399,500 |
| Maryland: | $398,100 |
Mean price in 2022:
Median monthly housing costs for homes and condos with a mortgage: $2,138Detached houses: $448,816
Here: $448,816 State: $526,819 Townhouses or other attached units: $287,336
Here: $287,336 State: $328,305 In 2-unit structures: $223,968
Here: $223,968 State: $346,599 In 3-to-4-unit structures: $232,479
Here: $232,479 State: $295,378 In 5-or-more-unit structures: $265,223
Here: $265,223 State: $350,378 Mobile homes: $64,617
Here: $64,617 State: $89,353 Occupied boats, RVs, vans, etc.: $454,094
Here: $454,094 State: $254,500
Median monthly housing costs for units without a mortgage: $699
Institutionalized population: 987
Crime in 2020 (reported by the sheriff's office or county police, not the county total):
- Murders: 6
- Rapes: 36
- Robberies: 48
- Assaults: 183
- Burglaries: 163
- Thefts: 811
- Auto thefts: 98
Crime in 2019 (reported by the sheriff's office or county police, not the county total):
- Murders: 5
- Rapes: 64
- Robberies: 118
- Assaults: 352
- Burglaries: 284
- Thefts: 1778
- Auto thefts: 151
Health of residents in Charles County based on CDC Behavioral Risk Factor Surveillance System Survey Questionnaires from 2003 to 2012:
General health status score of residents in this county from 1 (poor) to 5 (excellent) is 3.6. This is better than average.74.9% of residents exercised in the past month. This is about average.
43.2% of residents smoked 100+ cigarettes in their lives. This is about average.
81.4% of adult residents drank alcohol in the past 30 days. This is more than average.
74.1% of residents visited a dentist within the past year. This is about average.
Average weight of males is 203 pounds. This is more than average.
Average weight of females is 165 pounds. This is about average.
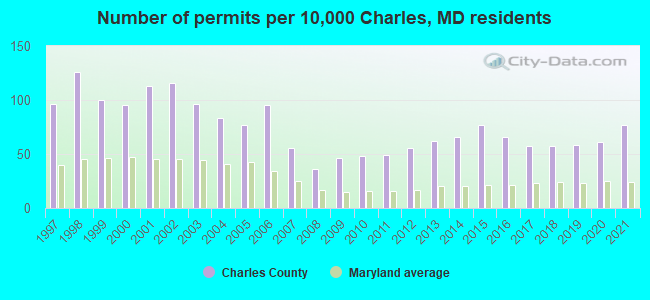
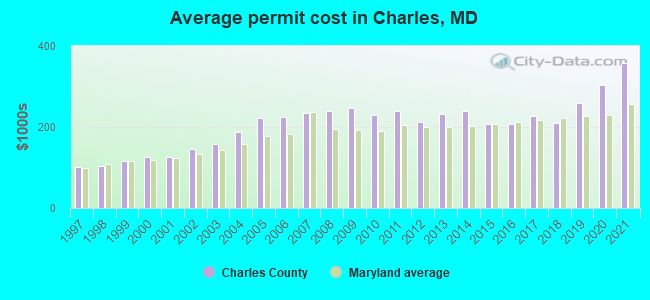
Single-family new house construction building permits:
- 2022: 990 buildings, average cost: $365,600
- 2021: 931 buildings, average cost: $358,500
- 2020: 735 buildings, average cost: $303,800
- 2019: 696 buildings, average cost: $258,800
- 2018: 686 buildings, average cost: $210,300
- 2017: 682 buildings, average cost: $227,700
- 2016: 797 buildings, average cost: $206,700
- 2015: 926 buildings, average cost: $206,900
- 2014: 790 buildings, average cost: $239,500
- 2013: 742 buildings, average cost: $231,200
- 2012: 671 buildings, average cost: $212,600
- 2011: 585 buildings, average cost: $239,000
- 2010: 576 buildings, average cost: $228,500
- 2009: 558 buildings, average cost: $245,800
- 2008: 435 buildings, average cost: $239,300
- 2007: 671 buildings, average cost: $234,500
- 2006: 1146 buildings, average cost: $224,000
- 2005: 931 buildings, average cost: $221,300
- 2004: 1000 buildings, average cost: $187,600
- 2003: 1152 buildings, average cost: $158,000
- 2002: 1404 buildings, average cost: $145,300
- 2001: 1368 buildings, average cost: $127,200
- 2000: 1143 buildings, average cost: $124,900
- 1999: 1211 buildings, average cost: $114,500
- 1998: 1517 buildings, average cost: $103,700
- 1997: 1155 buildings, average cost: $102,200
Median real estate property taxes paid for housing units with mortgages in 2022: $3,946 (1.0%)
Median real estate property taxes paid for housing units with no mortgage in 2022: $3,547 (1.0%)

| Charles County: | 8.5% |
| Maryland: | 9.6% |
Median age of residents in 2022: 38.3 years old
(Males: 36.7 years old, Females: 39.8 years old)
(Median age for: White residents: 47.5 years old, Black residents: 37.7 years old, American Indian residents: 29.3 years old, Asian residents: 46.3 years old, Hispanic or Latino residents: 30.4 years old, Other race residents: 32.9 years old)
Area name: Washington-Arlington-Alexandria, DC-VA-MD HUD Metro FMR Area
Fair market rent in 2006 for a 1-bedroom apartment in Charles County is $1080 a month.
Fair market rent for a 2-bedroom apartment is $1225 a month.
Fair market rent for a 3-bedroom apartment is $1580 a month.
Cities in this county include: St. Charles, Waldorf, District 8, Bryantown, Bennsville, La Plata, Bryans Road, Indian Head, Hughesville, Cobb Island, Potomac Heights.
2023 air pollution in Charles County:
Ozone (1-hour): 0.038 ppm (standard limit: 0.12 ppm). Near U.S. average.
Notable locations in this county outside city limits:
Notable locations in Charles County: Wrights Landing (A), Ant Bar (B), Fork Landing (C), Environmental Center (D), Bestpitch Ferry (E), Between the Dams (F), Cabin Creek (G), Church Creek Fire Tower (H), Beulah Landfill (I), Drawbridge (J), Eagle Hall (K), Mother Hen Farms (L), Cambridge Country Club (M), Ennalls Wharf (N), Twin Cities Wastewater Treatment Plant (O), Hurts Wharf (P), Lot Lane (Q), New Bridge (R), Old Field (S), Out Back (T). Display/hide their locations on the map
Churches in Charles County include: Wesley Church (A), Antioch Church (B), Beckwith Church (C), Bethany United Methodist Church (D), Chateau Church (E), Cokesbury Church (F), Friendship Church (G), Hard Shell Church (H), Hawkeye Church (I). Display/hide their locations on the map
Cemeteries: Scotts Chapel Cemetery (1), Insley Cemetery (2), Salem Cemetery (3), Saint Pauls Cemetery (4), Trinity Cemetery (5), Gootee Cemetery (6), Saint Mary Star of the Sea Cemetery (7). Display/hide their locations on the map
Lakes, reservoirs, and swamps: Hog Rooting Pond (A), Cattail Pond (B), Lans Pond (C), Blackwater Pond (D), Island Pond (E), Round Pond (F), Raymond Pond (G), Wolfpit Pond (H). Display/hide their locations on the map
Streams, rivers, and creeks: Marshyhope Creek (A), Bachelor Creek (B), Back Creek (C), Backgarden Creek (D), Beard Creek (E), Becky Taylor Branch (F), Birch Dam Creek (G), Blinkhorn Creek (H), Blue Point Branch (I). Display/hide their locations on the map
Parks in Charles County include: Blackwater National Wildlife Refuge (1), Le Compte Wildlife Management Area (2), Fishing Bay Wildlife Management Area (3), Taylors Island Wildlife Management Area (4), Christ Rock Park (5). Display/hide their locations on the map
Beach: Cedar Grove Beach (A). Display/hide its location on the map
Neighboring counties: Boone County, Kentucky  , Pendleton County, West Virginia , Henry County, Missouri , St. Charles County, Missouri .
| Here: | 2.1% |
| Maryland: | 2.0% |
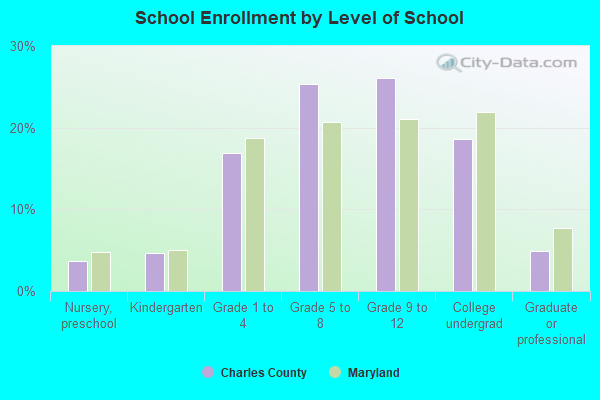
Current college students: 6,299
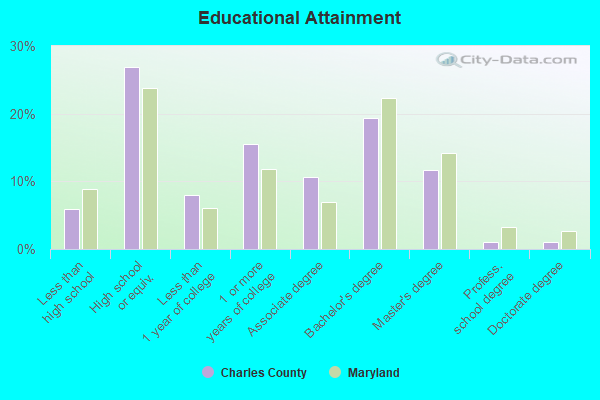
People 25 years of age or older with a high school degree or higher: 95.2%
People 25 years of age or older with a bachelor's degree or higher: 32.5%
Number of foreign born residents: 14,125 (58.5% naturalized citizens)
| Charles County: | 8.3% |
| Whole state: | 16.7% |
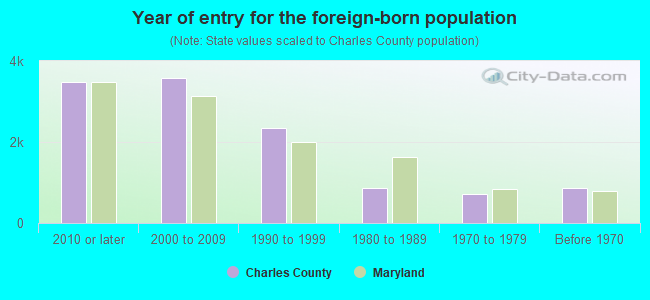
- Year of entry for the foreign-born population
- 4,6192010 or later
- 3,6602000 to 2009
- 2,1951990 to 1999
- 8681980 to 1989
- 7201970 to 1979
- 873Before 1970
Mean travel time to work (commute): + minutes
Percentage of county residents living and working in this county: 72.4%
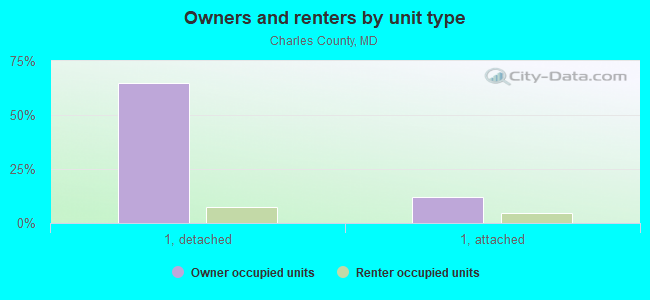
Housing units in structures:
- One, detached: 43,306
- One, attached: 12,682
- Two: 646
- 3 or 4: 243
- 5 to 9: 1,080
- 10 to 19: 3,304
- 20 to 49: 619
- 50 or more: 1,306
- Mobile homes: 577
Housing units in Charles County with a mortgage: 41,323 (2,691 second mortgage, 144 home equity loan, 1,678 both second mortgage and home equity loan)
Houses without a mortgage: 730
| Here: | 5.3% with mortgage |
| State: | 97.5% with mortgage |
Religion statistics for Charles County
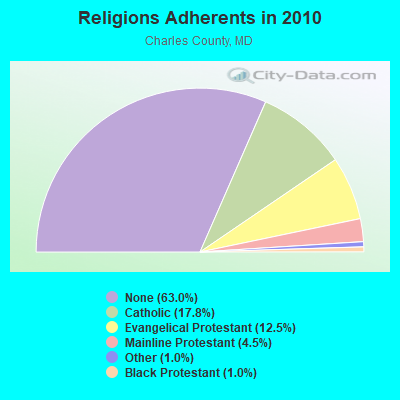
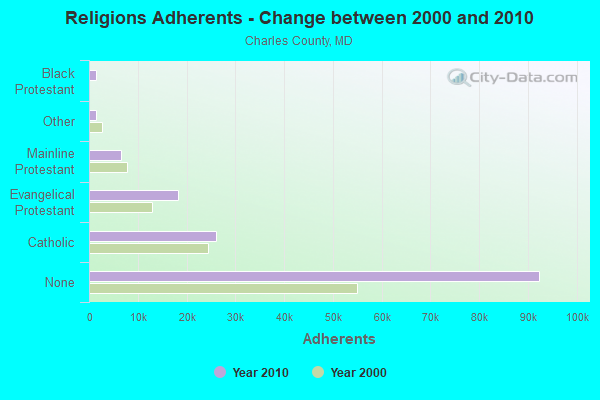
| Religion | Adherents | Congregations |
|---|---|---|
| Catholic | 26,146 | 12 |
| Evangelical Protestant | 18,323 | 72 |
| Mainline Protestant | 6,593 | 28 |
| Other | 1,512 | 7 |
| Black Protestant | 1,489 | 9 |
| Orthodox | 100 | 1 |
| None | 92,388 | - |
Source: Clifford Grammich, Kirk Hadaway, Richard Houseal, Dale E.Jones, Alexei Krindatch, Richie Stanley and Richard H.Taylor. 2012. 2010 U.S.Religion Census: Religious Congregations & Membership Study. Association of Statisticians of American Religious Bodies. Jones, Dale E., et al. 2002. Congregations and Membership in the United States 2000. Nashville, TN: Glenmary Research Center.
Food Environment Statistics:
| Charles County: | 1.57 / 10,000 pop. |
| State: | 1.96 / 10,000 pop. |
| Here: | 0.14 / 10,000 pop. |
| Maryland: | 0.07 / 10,000 pop. |
| This county: | 1.14 / 10,000 pop. |
| Maryland: | 1.22 / 10,000 pop. |
| Charles County: | 2.21 / 10,000 pop. |
| Maryland: | 2.05 / 10,000 pop. |
| This county: | 4.78 / 10,000 pop. |
| State: | 5.40 / 10,000 pop. |
| Charles County: | 9.2% |
| Maryland: | 9.1% |
| Charles County: | 31.9% |
| State: | 26.7% |
| Here: | 13.0% |
| State: | 15.5% |
Agriculture in Charles County:
Average size of farms: 125 acresAverage value of agricultural products sold per farm: $15,272
Average value of crops sold per acre for harvested cropland: $208.08
The value of nursery, greenhouse, floriculture, and sod as a percentage of the total market value of agricultural products sold: 20.40%
The value of livestock, poultry, and their products as a percentage of the total market value of agricultural products sold: 25.65%
Average total farm production expenses per farm: $17,049
Harvested cropland as a percentage of land in farms: 43.82%
Irrigated harvested cropland as a percentage of land in farms: 2.29%
Average market value of all machinery and equipment per farm: $39,723
The percentage of farms operated by a family or individual: 92.11%
Average age of principal farm operators: 57 years
Average number of cattle and calves per 100 acres of all land in farms: 5.37
Milk cows as a percentage of all cattle and calves: 5.61%
Corn for grain: 5021 harvested acres
All wheat for grain: 2972 harvested acres
Soybeans for beans: 10760 harvested acres
Vegetables: 335 harvested acres
Land in orchards: 40 acres
Tornado activity:
Charles County historical area-adjusted tornado activity is significantly below Maryland state average. It is 15925570.7 times below overall U.S. average.Tornadoes in this county have caused one fatality and 24 injuries recorded between 1950 and 2004.
On 5/8/1984, a category 1 (max. wind speeds 73-112 mph) tornado killed one person and injured 14 people and caused between $500,000 and $5,000,000 in damages.
Earthquake activity:
Charles County-area historical earthquake activity is significantly above Maryland state average. It is 57% smaller than the overall U.S. average.On 8/23/2011 at 17:51:04, a magnitude 5.8 (5.8 MW, Depth: 3.7 mi, Class: Moderate, Intensity: VI - VII) earthquake occurred 67.4 miles away from Charles County center
On 8/25/2011 at 05:07:52, a magnitude 4.5 (4.5 ML, Depth: 4.2 mi, Class: Light, Intensity: IV - V) earthquake occurred 67.1 miles away from the county center
On 12/9/2003 at 20:59:18, a magnitude 4.5 (4.5 ML, Depth: 6.2 mi) earthquake occurred 80.2 miles away from the county center
On 12/9/2003 at 20:59:14, a magnitude 4.5 (4.5 MB, 4.5 LG) earthquake occurred 82.2 miles away from the county center
On 1/16/1994 at 01:49:16, a magnitude 4.6 (4.6 MB, 4.6 LG, Depth: 3.1 mi) earthquake occurred 134.7 miles away from Charles County center
On 8/24/2011 at 00:04:36, a magnitude 4.2 (4.2 ML) earthquake occurred 67.9 miles away from the county center
Magnitude types: regional Lg-wave magnitude (LG), body-wave magnitude (MB), local magnitude (ML), moment magnitude (MW)
Most recent natural disasters:
- Maryland Covid-19 Pandemic, Incident Period: January 20, 2020, Major Disaster (Presidential) Declared DR-4491-MD: March 26, 2020, FEMA Id: 4491, Natural disaster type: Other
- Maryland Severe Winter Storm and Snowstorm, Incident Period: January 22, 2016 to January 23, 2016, Major Disaster (Presidential) Declared DR-4261: March 04, 2016, FEMA Id: 4261, Natural disaster type: Snowstorm, Winter Storm
- Maryland Hurricane Sandy, Incident Period: October 26, 2012 to November 08, 2012, Emergency Declared EM-3349: October 28, 2012, FEMA Id: 3349, Natural disaster type: Hurricane
- Maryland Hurricane Sandy, Incident Period: October 26, 2012 to November 04, 2012, Major Disaster (Presidential) Declared DR-4091: November 20, 2012, FEMA Id: 4091, Natural disaster type: Hurricane
- Maryland Severe Storms and Straight-line Winds, Incident Period: June 29, 2012 to July 08, 2012, Major Disaster (Presidential) Declared DR-4075: August 02, 2012, FEMA Id: 4075, Natural disaster type: Storm, Wind
- Maryland Remnants of Tropical Storm Lee, Incident Period: September 06, 2011 to September 09, 2011, Major Disaster (Presidential) Declared DR-4038: October 05, 2011, FEMA Id: 4038, Natural disaster type: Tropical Storm
- Maryland Hurricane Irene, Incident Period: August 26, 2011 to September 05, 2011, Emergency Declared EM-3335: August 27, 2011, FEMA Id: 3335, Natural disaster type: Hurricane
- Maryland Hurricane Irene, Incident Period: August 24, 2011 to September 05, 2011, Major Disaster (Presidential) Declared DR-4034: September 16, 2011, FEMA Id: 4034, Natural disaster type: Hurricane
- Maryland Severe Winter Storms and Snowstorms, Incident Period: February 05, 2010 to February 11, 2010, Major Disaster (Presidential) Declared DR-1910: May 06, 2010, FEMA Id: 1910, Natural disaster type: Snowstorm, Winter Storm
- Maryland Severe Winter Storm and Snowstorm, Incident Period: December 18, 2009 to December 20, 2009, Major Disaster (Presidential) Declared DR-1875: February 19, 2010, FEMA Id: 1875, Natural disaster type: Snowstorm, Winter Storm
- 11 other natural disasters have been reported since 1953.
The number of natural disasters in Charles County (21) is greater than the US average (15).
Major Disasters (Presidential) Declared: 16
Emergencies Declared: 5
Causes of natural disasters: Hurricanes: 7, Winter Storms: 6, Snowstorms: 4, Storms: 2, Tropical Storms: 2, Blizzard: 1, Flood: 1, Heavy Rain: 1, Ice Storm: 1, Snowfall: 1, Tornado: 1, Wind: 1, Other: 1 (Note: some incidents may be assigned to more than one category).
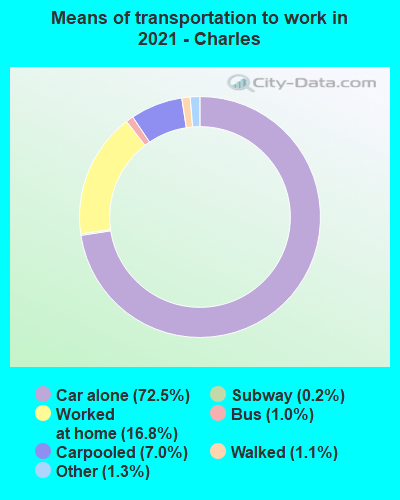
Means of transportation to work:
- Drove a car alone: 33,534 (66.0%)
- Carpooled: 3,562 (7.0%)
- Bus: 322 (0.6%)
- Subway or elevated rail: 64 (0.1%)
- Taxicab, motorcycle, or other means: 737 (1.5%)
- Bicycle: 41 (0.1%)
- Walked: 454 (0.9%)
- Worked at home: 12,966 (25.5%)

- Health care and social assistance (20%)
- Public administration (17%)
- Retail trade (11%)
- Educational services (9%)
- Professional, scientific, and technical services (9%)
- Accommodation and food services (8%)
- Other services, except public administration (6%)
- Health care and social assistance (20%)
- Public administration (17%)
- Retail trade (12%)
- Educational services (9%)
- Professional, scientific, and technical services (9%)
- Accommodation and food services (8%)
- Other services, except public administration (6%)
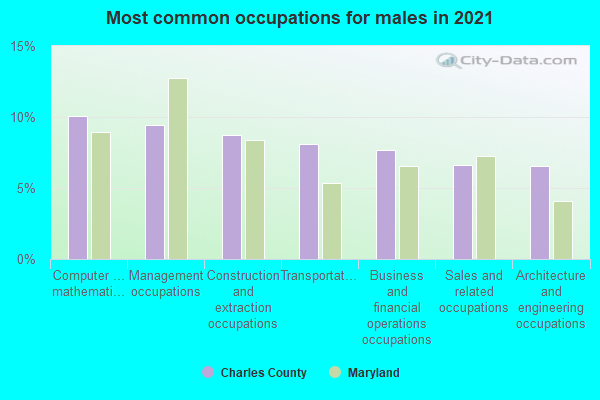
- Management occupations (13%)
- Computer and mathematical occupations (11%)
- Installation, maintenance, and repair occupations (10%)
- Sales and related occupations (7%)
- Transportation occupations (6%)
- Material moving occupations (6%)
- Building and grounds cleaning and maintenance occupations (5%)
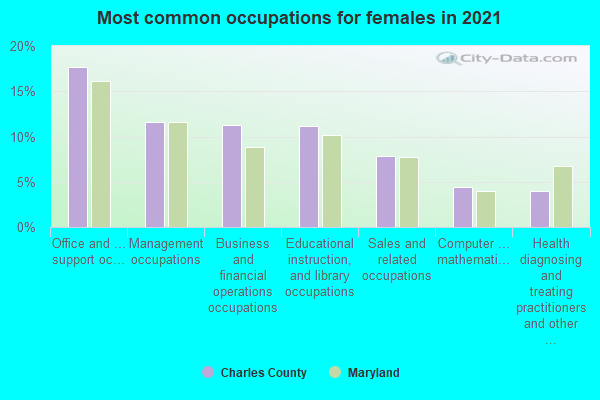
- Office and administrative support occupations (19%)
- Business and financial operations occupations (12%)
- Management occupations (11%)
- Educational instruction, and library occupations (8%)
- Sales and related occupations (8%)
- Health diagnosing and treating practitioners and other technical occupations (6%)
- Food preparation and serving related occupations (5%)
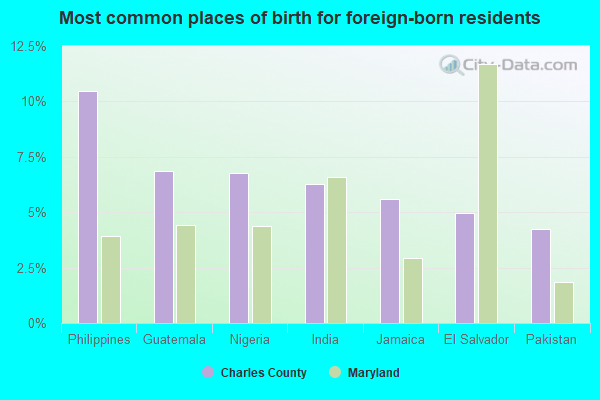
- Philippines (12%)
- Nigeria (8%)
- Guatemala (7%)
- Jamaica (7%)
- El Salvador (5%)
- India (5%)
- Mexico (5%)
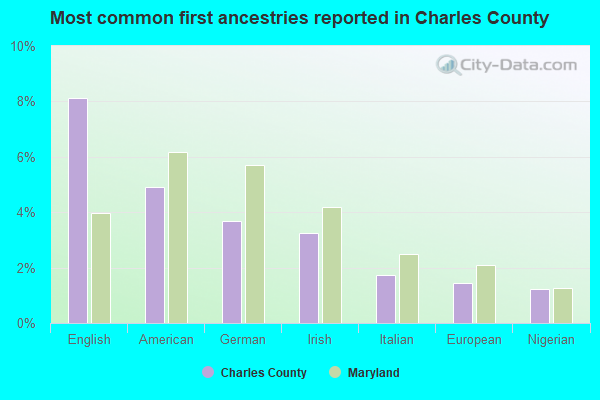
- English (8%)
- American (5%)
- Irish (3%)
- German (3%)
- Nigerian (2%)
- Italian (2%)
- African (2%)
People in group quarters in Charles County, Maryland in 2010:
- 418 people in local jails and other municipal confinement facilities
- 380 people in nursing facilities/skilled-nursing facilities
- 174 people in correctional residential facilities
- 157 people in military barracks and dormitories (nondisciplinary)
- 120 people in group homes intended for adults
- 60 people in emergency and transitional shelters (with sleeping facilities) for people experiencing homelessness
- 36 people in workers' group living quarters and job corps centers
- 27 people in residential treatment centers for adults
- 18 people in other noninstitutional facilities
- 15 people in group homes for juveniles (non-correctional)
People in group quarters in Charles County, Maryland in 2000:
- 398 people in nursing homes
- 397 people in local jails and other confinement facilities (including police lockups)
- 174 people in state prisons
- 106 people in homes for the mentally retarded
- 86 people in other noninstitutional group quarters
- 79 people in religious group quarters
- 66 people in other group homes
- 36 people in homes or halfway houses for drug/alcohol abuse
- 16 people in military barracks, etc.
- 5 people in agriculture workers' dormitories on farms
- 3 people in homes for the physically handicapped
- 3 people in other nonhousehold living situations
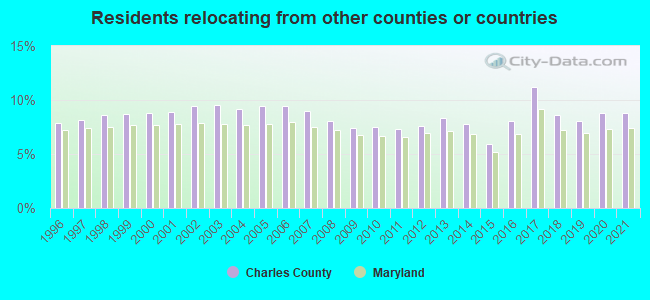
8.84% of this county's 2021 resident taxpayers lived in other counties in 2020 ($64,163 average adjusted gross income)
| Here: | 8.84% |
| Maryland average: | 7.42% |
0.09% of residents moved from foreign countries ($733 average AGI)
Charles County: 0.09% Maryland average: 0.05%
5.34% relocated from other counties in Maryland ($39,445 average AGI)
3.41% relocated from other states ($23,985 average AGI)
Charles County: 3.41% Maryland average: 3.41%
Top counties from which taxpayers relocated into this county between 2020 and 2021:
| from Prince George's County, MD | |
| from District of Columbia, DC | |
| from St. Mary's County, MD | |
| from Fairfax County, VA | |
| from Montgomery County, MD | |
| from Anne Arundel County, MD | |
| from Calvert County, MD |
8.30% of this county's 2020 resident taxpayers moved to other counties in 2021 ($68,972 average adjusted gross income)
| Here: | 8.30% |
| Maryland average: | 7.91% |
0.07% of residents moved to foreign countries ($634 average AGI)
Charles County: 0.07% Maryland average: 0.04%
4.05% relocated to other counties in Maryland ($31,055 average AGI)
4.18% relocated to other states ($37,283 average AGI)
Charles County: 4.18% Maryland average: 3.93%

Top counties to which taxpayers relocated from this county between 2020 and 2021:
| to Prince George's County, MD | |
| to St. Mary's County, MD | |
| to Calvert County, MD | |
| to Anne Arundel County, MD | |
| to District of Columbia, DC | |
| to Fairfax County, VA | |
| to Montgomery County, MD |
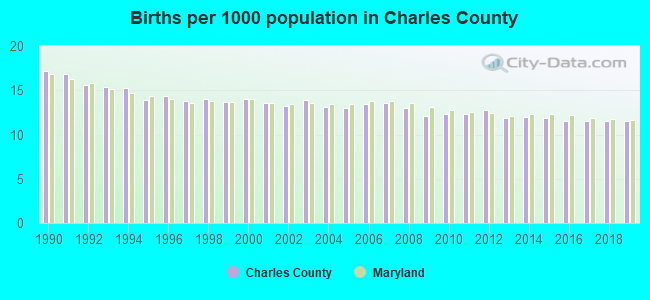
Births per 1000 population from 1990 to 1999: 15.0
Births per 1000 population from 2000 to 2009: 13.3
Births per 1000 population from 2010 to 2022: 10.0
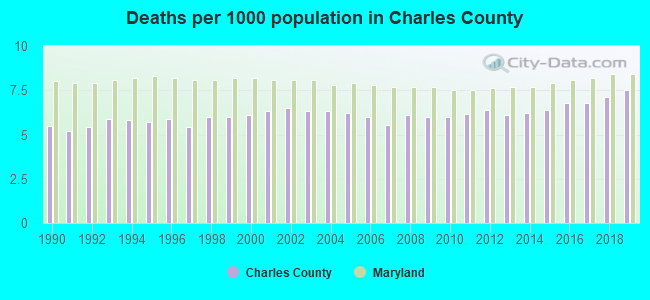
Deaths per 1000 population from 1990 to 1999: 5.7
Deaths per 1000 population from 2000 to 2009: 6.1
Deaths per 1000 population from 2010 to 2020: 6.7
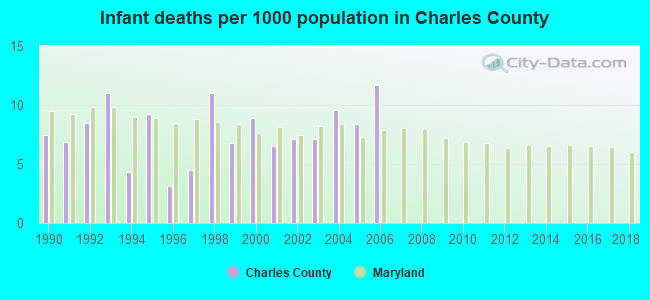
Infant deaths per 1000 live births from 1990 to 1999: 7.3
Infant deaths per 1000 live births from 2000 to 2006: 8.5
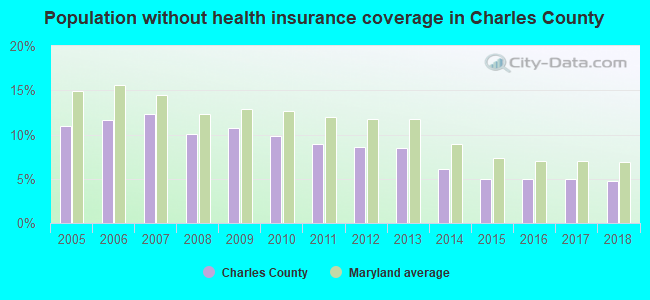
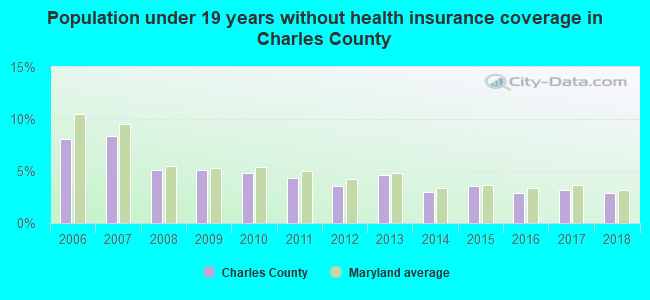
Persons under 19 years old without health insurance coverage in 2018: 2.9%
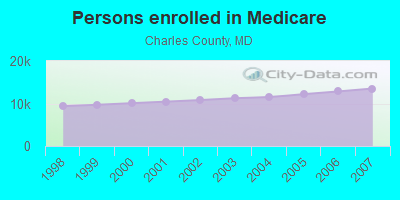
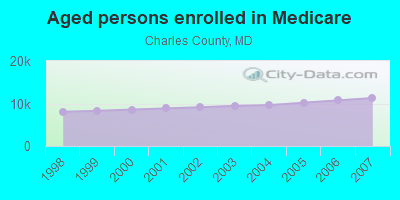
Persons enrolled in hospital insurance and/or supplemental medical insurance (Medicare) in July 1, 2007: 13,522 (11,290 aged, 2,232 disabled)
Children under 18 without health insurance coverage in 2007: 2,830 (7%)

Most common underlying causes of death in Charles County, Maryland in 1999 - 2019:
- Bronchus or lung, unspecified - Malignant neoplasms (1,249)
- Atherosclerotic heart disease (1,041)
- Acute myocardial infarction, unspecified (795)
- Atherosclerotic cardiovascular disease, so described (685)
- Chronic obstructive pulmonary disease, unspecified (623)
- Unspecified dementia (561)
- Colon, unspecified - Malignant neoplasms (421)
- Unspecified diabetes mellitus, without complications (414)
- Breast, unspecified - Malignant neoplasms (411)
- Stroke, not specified as haemorrhage or infarction (362)
Population without health insurance coverage in 2000: 11%
Children under 18 without health insurance coverage in 2000: 8%
Short term general hospital admissions per 100,000 population in 2004: 5,598
Short term general hospital beds per 100,000 population in 2004: 77
Emergency room visits per 100,000 population in 2004: 25,647
General practice office based MDs per 100,000 population in 2005: 1,342
Medical specialist MDs per 100,000 population in 2005: 622
Dentists per 100,000 population in 1998: 25
Total births per 100,000 population, July 2005 - July 2006 : 37
Total deaths per 100,000 population, July 2005 - July 2006: 81
Limited-service eating places per 100,000 population in 2005 : 16
Beer, wine & liquor stores per 100,000 population in 2005: 1
Homicides per 1,000,000 population from 2000 to 2006: 52.4. This is less than state average.
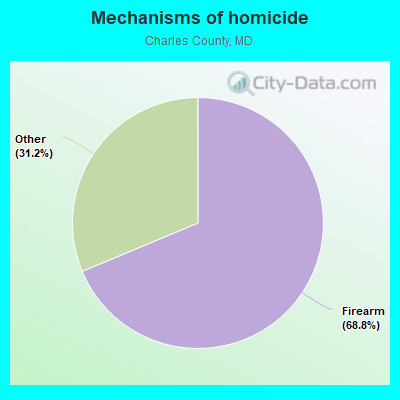
- Firearm - 36.0
- Other - 16.4
Suicides per 1,000,000 population from 2000 to 2006: 101.6. This is more than state average.
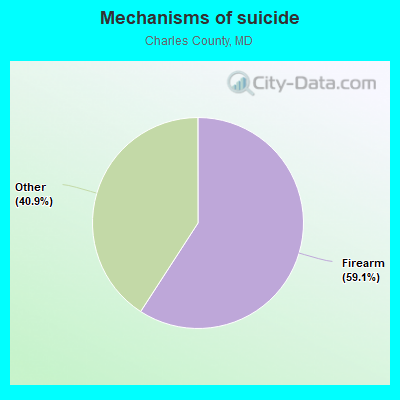
- Firearm - 60.1
- Other - 41.5
Household type by relationship:
Households: 170,102- Male householders: 28,159 (6,463 living alone), Female householders: 34,553 (9,403 living alone)
31,531 spouses (31,531 opposite-sex spouses), 4,193 unmarried partners, (4,193 opposite-sex unmarried partners), 57,098 children (52,789 natural, 1,630 adopted, 2,679 stepchildren), 5,375 grandchildren, 1,357 brothers or sisters, 2,006 parents, 0 foster children, 2,111 other relatives, 2,363 non-relatives
- In group quarters: 1,356
Size of family households: 14,983 2-persons, 13,543 3-persons, 8,447 4-persons, 3,167 5-persons, 2,007 6-persons, 1,595 7-or-more-persons.
Size of nonfamily households: 15,866 1-person, 2,559 2-persons, 545 3-persons.
28,223 married couples with children.
7,230 single-parent households (656 men, 6,574 women).
88.9% of residents of Charles speak English at home.
4.4% of residents speak Spanish at home (69% speak English very well, 15% speak English well, 10% speak English not well, 6% don't speak English at all).
2.2% of residents speak other Indo-European language at home (69% speak English very well, 21% speak English well, 9% speak English not well, 2% don't speak English at all).
1.9% of residents speak Asian or Pacific Island language at home (64% speak English very well, 28% speak English well, 5% speak English not well, 3% don't speak English at all).
1.6% of residents speak other language at home (86% speak English very well, 8% speak English well, 1% speak English not well, 4% don't speak English at all).
In fiscal year 2004:
Federal Government expenditure: $814,914,000 ($6,001 per capita)
Department of Defense expenditure: $274,418,000
Federal direct payments to individuals for retirement and disability: $382,184,000
Federal other direct payments to individuals: $89,146,000
Federal direct payments not to individuals: $4,379,000
Federal grants: $82,750,000
Federal procurement contracts: $94,454,000 ($72,475,000 Department of Defense)
Federal salaries and wages: $162,000,000 ($129,634,000 Department of Defense)
Federal Government direct loans: $2,104,000
Federal guaranteed/insured loans: $464,677,000
Federal Government insurance: $69,965,000
Population change from April 1, 2000 to July 1, 2005:
Births: 9,668| Here: | 70 per 1000 residents |
| State: | 71 per 1000 residents |
Deaths: 4,345
| Here: | 31 per 1000 residents |
| State: | 41 per 1000 residents |
Net international migration: +410
| Here: | +3 per 1000 residents |
| State: | +19 per 1000 residents |
Net internal migration: +12,691
| Here: | +91 per 1000 residents |
| State: | +2 per 1000 residents |
Total withdrawal of fresh water for public supply: 7.48 millions of gallons per day (all from ground)
| Here: | 7.5 |
| State: | 7.3 |
| Here: | 4.9 |
| State: | 4.2 |
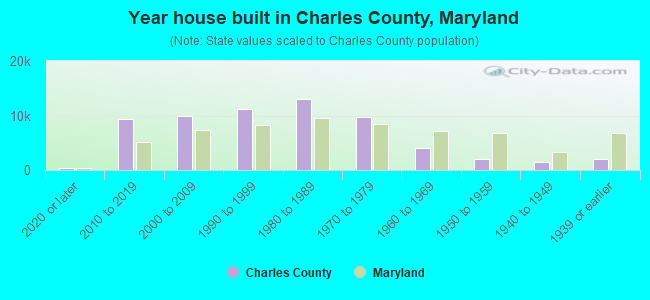
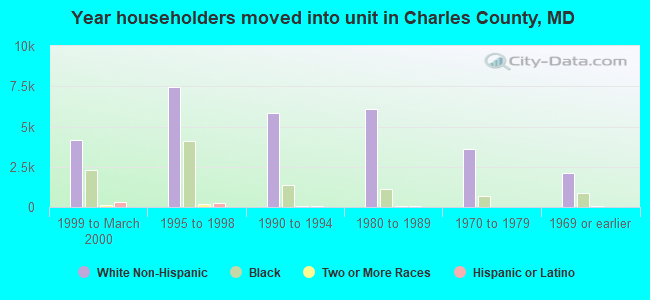
- Year house built in Charles County, Maryland
- 1,5382020 or later
- 8,4712010 to 2019
- 10,5752000 to 2009
- 12,2581990 to 1999
- 12,2731980 to 1989
- 9,4991970 to 1979
- 4,4031960 to 1969
- 2,8201950 to 1959
- 1,1881940 to 1949
- 7381939 or earlier
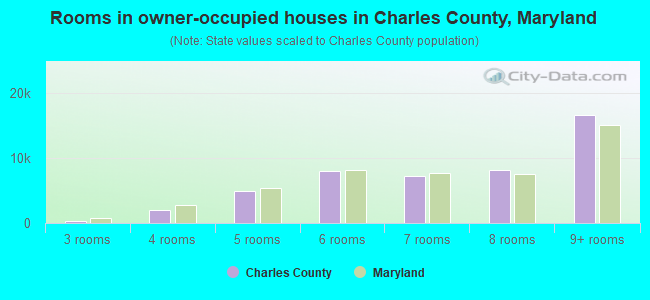
- Rooms in owner-occupied houses in Charles County, Maryland
- 611 room
- 02 rooms
- 3423 rooms
- 2,4614 rooms
- 4,8745 rooms
- 11,8706 rooms
- 6,0767 rooms
- 8,3948 rooms
- 16,7209+ rooms
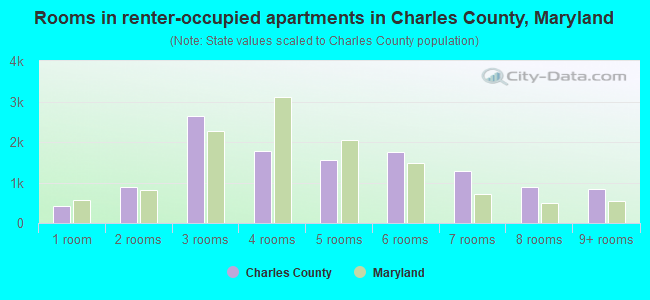
- Rooms in renter-occupied apartments in Charles County, Maryland
- 7391 room
- 2572 rooms
- 4673 rooms
- 3,5994 rooms
- 2,1985 rooms
- 1,5646 rooms
- 6597 rooms
- 1,9838 rooms
- 4489+ rooms
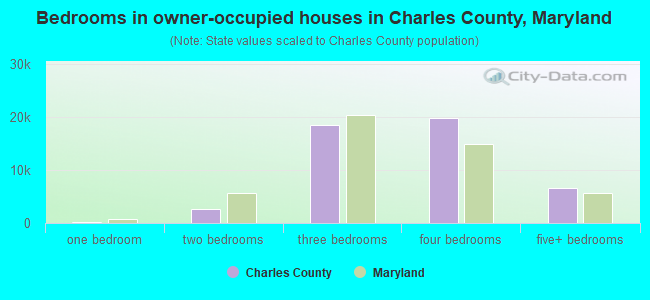
- Bedrooms in owner-occupied houses in Charles County, Maryland
- 61no bedroom
- 2381 bedroom
- 3,5972 bedrooms
- 22,9013 bedrooms
- 15,8384 bedrooms
- 8,1635+ bedrooms
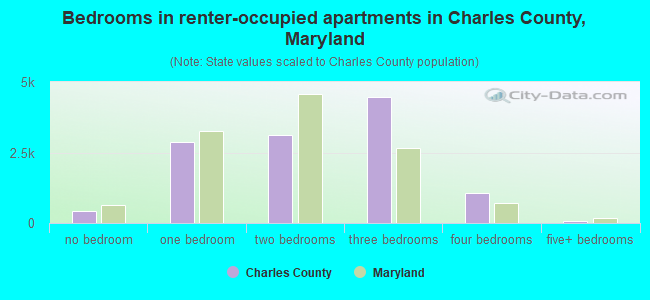
- Bedrooms in renter-occupied apartments in Charles County, Maryland
- 739no bedroom
- 9041 bedroom
- 6,4292 bedrooms
- 3,3733 bedrooms
- 3584 bedrooms
- 1115+ bedrooms
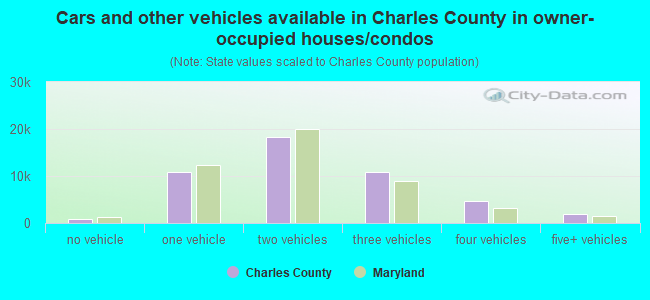
- Cars and other vehicles available in Charles County in owner-occupied houses/condos
- 1,257no vehicle
- 11,4281 vehicle
- 20,9712 vehicles
- 10,2013 vehicles
- 3,8284 vehicles
- 3,1135+ vehicles
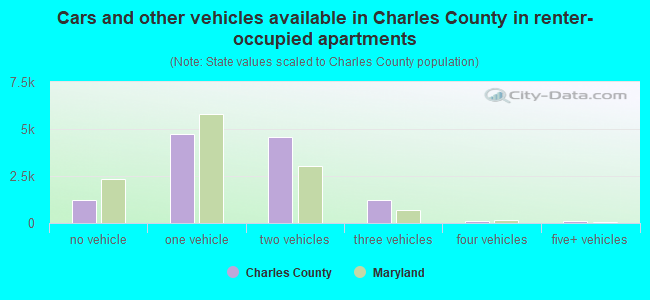
- Cars and other vehicles available in Charles County in renter-occupied apartments
- 1,553no vehicle
- 5,1471 vehicle
- 3,3382 vehicles
- 1,5733 vehicles
- 884 vehicles
- 2155+ vehicles
87.0% of Charles County residents lived in the same house 1 years ago.
Out of people who lived in different houses, 27% lived in this county.
Out of people who lived in different counties, 52% lived in Maryland.
| Charles County: | 87.0% |
| State average: | 88.5% |
Place of birth for U.S.-born residents:
- This state: 65,504
- Other state: 87,635
- Northeast: 13,476
- Midwest: 5,471
- South: 64,453
- West: 4,235
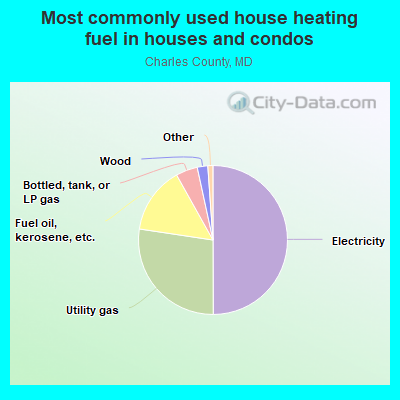
- 50.2%Electricity
- 27.5%Utility gas
- 14.2%Fuel oil, kerosene, etc.
- 4.5%Bottled, tank, or LP gas
- 2.3%Wood
- 0.6%Solar energy
- 0.5%Other fuel
- 0.2%No fuel used
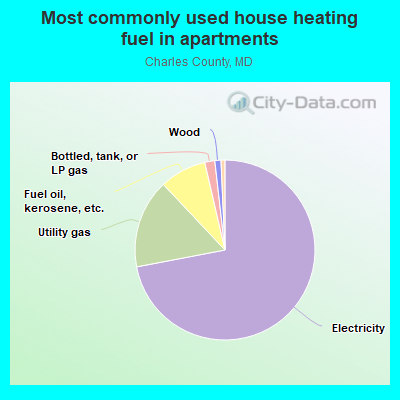
- 71.5%Electricity
- 17.0%Utility gas
- 7.9%Fuel oil, kerosene, etc.
- 1.8%Bottled, tank, or LP gas
- 0.9%Wood
- 0.7%No fuel used
- 0.2%Other fuel
Private vs. public school enrollment:
| Here: | 19.4% |
| Maryland: | 15.2% |
| Here: | 8.1% |
| Maryland: | 14.4% |
| Here: | 10.8% |
| Maryland: | 20.2% |
Charles County government finances - Expenditure in 2018:
- Bond Funds - Cash and Securities: $15,584,000
Cash and Securities: $14,507,000
- Charges - Other: $32,556,000
Other: $30,118,000
Higher Education - Other: $28,325,000
Higher Education - Other: $26,283,000
Solid Waste Management: $8,093,000
Solid Waste Management: $7,686,000
Elementary and Secondary Education School Lunch: $5,240,000
Higher Education Auxiliary Enterprises: $4,602,000
Natural Resources - Other: $4,039,000
Elementary and Secondary Education School Lunch: $3,506,000
Higher Education Auxiliary Enterprises: $3,328,000
Natural Resources - Other: $2,906,000
Elementary and Secondary Education School Tuition and Transportation: $663,000
Elementary and Secondary Education School Tuition and Transportation: $579,000
Parks and Recreation: $405,000
Parks and Recreation: $356,000
Elementary and Secondary Education - Other: $125,000
- Construction - Elementary and Secondary Education: $59,192,000
Elementary and Secondary Education: $47,347,000
Other Higher Education: $1,246,000
Other Higher Education: $1,156,000
- Current Operations - Elementary and Secondary Education: $400,990,000
Elementary and Secondary Education: $366,057,000
Police Protection: $76,642,000
Police Protection: $70,906,000
Other Higher Education: $62,221,000
Other Higher Education: $61,624,000
General - Other: $56,828,000
General - Other: $49,250,000
Water Utilities: $38,390,000
Local Fire Protection: $24,182,000
Water Utilities: $21,987,000
Local Fire Protection: $21,977,000
Regular Highways: $21,486,000
Regular Highways: $18,778,000
Correctional Institutions: $18,327,000
Correctional Institutions: $17,624,000
Parks and Recreation: $12,369,000
Parks and Recreation: $11,653,000
Housing and Community Development: $10,728,000
Health - Other: $10,679,000
Housing and Community Development: $10,582,000
Natural Resources - Other: $10,191,000
Natural Resources - Other: $8,691,000
Transit Utilities: $7,854,000
Transit Utilities: $7,681,000
Judicial and Legal Services: $7,324,000
Health - Other: $7,121,000
General Public Buildings: $7,093,000
Financial Administration: $7,049,000
Financial Administration: $7,010,000
General Public Buildings: $6,777,000
Judicial and Legal Services: $6,405,000
Central Staff Services: $6,304,000
Solid Waste Management: $6,240,000
Central Staff Services: $5,884,000
Solid Waste Management: $4,271,000
Higher Education Auxiliary Enterprises: $3,799,000
Higher Education Auxiliary Enterprises: $3,552,000
Protective Inspection and Regulation - Other: $544,000
Protective Inspection and Regulation - Other: $245,000
- Federal Intergovernmental - Housing and Community Development: $9,692,000
Housing and Community Development: $9,114,000
Education: $4,629,000
Education: $4,098,000
Other: $4,093,000
Transit Utilities: $3,453,000
Other: $3,408,000
Transit Utilities: $3,272,000
General Local Government Support: $11,000
General Local Government Support: $11,000
- General - Interest on Debt: $22,158,000
Interest on Debt: $16,781,000
- Intergovernmental to Local - Other - Libraries: $4,356,000
Other - Libraries: $4,154,000
Other - Elementary and Secondary Education: $3,630,000
Other - Elementary and Secondary Education: $3,449,000
Other - General - Other: $4,000
Other - General - Other: $4,000
- Local Intergovernmental - Education: $19,835,000
Education: $18,755,000
Other: $5,145,000
Other: $3,856,000
- Long Term Debt - Outstanding Unspecified Public Purpose: $393,692,000
Beginning Outstanding - Unspecified Public Purpose: $374,919,000
Outstanding Unspecified Public Purpose: $356,260,000
Beginning Outstanding - Unspecified Public Purpose: $339,168,000
Issue, Unspecified Public Purpose: $106,828,000
Retired Unspecified Public Purpose: $89,737,000
Issue, Unspecified Public Purpose: $61,895,000
Retired Unspecified Public Purpose: $43,123,000
Beginning Outstanding - Public Debt for Private Purpose: $182,000
Retired Nonguaranteed - Public Debt for Private Purpose: $133,000
Outstanding Nonguaranteed - Industrial Revenue: $49,000
- Miscellaneous - Interest Earnings: $6,959,000
General Revenue - Other: $4,809,000
General Revenue - Other: $3,908,000
Fines and Forfeits: $3,725,000
Interest Earnings: $3,571,000
Fines and Forfeits: $3,413,000
Rents: $1,325,000
Rents: $1,235,000
Donations From Private Sources: $553,000
Donations From Private Sources: $385,000
Sale of Property: $198,000
Sale of Property: $91,000
- Other Capital Outlay - Elementary and Secondary Education: $7,148,000
Elementary and Secondary Education: $6,838,000
Other Higher Education: $3,109,000
Other Higher Education: $260,000
- Other Funds - Cash and Securities: $354,218,000
Cash and Securities: $270,374,000
- Revenue - Water Utilities: $44,902,000
Water Utilities: $38,532,000
Transit Utilities: $590,000
Transit Utilities: $375,000
- Short Term Debt Outstanding - End of Fiscal Year: $132,000
Beginning: $128,000
Beginning: $128,000
End of Fiscal Year: $51,000
- Sinking Funds - Cash and Securities: $49,000
- State Intergovernmental - Education: $243,637,000
Education: $223,666,000
Other: $6,254,000
Other: $5,564,000
Health and Hospitals: $3,883,000
Transit Utilities: $669,000
Highways: $650,000
Transit Utilities: $571,000
Highways: $324,000
Housing and Community Development: $42,000
- Tax - Property: $251,725,000
Property: $230,447,000
Individual Income: $139,536,000
Individual Income: $124,654,000
Documentary and Stock Transfer: $19,139,000
Documentary and Stock Transfer: $18,153,000
Other Selective Sales: $13,695,000
Other Selective Sales: $11,106,000
Death and Gift: $8,274,000
Amusements Sales: $935,000
Amusements Sales: $613,000
Other License: $542,000
Other License: $509,000
Occupation and Business License - Other: $211,000
Alcoholic Beverage License: $203,000
Occupation and Business License - Other: $165,000
Alcoholic Beverage License: $153,000
Amusements License: $116,000
Amusements License: $71,000
- Total Salaries and Wages: $302,520,000
: $261,365,000
Charles County government finances - Revenue in 2018:
- Bond Funds - Cash and Securities: $15,584,000
Cash and Securities: $14,507,000
- Charges - Other: $32,556,000
Other: $30,118,000
Higher Education - Other: $28,325,000
Higher Education - Other: $26,283,000
Solid Waste Management: $8,093,000
Solid Waste Management: $7,686,000
Elementary and Secondary Education School Lunch: $5,240,000
Higher Education Auxiliary Enterprises: $4,602,000
Natural Resources - Other: $4,039,000
Elementary and Secondary Education School Lunch: $3,506,000
Higher Education Auxiliary Enterprises: $3,328,000
Natural Resources - Other: $2,906,000
Elementary and Secondary Education School Tuition and Transportation: $663,000
Elementary and Secondary Education School Tuition and Transportation: $579,000
Parks and Recreation: $405,000
Parks and Recreation: $356,000
Elementary and Secondary Education - Other: $125,000
- Construction - Elementary and Secondary Education: $59,192,000
Elementary and Secondary Education: $47,347,000
Other Higher Education: $1,246,000
Other Higher Education: $1,156,000
- Current Operations - Elementary and Secondary Education: $400,990,000
Elementary and Secondary Education: $366,057,000
Police Protection: $76,642,000
Police Protection: $70,906,000
Other Higher Education: $62,221,000
Other Higher Education: $61,624,000
General - Other: $56,828,000
General - Other: $49,250,000
Water Utilities: $38,390,000
Local Fire Protection: $24,182,000
Water Utilities: $21,987,000
Local Fire Protection: $21,977,000
Regular Highways: $21,486,000
Regular Highways: $18,778,000
Correctional Institutions: $18,327,000
Correctional Institutions: $17,624,000
Parks and Recreation: $12,369,000
Parks and Recreation: $11,653,000
Housing and Community Development: $10,728,000
Health - Other: $10,679,000
Housing and Community Development: $10,582,000
Natural Resources - Other: $10,191,000
Natural Resources - Other: $8,691,000
Transit Utilities: $7,854,000
Transit Utilities: $7,681,000
Judicial and Legal Services: $7,324,000
Health - Other: $7,121,000
General Public Buildings: $7,093,000
Financial Administration: $7,049,000
Financial Administration: $7,010,000
General Public Buildings: $6,777,000
Judicial and Legal Services: $6,405,000
Central Staff Services: $6,304,000
Solid Waste Management: $6,240,000
Central Staff Services: $5,884,000
Solid Waste Management: $4,271,000
Higher Education Auxiliary Enterprises: $3,799,000
Higher Education Auxiliary Enterprises: $3,552,000
Protective Inspection and Regulation - Other: $544,000
Protective Inspection and Regulation - Other: $245,000
- Federal Intergovernmental - Housing and Community Development: $9,692,000
Housing and Community Development: $9,114,000
Education: $4,629,000
Education: $4,098,000
Other: $4,093,000
Transit Utilities: $3,453,000
Other: $3,408,000
Transit Utilities: $3,272,000
General Local Government Support: $11,000
General Local Government Support: $11,000
- General - Interest on Debt: $22,158,000
Interest on Debt: $16,781,000
- Intergovernmental to Local - Other - Libraries: $4,356,000
Other - Libraries: $4,154,000
Other - Elementary and Secondary Education: $3,630,000
Other - Elementary and Secondary Education: $3,449,000
Other - General - Other: $4,000
Other - General - Other: $4,000
- Local Intergovernmental - Education: $19,835,000
Education: $18,755,000
Other: $5,145,000
Other: $3,856,000
- Long Term Debt - Outstanding Unspecified Public Purpose: $393,692,000
Beginning Outstanding - Unspecified Public Purpose: $374,919,000
Outstanding Unspecified Public Purpose: $356,260,000
Beginning Outstanding - Unspecified Public Purpose: $339,168,000
Issue, Unspecified Public Purpose: $106,828,000
Retired Unspecified Public Purpose: $89,737,000
Issue, Unspecified Public Purpose: $61,895,000
Retired Unspecified Public Purpose: $43,123,000
Beginning Outstanding - Public Debt for Private Purpose: $182,000
Retired Nonguaranteed - Public Debt for Private Purpose: $133,000
Outstanding Nonguaranteed - Industrial Revenue: $49,000
- Miscellaneous - Interest Earnings: $6,959,000
General Revenue - Other: $4,809,000
General Revenue - Other: $3,908,000
Fines and Forfeits: $3,725,000
Interest Earnings: $3,571,000
Fines and Forfeits: $3,413,000
Rents: $1,325,000
Rents: $1,235,000
Donations From Private Sources: $553,000
Donations From Private Sources: $385,000
Sale of Property: $198,000
Sale of Property: $91,000
- Other Capital Outlay - Elementary and Secondary Education: $7,148,000
Elementary and Secondary Education: $6,838,000
Other Higher Education: $3,109,000
Other Higher Education: $260,000
- Other Funds - Cash and Securities: $354,218,000
Cash and Securities: $270,374,000
- Revenue - Water Utilities: $44,902,000
Water Utilities: $38,532,000
Transit Utilities: $590,000
Transit Utilities: $375,000
- Short Term Debt Outstanding - End of Fiscal Year: $132,000
Beginning: $128,000
Beginning: $128,000
End of Fiscal Year: $51,000
- Sinking Funds - Cash and Securities: $49,000
- State Intergovernmental - Education: $243,637,000
Education: $223,666,000
Other: $6,254,000
Other: $5,564,000
Health and Hospitals: $3,883,000
Transit Utilities: $669,000
Highways: $650,000
Transit Utilities: $571,000
Highways: $324,000
Housing and Community Development: $42,000
- Tax - Property: $251,725,000
Property: $230,447,000
Individual Income: $139,536,000
Individual Income: $124,654,000
Documentary and Stock Transfer: $19,139,000
Documentary and Stock Transfer: $18,153,000
Other Selective Sales: $13,695,000
Other Selective Sales: $11,106,000
Death and Gift: $8,274,000
Amusements Sales: $935,000
Amusements Sales: $613,000
Other License: $542,000
Other License: $509,000
Occupation and Business License - Other: $211,000
Alcoholic Beverage License: $203,000
Occupation and Business License - Other: $165,000
Alcoholic Beverage License: $153,000
Amusements License: $116,000
Amusements License: $71,000
- Total Salaries and Wages: $302,520,000
: $261,365,000
Charles County government finances - Debt in 2018:
- Bond Funds - Cash and Securities: $15,584,000
Cash and Securities: $14,507,000
- Charges - Other: $32,556,000
Other: $30,118,000
Higher Education - Other: $28,325,000
Higher Education - Other: $26,283,000
Solid Waste Management: $8,093,000
Solid Waste Management: $7,686,000
Elementary and Secondary Education School Lunch: $5,240,000
Higher Education Auxiliary Enterprises: $4,602,000
Natural Resources - Other: $4,039,000
Elementary and Secondary Education School Lunch: $3,506,000
Higher Education Auxiliary Enterprises: $3,328,000
Natural Resources - Other: $2,906,000
Elementary and Secondary Education School Tuition and Transportation: $663,000
Elementary and Secondary Education School Tuition and Transportation: $579,000
Parks and Recreation: $405,000
Parks and Recreation: $356,000
Elementary and Secondary Education - Other: $125,000
- Construction - Elementary and Secondary Education: $59,192,000
Elementary and Secondary Education: $47,347,000
Other Higher Education: $1,246,000
Other Higher Education: $1,156,000
- Current Operations - Elementary and Secondary Education: $400,990,000
Elementary and Secondary Education: $366,057,000
Police Protection: $76,642,000
Police Protection: $70,906,000
Other Higher Education: $62,221,000
Other Higher Education: $61,624,000
General - Other: $56,828,000
General - Other: $49,250,000
Water Utilities: $38,390,000
Local Fire Protection: $24,182,000
Water Utilities: $21,987,000
Local Fire Protection: $21,977,000
Regular Highways: $21,486,000
Regular Highways: $18,778,000
Correctional Institutions: $18,327,000
Correctional Institutions: $17,624,000
Parks and Recreation: $12,369,000
Parks and Recreation: $11,653,000
Housing and Community Development: $10,728,000
Health - Other: $10,679,000
Housing and Community Development: $10,582,000
Natural Resources - Other: $10,191,000
Natural Resources - Other: $8,691,000
Transit Utilities: $7,854,000
Transit Utilities: $7,681,000
Judicial and Legal Services: $7,324,000
Health - Other: $7,121,000
General Public Buildings: $7,093,000
Financial Administration: $7,049,000
Financial Administration: $7,010,000
General Public Buildings: $6,777,000
Judicial and Legal Services: $6,405,000
Central Staff Services: $6,304,000
Solid Waste Management: $6,240,000
Central Staff Services: $5,884,000
Solid Waste Management: $4,271,000
Higher Education Auxiliary Enterprises: $3,799,000
Higher Education Auxiliary Enterprises: $3,552,000
Protective Inspection and Regulation - Other: $544,000
Protective Inspection and Regulation - Other: $245,000
- Federal Intergovernmental - Housing and Community Development: $9,692,000
Housing and Community Development: $9,114,000
Education: $4,629,000
Education: $4,098,000
Other: $4,093,000
Transit Utilities: $3,453,000
Other: $3,408,000
Transit Utilities: $3,272,000
General Local Government Support: $11,000
General Local Government Support: $11,000
- General - Interest on Debt: $22,158,000
Interest on Debt: $16,781,000
- Intergovernmental to Local - Other - Libraries: $4,356,000
Other - Libraries: $4,154,000
Other - Elementary and Secondary Education: $3,630,000
Other - Elementary and Secondary Education: $3,449,000
Other - General - Other: $4,000
Other - General - Other: $4,000
- Local Intergovernmental - Education: $19,835,000
Education: $18,755,000
Other: $5,145,000
Other: $3,856,000
- Long Term Debt - Outstanding Unspecified Public Purpose: $393,692,000
Beginning Outstanding - Unspecified Public Purpose: $374,919,000
Outstanding Unspecified Public Purpose: $356,260,000
Beginning Outstanding - Unspecified Public Purpose: $339,168,000
Issue, Unspecified Public Purpose: $106,828,000
Retired Unspecified Public Purpose: $89,737,000
Issue, Unspecified Public Purpose: $61,895,000
Retired Unspecified Public Purpose: $43,123,000
Beginning Outstanding - Public Debt for Private Purpose: $182,000
Retired Nonguaranteed - Public Debt for Private Purpose: $133,000
Outstanding Nonguaranteed - Industrial Revenue: $49,000
- Miscellaneous - Interest Earnings: $6,959,000
General Revenue - Other: $4,809,000
General Revenue - Other: $3,908,000
Fines and Forfeits: $3,725,000
Interest Earnings: $3,571,000
Fines and Forfeits: $3,413,000
Rents: $1,325,000
Rents: $1,235,000
Donations From Private Sources: $553,000
Donations From Private Sources: $385,000
Sale of Property: $198,000
Sale of Property: $91,000
- Other Capital Outlay - Elementary and Secondary Education: $7,148,000
Elementary and Secondary Education: $6,838,000
Other Higher Education: $3,109,000
Other Higher Education: $260,000
- Other Funds - Cash and Securities: $354,218,000
Cash and Securities: $270,374,000
- Revenue - Water Utilities: $44,902,000
Water Utilities: $38,532,000
Transit Utilities: $590,000
Transit Utilities: $375,000
- Short Term Debt Outstanding - End of Fiscal Year: $132,000
Beginning: $128,000
Beginning: $128,000
End of Fiscal Year: $51,000
- Sinking Funds - Cash and Securities: $49,000
- State Intergovernmental - Education: $243,637,000
Education: $223,666,000
Other: $6,254,000
Other: $5,564,000
Health and Hospitals: $3,883,000
Transit Utilities: $669,000
Highways: $650,000
Transit Utilities: $571,000
Highways: $324,000
Housing and Community Development: $42,000
- Tax - Property: $251,725,000
Property: $230,447,000
Individual Income: $139,536,000
Individual Income: $124,654,000
Documentary and Stock Transfer: $19,139,000
Documentary and Stock Transfer: $18,153,000
Other Selective Sales: $13,695,000
Other Selective Sales: $11,106,000
Death and Gift: $8,274,000
Amusements Sales: $935,000
Amusements Sales: $613,000
Other License: $542,000
Other License: $509,000
Occupation and Business License - Other: $211,000
Alcoholic Beverage License: $203,000
Occupation and Business License - Other: $165,000
Alcoholic Beverage License: $153,000
Amusements License: $116,000
Amusements License: $71,000
- Total Salaries and Wages: $302,520,000
: $261,365,000
Charles County government finances - Cash and Securities in 2018:
- Bond Funds - Cash and Securities: $15,584,000
Cash and Securities: $14,507,000
- Charges - Other: $32,556,000
Other: $30,118,000
Higher Education - Other: $28,325,000
Higher Education - Other: $26,283,000
Solid Waste Management: $8,093,000
Solid Waste Management: $7,686,000
Elementary and Secondary Education School Lunch: $5,240,000
Higher Education Auxiliary Enterprises: $4,602,000
Natural Resources - Other: $4,039,000
Elementary and Secondary Education School Lunch: $3,506,000
Higher Education Auxiliary Enterprises: $3,328,000
Natural Resources - Other: $2,906,000
Elementary and Secondary Education School Tuition and Transportation: $663,000
Elementary and Secondary Education School Tuition and Transportation: $579,000
Parks and Recreation: $405,000
Parks and Recreation: $356,000
Elementary and Secondary Education - Other: $125,000
- Construction - Elementary and Secondary Education: $59,192,000
Elementary and Secondary Education: $47,347,000
Other Higher Education: $1,246,000
Other Higher Education: $1,156,000
- Current Operations - Elementary and Secondary Education: $400,990,000
Elementary and Secondary Education: $366,057,000
Police Protection: $76,642,000
Police Protection: $70,906,000
Other Higher Education: $62,221,000
Other Higher Education: $61,624,000
General - Other: $56,828,000
General - Other: $49,250,000
Water Utilities: $38,390,000
Local Fire Protection: $24,182,000
Water Utilities: $21,987,000
Local Fire Protection: $21,977,000
Regular Highways: $21,486,000
Regular Highways: $18,778,000
Correctional Institutions: $18,327,000
Correctional Institutions: $17,624,000
Parks and Recreation: $12,369,000
Parks and Recreation: $11,653,000
Housing and Community Development: $10,728,000
Health - Other: $10,679,000
Housing and Community Development: $10,582,000
Natural Resources - Other: $10,191,000
Natural Resources - Other: $8,691,000
Transit Utilities: $7,854,000
Transit Utilities: $7,681,000
Judicial and Legal Services: $7,324,000
Health - Other: $7,121,000
General Public Buildings: $7,093,000
Financial Administration: $7,049,000
Financial Administration: $7,010,000
General Public Buildings: $6,777,000
Judicial and Legal Services: $6,405,000
Central Staff Services: $6,304,000
Solid Waste Management: $6,240,000
Central Staff Services: $5,884,000
Solid Waste Management: $4,271,000
Higher Education Auxiliary Enterprises: $3,799,000
Higher Education Auxiliary Enterprises: $3,552,000
Protective Inspection and Regulation - Other: $544,000
Protective Inspection and Regulation - Other: $245,000
- Federal Intergovernmental - Housing and Community Development: $9,692,000
Housing and Community Development: $9,114,000
Education: $4,629,000
Education: $4,098,000
Other: $4,093,000
Transit Utilities: $3,453,000
Other: $3,408,000
Transit Utilities: $3,272,000
General Local Government Support: $11,000
General Local Government Support: $11,000
- General - Interest on Debt: $22,158,000
Interest on Debt: $16,781,000
- Intergovernmental to Local - Other - Libraries: $4,356,000
Other - Libraries: $4,154,000
Other - Elementary and Secondary Education: $3,630,000
Other - Elementary and Secondary Education: $3,449,000
Other - General - Other: $4,000
Other - General - Other: $4,000
- Local Intergovernmental - Education: $19,835,000
Education: $18,755,000
Other: $5,145,000
Other: $3,856,000
- Long Term Debt - Outstanding Unspecified Public Purpose: $393,692,000
Beginning Outstanding - Unspecified Public Purpose: $374,919,000
Outstanding Unspecified Public Purpose: $356,260,000
Beginning Outstanding - Unspecified Public Purpose: $339,168,000
Issue, Unspecified Public Purpose: $106,828,000
Retired Unspecified Public Purpose: $89,737,000
Issue, Unspecified Public Purpose: $61,895,000
Retired Unspecified Public Purpose: $43,123,000
Beginning Outstanding - Public Debt for Private Purpose: $182,000
Retired Nonguaranteed - Public Debt for Private Purpose: $133,000
Outstanding Nonguaranteed - Industrial Revenue: $49,000
- Miscellaneous - Interest Earnings: $6,959,000
General Revenue - Other: $4,809,000
General Revenue - Other: $3,908,000
Fines and Forfeits: $3,725,000
Interest Earnings: $3,571,000
Fines and Forfeits: $3,413,000
Rents: $1,325,000
Rents: $1,235,000
Donations From Private Sources: $553,000
Donations From Private Sources: $385,000
Sale of Property: $198,000
Sale of Property: $91,000
- Other Capital Outlay - Elementary and Secondary Education: $7,148,000
Elementary and Secondary Education: $6,838,000
Other Higher Education: $3,109,000
Other Higher Education: $260,000
- Other Funds - Cash and Securities: $354,218,000
Cash and Securities: $270,374,000
- Revenue - Water Utilities: $44,902,000
Water Utilities: $38,532,000
Transit Utilities: $590,000
Transit Utilities: $375,000
- Short Term Debt Outstanding - End of Fiscal Year: $132,000
Beginning: $128,000
Beginning: $128,000
End of Fiscal Year: $51,000
- Sinking Funds - Cash and Securities: $49,000
- State Intergovernmental - Education: $243,637,000
Education: $223,666,000
Other: $6,254,000
Other: $5,564,000
Health and Hospitals: $3,883,000
Transit Utilities: $669,000
Highways: $650,000
Transit Utilities: $571,000
Highways: $324,000
Housing and Community Development: $42,000
- Tax - Property: $251,725,000
Property: $230,447,000
Individual Income: $139,536,000
Individual Income: $124,654,000
Documentary and Stock Transfer: $19,139,000
Documentary and Stock Transfer: $18,153,000
Other Selective Sales: $13,695,000
Other Selective Sales: $11,106,000
Death and Gift: $8,274,000
Amusements Sales: $935,000
Amusements Sales: $613,000
Other License: $542,000
Other License: $509,000
Occupation and Business License - Other: $211,000
Alcoholic Beverage License: $203,000
Occupation and Business License - Other: $165,000
Alcoholic Beverage License: $153,000
Amusements License: $116,000
Amusements License: $71,000
- Total Salaries and Wages: $302,520,000
: $261,365,000
Supplemental Security Income (SSI) in 2006:
- Total number of recipients: 1,596
- Number of aged recipients: 177
- Number of blind and disabled recipients: 1,419
- Number of recipients under 18: 225
- Number of recipients between 18 and 64: 1,023
- Number of recipients older than 64: 348
- Number of recipients also receiving OASDI: 480
- Amount of payments (thousands of dollars): 730
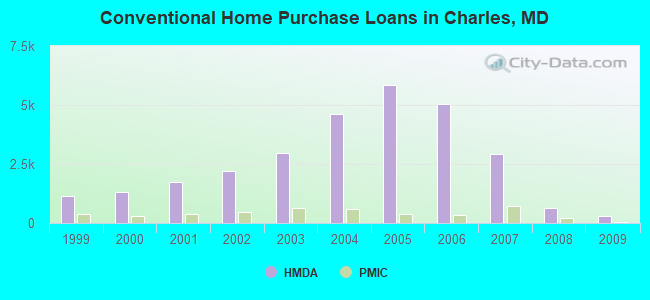
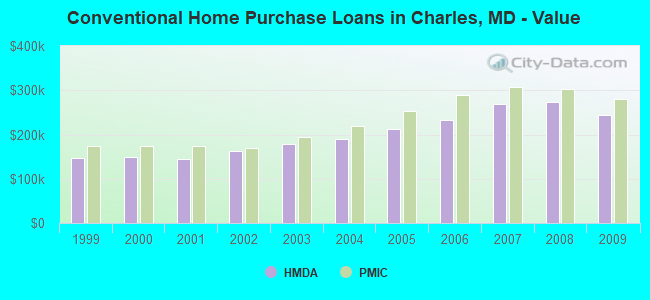
| Home Mortgage Disclosure Act Aggregated Statistics For Year 2009 (Based on 24 full tracts) | ||||||||||||||
| A) FHA, FSA/RHS & VA Home Purchase Loans | B) Conventional Home Purchase Loans | C) Refinancings | D) Home Improvement Loans | E) Loans on Dwellings For 5+ Families | F) Non-occupant Loans on < 5 Family Dwellings (A B C & D) | G) Loans On Manufactured Home Dwelling (A B C & D) | ||||||||
|---|---|---|---|---|---|---|---|---|---|---|---|---|---|---|
| Number | Average Value | Number | Average Value | Number | Average Value | Number | Average Value | Number | Average Value | Number | Average Value | Number | Average Value | |
| LOANS ORIGINATED | 1,316 | $284,009 | 302 | $244,258 | 3,981 | $258,163 | 220 | $103,227 | 3 | $2,333,333 | 170 | $209,547 | 5 | $61,800 |
| APPLICATIONS APPROVED, NOT ACCEPTED | 46 | $304,717 | 20 | $256,300 | 367 | $268,556 | 26 | $40,615 | 0 | $0 | 15 | $206,467 | 1 | $63,000 |
| APPLICATIONS DENIED | 195 | $289,005 | 69 | $185,870 | 1,636 | $285,557 | 201 | $59,473 | 0 | $0 | 84 | $200,417 | 20 | $56,800 |
| APPLICATIONS WITHDRAWN | 220 | $292,891 | 56 | $229,732 | 1,163 | $280,062 | 52 | $119,962 | 1 | $374,000 | 52 | $205,096 | 5 | $169,200 |
| FILES CLOSED FOR INCOMPLETENESS | 29 | $238,586 | 9 | $191,222 | 291 | $273,237 | 12 | $107,750 | 0 | $0 | 20 | $295,100 | 1 | $23,000 |
| Private Mortgage Insurance Companies Aggregated Statistics For Year 2009 (Based on 22 full tracts) | ||||||
| A) Conventional Home Purchase Loans | B) Refinancings | C) Non-occupant Loans on < 5 Family Dwellings (A & B) | ||||
|---|---|---|---|---|---|---|
| Number | Average Value | Number | Average Value | Number | Average Value | |
| LOANS ORIGINATED | 37 | $281,054 | 44 | $315,023 | 0 | $0 |
| APPLICATIONS APPROVED, NOT ACCEPTED | 20 | $340,350 | 27 | $320,778 | 1 | $322,000 |
| APPLICATIONS DENIED | 3 | $166,000 | 11 | $327,545 | 0 | $0 |
| APPLICATIONS WITHDRAWN | 3 | $271,000 | 9 | $273,667 | 0 | $0 |
| FILES CLOSED FOR INCOMPLETENESS | 1 | $149,000 | 3 | $415,000 | 0 | $0 |
| Most common first names in Charles County, MD among deceased individuals | ||
| Name | Count | Lived (average) |
|---|---|---|
| Mary | 471 | 76.8 years |
| James | 364 | 70.5 years |
| John | 351 | 71.1 years |
| William | 334 | 72.4 years |
| Joseph | 242 | 71.3 years |
| Robert | 220 | 70.2 years |
| Charles | 198 | 69.0 years |
| George | 173 | 71.8 years |
| Margaret | 155 | 77.9 years |
| Dorothy | 153 | 76.0 years |
| Most common last names in Charles County, MD among deceased individuals | ||
| Last name | Count | Lived (average) |
|---|---|---|
| Johnson | 126 | 72.0 years |
| Thompson | 109 | 70.7 years |
| Brown | 101 | 70.4 years |
| Smith | 91 | 73.3 years |
| Proctor | 78 | 66.0 years |
| Jones | 77 | 73.5 years |
| Thomas | 72 | 74.9 years |
| Davis | 60 | 74.1 years |
| Williams | 60 | 67.0 years |
| Jenkins | 58 | 73.8 years |
| Businesses in Charles County, MD | ||||
| Name | Count | Name | Count | |
|---|---|---|---|---|
| 7-Eleven | 6 | Little Caesars Pizza | 1 | |
| AT&T | 2 | Long John Silver's | 1 | |
| Ace Hardware | 1 | Lowe's | 1 | |
| Advance Auto Parts | 2 | Macy's | 1 | |
| Aeropostale | 1 | Marriott | 1 | |
| American Eagle Outfitters | 1 | MasterBrand Cabinets | 7 | |
| Applebee's | 2 | McDonald's | 5 | |
| Arby's | 1 | Men's Wearhouse | 1 | |
| AutoZone | 1 | Motherhood Maternity | 2 | |
| Avenue | 1 | New York & Co | 1 | |
| Baskin-Robbins | 1 | Nike | 13 | |
| Bath & Body Works | 2 | Office Depot | 1 | |
| Bed Bath & Beyond | 1 | Old Navy | 1 | |
| Best Western | 1 | Olive Garden | 1 | |
| Blockbuster | 2 | Outback | 1 | |
| Burger King | 3 | Outback Steakhouse | 1 | |
| CVS | 6 | Pac Sun | 1 | |
| Casual Male XL | 1 | Panda Express | 1 | |
| Charlotte Russe | 1 | Panera Bread | 1 | |
| Chick-Fil-A | 3 | Papa John's Pizza | 2 | |
| Chico's | 1 | Payless | 2 | |
| Chipotle | 1 | Penske | 1 | |
| Cinnabon | 1 | Pier 1 Imports | 1 | |
| Clarion | 1 | Pizza Hut | 3 | |
| Cold Stone Creamery | 1 | Popeyes | 2 | |
| Cracker Barrel | 1 | Quiznos | 1 | |
| Curves | 1 | RadioShack | 3 | |
| Dairy Queen | 2 | Red Lobster | 1 | |
| Deb | 1 | Red Robin | 1 | |
| Decora Cabinetry | 2 | Rite Aid | 2 | |
| Domino's Pizza | 2 | Ruby Tuesday | 1 | |
| DressBarn | 1 | Safeway | 3 | |
| Dressbarn | 1 | Sears | 2 | |
| Dunkin Donuts | 1 | Sephora | 1 | |
| Express | 1 | Sleep Inn | 1 | |
| Famous Footwear | 2 | Spencer Gifts | 1 | |
| FedEx | 12 | Sprint Nextel | 1 | |
| Finish Line | 1 | Starbucks | 7 | |
| Foot Locker | 1 | Subway | 7 | |
| Ford | 1 | Super 8 | 2 | |
| Forever 21 | 1 | T-Mobile | 5 | |
| GNC | 2 | T.G.I. Driday's | 1 | |
| GameStop | 4 | T.J.Maxx | 1 | |
| Giant | 2 | Taco Bell | 2 | |
| H&M | 1 | Target | 2 | |
| H&R Block | 2 | Torrid | 1 | |
| Hilton | 2 | Toys"R"Us | 2 | |
| Hollister Co. | 1 | True Value | 2 | |
| Hot Topic | 1 | U-Haul | 5 | |
| IHOP | 1 | UPS | 11 | |
| JCPenney | 1 | Value City Furniture | 1 | |
| JoS. A. Bank | 1 | Vans | 1 | |
| Jones New York | 1 | Verizon Wireless | 1 | |
| KFC | 2 | Victoria's Secret | 1 | |
| Kincaid | 1 | Vons | 3 | |
| Kohl's | 1 | Walgreens | 3 | |
| Kroger | 1 | Walmart | 1 | |
| Lane Bryant | 1 | Wendy's | 2 | |
| Lane Furniture | 1 | Wet Seal | 2 | |
| LensCrafters | 1 | World Gym | 2 | |
Charles County on our top lists:
- #85 on the list of "Top 101 counties with the highest percentage of residents relocating from foreign countries between 2010 and 2011 (pop. 50,000+)"
- #86 on the list of "Top 101 counties with highest percentage of residents voting for Obama (Democrat) in the 2012 Presidential Election (pop. 50,000+)"
- #90 on the list of "Top 101 counties with the best general health status score of residents (1-5), 3 years of data"
- #92 on the list of "Top 101 counties with the highest percentage of residents that visited a dentist within the past year"
- #96 on the list of "Top 101 counties with the lowest number of deaths per 1000 residents 2007-2013 (pop. 50,000+)"