Estimated zip code population in 2022: 6,815 Zip code population in 2010: 6,604 Zip code population in 2000: 4,942
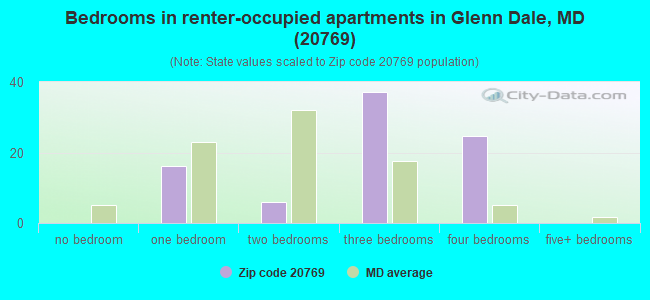
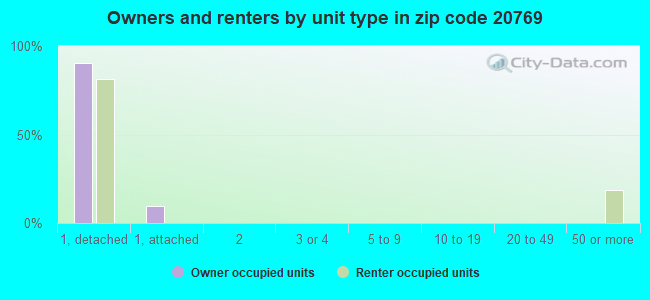
Houses and condos: 2,330 Renter-occupied apartments: 86
% of renters here:
4%
State:
32%
March 2022 cost of living index in zip code 20769: 166.5 (very high, U.S. average is 100)
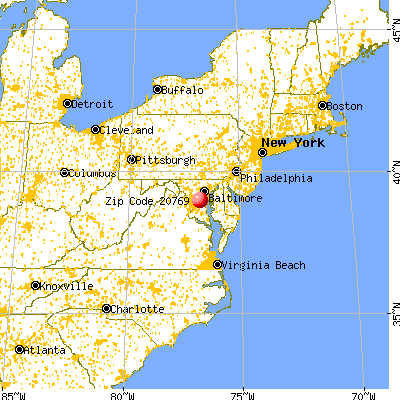
Land area: 7.7 sq. mi. Water area: 0.1 sq. mi.
Population density: 887 people per square mile
(low).
OSM Map
General Map
Google Map
MSN Map
OSM Map
General Map
Google Map
MSN Map
OSM Map
General Map
Google Map
MSN Map
OSM Map
General Map
Google Map
MSN Map
Please wait while loading the map...
Real estate property taxes paid for housing units in 2022:
This zip code:
1.1% ($5,936)
Maryland:
0.9% ($3,777)
Median real estate property taxes paid for housing units with mortgages in 2022: $5,924 (1.0%) Median real estate property taxes paid for housing units with no mortgage in 2022: $5,971 (1.2%)
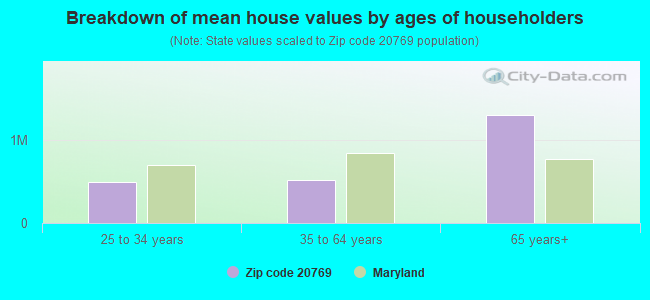
Estimated median house/condo value in 2022: $558,805
20769:
$558,805
Maryland:
$398,100
According to our research of Maryland and other state lists, there were 6 registered sex offenders living in 20769 zip code as of April 28, 2024. The ratio of all residents to sex offenders in zip code 20769 is 1,179 to 1. The ratio of registered sex offenders to all residents in this zip code is lower than the state average.
Median resident age:
This zip code:
43.8 years
Maryland median age:
39.7 years
Average household size:
This zip code:
3.0 people
Maryland:
2.5 people
Averages for the 2020 tax year for zip code 20769, filed in 2021:
Average Adjusted Gross Income (AGI) in 2020: $90,334 (Individual Income Tax Returns)
Here:
$90,334
State:
$86,905
Salary/wage: $83,149 (reported on 78.3% of returns)
Here:
$83,149
State:
$73,953
(% of AGI for various income ranges: 1178.5% for AGIs below $25k, 3643.7% for AGIs $25k-50k, 7486.1% for AGIs $50k-75k, 10710.0% for AGIs $75k-100k, 19680.7% for AGIs $100k-200k, 86638.0% for AGIs over 200k)
Taxable interest for individuals: $1,150 (reported on 36.1% of returns)
This zip code:
$1,150
Maryland:
$1,528
(% of AGI for various income ranges: 7.2% for AGIs below $25k, 19.3% for AGIs $25k-50k, 25.8% for AGIs $50k-75k, 66.5% for AGIs $75k-100k, 102.2% for AGIs $100k-200k, 762.0% for AGIs over 200k)
Ordinary dividends: $4,047 (reported on 16.7% of returns)
Here:
$4,047
State:
$8,028
(% of AGI for various income ranges: 6.8% for AGIs below $25k, 12.0% for AGIs $25k-50k, 40.6% for AGIs $50k-75k, 51.5% for AGIs $75k-100k, 172.2% for AGIs $100k-200k, 1498.0% for AGIs over 200k)
Net capital gain/loss in AGI: +$20,915 (reported on 15.7% of returns)
Here:
+$20,915
State:
+$25,238
(% of AGI for various income ranges: 1.7% for AGIs below $25k, 4.8% for AGIs $25k-50k, 109.4% for AGIs $50k-75k, 74.2% for AGIs $75k-100k, 380.7% for AGIs $100k-200k, 10624.0% for AGIs over 200k)
Profit/loss from business: +$7,726 (reported on 26.8% of returns)
Here:
+$7,726
State:
+$11,398
(% of AGI for various income ranges: 136.6% for AGIs below $25k, 180.9% for AGIs $25k-50k, 46.7% for AGIs $50k-75k, 164.6% for AGIs $100k-200k, 5429.0% for AGIs over 200k)
Taxable individual retirement arrangement distribution: $20,007 (reported on 6.8% of returns)
20769:
$20,007
Maryland:
$20,944
(% of AGI for various income ranges: 34.9% for AGIs below $25k, 71.1% for AGIs $25k-50k, 143.6% for AGIs $50k-75k, 210.8% for AGIs $75k-100k, 463.7% for AGIs $100k-200k, 1615.0% for AGIs over 200k)
Self-employed (Keogh) retirement plans: $28,450 (reported on 0.5% of returns)
20769:
$28,450
Maryland:
$29,558
(% of AGI for various income ranges: 218.8% for AGIs $75k-100k)
Total itemized deductions: $33,437 (reported on 35.9% of returns)
Here:
$33,437
State:
$30,672
(% of AGI for various income ranges: 205.6% for AGIs below $25k, 524.3% for AGIs $25k-50k, 1399.4% for AGIs $50k-75k, 2518.1% for AGIs $75k-100k, 3910.7% for AGIs $100k-200k, 14036.0% for AGIs over 200k)
Charity contributions: $10,571 (reported on 31.3% of returns)
Here:
$10,571
State:
$9,065
(% of AGI for various income ranges: 23.7% for AGIs below $25k, 105.0% for AGIs $25k-50k, 338.8% for AGIs $50k-75k, 609.2% for AGIs $75k-100k, 1129.1% for AGIs $100k-200k, 4477.0% for AGIs over 200k)
Taxes paid: $8,684 (reported on 35.4% of returns)
20769:
$8,684
State:
$8,475
(% of AGI for various income ranges: 46.5% for AGIs below $25k, 142.2% for AGIs $25k-50k, 381.8% for AGIs $50k-75k, 755.4% for AGIs $75k-100k, 1105.7% for AGIs $100k-200k, 2749.0% for AGIs over 200k)
Earned income credit: $2,127 (reported on 10.4% of returns)
Here:
$2,127
State:
$2,151
(% of AGI for various income ranges: 79.4% for AGIs below $25k, 57.0% for AGIs $25k-50k)
Percentage of individuals using paid preparers for their 2020 taxes: 85.6%
Here:
86%
State:
90%
(% for various income ranges: 85.7% for AGIs below $25k, 86.3% for AGIs $25k-50k, 86.3% for AGIs $50k-75k, 88.1% for AGIs $75k-100k, 85.1% for AGIs $100k-200k, 81.6% for AGIs over 200k)
Averages for the 2012 tax year for zip code 20769, filed in 2013:
Average Adjusted Gross Income (AGI) in 2012: $88,422 (Individual Income Tax Returns)
Here:
$88,422
State:
$72,703
Salary/wage: $80,193 (reported on 84.9% of returns)
Here:
$80,193
State:
$62,228
(% of AGI for various income ranges: 73.3% for AGIs below $25k, 83.3% for AGIs $25k-50k, 79.1% for AGIs $50k-75k, 72.3% for AGIs $75k-100k, 82.1% for AGIs $100k-200k, 70.7% for AGIs over 200k)
Taxable interest for individuals: $820 (reported on 44.6% of returns)
This zip code:
$820
Maryland:
$1,413
(% of AGI for various income ranges: 0.7% for AGIs below $25k, 0.4% for AGIs $25k-50k, 0.4% for AGIs $50k-75k, 0.6% for AGIs $75k-100k, 0.3% for AGIs $100k-200k, 0.5% for AGIs over 200k)
Ordinary dividends: $3,090 (reported on 20.3% of returns)
Here:
$3,090
State:
$6,933
(% of AGI for various income ranges: 1.2% for AGIs below $25k, 0.2% for AGIs $25k-50k, 0.4% for AGIs $50k-75k, 0.8% for AGIs $75k-100k, 0.6% for AGIs $100k-200k, 1.0% for AGIs over 200k)
Net capital gain/loss in AGI: +$6,682 (reported on 14.5% of returns)
Here:
+$6,682
State:
+$14,830
(% of AGI for various income ranges: 0.2% for AGIs $75k-100k, 0.6% for AGIs $100k-200k, 2.7% for AGIs over 200k)
Profit/loss from business: +$13,788 (reported on 21.4% of returns)
Here:
+$13,788
State:
+$12,606
(% of AGI for various income ranges: 10.6% for AGIs below $25k, 5.2% for AGIs $25k-50k, 3.3% for AGIs $50k-75k, 1.5% for AGIs $75k-100k, 1.2% for AGIs $100k-200k, 5.4% for AGIs over 200k)
Taxable individual retirement arrangement distribution: $17,684 (reported on 7.2% of returns)
20769:
$17,684
Maryland:
$17,065
(% of AGI for various income ranges: 2.0% for AGIs below $25k, 1.1% for AGIs $25k-50k, 1.3% for AGIs $50k-75k, 2.6% for AGIs $75k-100k, 1.1% for AGIs $100k-200k, 1.6% for AGIs over 200k)
Self-employment retirement plans: $33,200 (reported on 0.6% of returns)
20769:
$33,200
Maryland:
$24,439
(% of AGI for various income ranges: 2.1% for AGIs $75k-100k)
Total itemized deductions: $33,369 (27% of AGI, reported on 62.9% of returns)
Here:
$33,369
State:
$27,886
Here:
26.7% of AGI
State:
22.8% of AGI
(% of AGI for various income ranges: 17.7% for AGIs below $25k, 22.4% for AGIs $25k-50k, 26.7% for AGIs $50k-75k, 27.7% for AGIs $75k-100k, 26.0% for AGIs $100k-200k, 19.8% for AGIs over 200k)
Charity contributions: $6,331 (reported on 55.7% of returns)
Here:
$6,331
State:
$4,452
(% of AGI for various income ranges: 2.1% for AGIs below $25k, 3.5% for AGIs $25k-50k, 4.6% for AGIs $50k-75k, 3.9% for AGIs $75k-100k, 4.5% for AGIs $100k-200k, 3.5% for AGIs over 200k)
Taxes paid: $12,750 (reported on 62.9% of returns)
20769:
$12,750
State:
$11,690
(% of AGI for various income ranges: 4.1% for AGIs below $25k, 5.5% for AGIs $25k-50k, 8.7% for AGIs $50k-75k, 9.5% for AGIs $75k-100k, 9.9% for AGIs $100k-200k, 9.4% for AGIs over 200k)
Earned income credit: $2,012 (reported on 9.9% of returns)
Here:
$2,012
State:
$2,199
(% of AGI for various income ranges: 5.1% for AGIs below $25k, 0.7% for AGIs $25k-50k)
Percentage of individuals using paid preparers for their 2012 taxes: 53.3%
Here:
53%
State:
52%
(% for various income ranges: 48.3% for AGIs below $25k, 52.5% for AGIs $25k-50k, 54.5% for AGIs $50k-75k, 54.1% for AGIs $75k-100k, 54.8% for AGIs $100k-200k, 63.3% for AGIs over 200k)
Averages for the 2004 tax year for zip code 20769, filed in 2005:
Average Adjusted Gross Income (AGI) in 2004: $76,055 (Individual Income Tax Returns)
Here:
$76,055
State:
$60,339
Salary/wage: $71,517 (reported on 87.7% of returns)
Here:
$71,517
State:
$52,211
(% of AGI for various income ranges: 116.6% for AGIs below $10k, 75.4% for AGIs $10k-25k, 86.2% for AGIs $25k-50k, 81.8% for AGIs $50k-75k, 86.7% for AGIs $75k-100k, 81.0% for AGIs over 100k)
Taxable interest for individuals: $771 (reported on 56.4% of returns)
This zip code:
$771
Maryland:
$1,701
(% of AGI for various income ranges: 3.0% for AGIs below $10k, 1.6% for AGIs $10k-25k, 0.6% for AGIs $25k-50k, 0.6% for AGIs $50k-75k, 0.4% for AGIs $75k-100k, 0.5% for AGIs over 100k)
Taxable dividends: $1,901 (reported on 26.4% of returns)
Here:
$1,901
State:
$4,235
(% of AGI for various income ranges: 2.7% for AGIs below $10k, 0.7% for AGIs $10k-25k, 0.8% for AGIs $25k-50k, 0.7% for AGIs $50k-75k, 0.7% for AGIs $75k-100k, 0.6% for AGIs over 100k)
Net capital gain/loss: +$8,445 (reported on 18.8% of returns)
Here:
+$8,445
State:
+$15,888
(% of AGI for various income ranges: 2.3% for AGIs below $10k, 0.5% for AGIs $10k-25k, -0.4% for AGIs $25k-50k, 0.0% for AGIs $50k-75k, 0.1% for AGIs $75k-100k, 3.4% for AGIs over 100k)
Profit/loss from business: +$10,506 (reported on 21.3% of returns)
Here:
+$10,506
State:
+$12,221
(% of AGI for various income ranges: 0.5% for AGIs below $10k, 5.8% for AGIs $10k-25k, 2.5% for AGIs $25k-50k, 3.4% for AGIs $50k-75k, 1.0% for AGIs $75k-100k, 3.3% for AGIs over 100k)
IRA payment deduction: $2,853 (reported on 2.4% of returns)
20769:
$2,853
Maryland:
$2,968
Self-employed pension: $13,576 (reported on 1.2% of returns)
Here:
$13,576
Maryland:
$17,155
Total itemized deductions: $29,391 (28% of AGI, reported on 67.1% of returns)
Here:
$29,391
State:
$22,960
Here:
28.4% of AGI
State:
23.3% of AGI
(% of AGI for various income ranges: 18.4% for AGIs below $10k, 21.1% for AGIs $10k-25k, 29.1% for AGIs $25k-50k, 33.6% for AGIs $50k-75k, 29.9% for AGIs $75k-100k, 23.4% for AGIs over 100k)
Charity contributions deductions: $5,495 (5% of AGI, reported on 62.2% of returns)
Here:
$5,495
State:
$4,031
Here:
5.2% of AGI
State:
3.9% of AGI
(% of AGI for various income ranges: 1.3% for AGIs below $10k, 2.6% for AGIs $10k-25k, 4.7% for AGIs $25k-50k, 5.2% for AGIs $50k-75k, 5.1% for AGIs $75k-100k, 4.3% for AGIs over 100k)
Total tax: $11,525 (reported on 83.2% of returns)
20769:
$11,525
State:
$10,167
(% of AGI for various income ranges: 3.3% for AGIs below $10k, 4.5% for AGIs $10k-25k, 6.4% for AGIs $25k-50k, 7.9% for AGIs $50k-75k, 9.4% for AGIs $75k-100k, 15.6% for AGIs over 100k)
Earned income credit: $1,645 (reported on 7.5% of returns)
Here:
$1,645
State:
$1,700
Percentage of individuals using paid preparers for their 2004 taxes: 54.2%
Here:
54%
State:
55%
(% for various income ranges: 44.1% for AGIs below $10k, 53.8% for AGIs $10k-25k, 57.2% for AGIs $25k-50k, 56.4% for AGIs $50k-75k, 56.7% for AGIs $75k-100k, 55.1% for AGIs over 100k)
Household received Food Stamps/SNAP in the past 12 months: 9 Household did not receive Food Stamps/SNAP in the past 12 months: 2,205
Women who had a birth in the past 12 months: 7 (7 now married, 0 unmarried) Women who did not have a birth in the past 12 months: 1,499 (715 now married, 784 unmarried)
Housing units in zip code 20769 with a mortgage: 1,522 (206 second mortgage, 171 both second mortgage and home equity loan) Median monthly owner costs for units with a mortgage: $2,865 Median monthly owner costs for units without a mortgage: $927
Residents with income below the poverty level in 2022:
This zip code:
1.1%
Whole state:
9.6%
Residents with income below 50% of the poverty level in 2022:
This zip code:
0.2%
Whole state:
4.7%
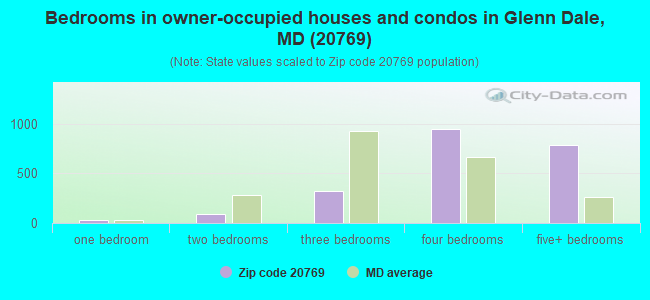
Median number of rooms in houses and condos:
Here:
10.0
State:
7.3
Median number of rooms in apartments:
Here:
5.4
State:
4.2
Notable locations in this zip code not listed on our city pages
Notable locations in zip code 20769: Glenn Dale Golf Club (A), Prince Georges County Fire / EMS Company 818 Glenn Dale Volunteer Fire Association (B). Display/hide their locations on the map
Churches in zip code 20769 include: Saint Georges Episcopal Church (A), Perkins Chapel (B), Glenn Dale United Methodist Church (C). Display/hide their locations on the map
In group quarters: 9 (-1 institutionalized population)
Size of family households: 508 2-persons, 558 3-persons, 340 4-persons, 96 5-persons, 143 6-persons, 84 7-or-more-persons
Size of nonfamily households: 476 1-person, 19 2-persons
1,271 married couples with children.
98 single-parent households (15 men, 83 women).
62.8% of residents of 20769 zip code speak English at home.
19.2% of residents speak Spanish at home (59% very well, 25% well, 10% not well, 6% not at all).
4.9% of residents speak other Indo-European language at home (80% very well, 20% well).
7.7% of residents speak Asian or Pacific Island language at home (72% very well, 12% well, 17% not well).
7.1% of residents speak other language at home (100% very well).
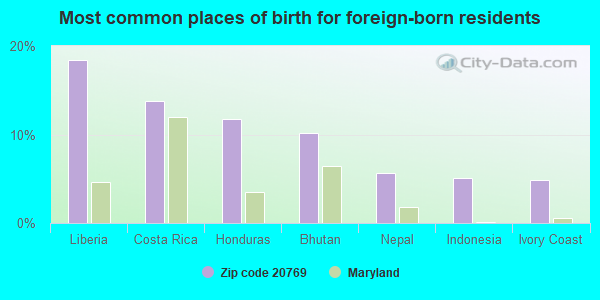
Foreign born population: 1,839 (27.0%) (66.3% of them are naturalized citizens)
This zip code:
27.0%
Whole state:
16.7%
18%Liberia
14%Costa Rica
12%Honduras
10%Bhutan
6%Nepal
5%Indonesia
5%Ivory Coast
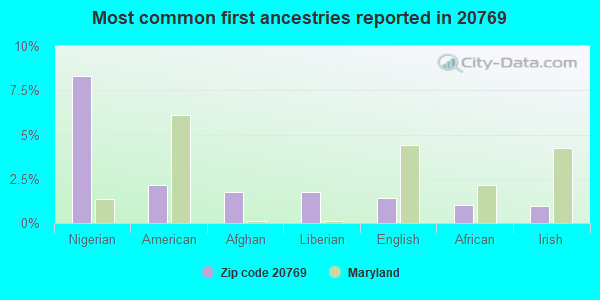
8%Nigerian
2%American
2%Afghan
2%Liberian
1%English
1%African
1%Irish
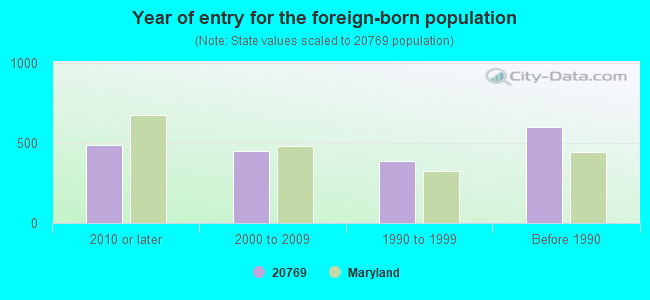
Year of entry for the foreign-born population
4882010 or later
4522000 to 2009
3861990 to 1999
597Before 1990
Facilities with environmental interests located in this zip code:
PRINCE GEORGES COUNTY PUBLIC WORKS (7317 NORTHERN AVENUE in GLENN DALE, MD)
AIR MINOR (AIRS/AFS) STATE MASTER (Maryland Permits tracking) - NPDES STORMWATER PERMIT STATE MASTER (Maryland Air Emissions Database) - AIR MINOR Business SIC classification: SEWERAGE SYSTEMS; REFUSE SYSTEMS; GENERAL GOVERNMENT Alternative names: PG COUNTY PUBLIC WORKS-NORTHERN AVE, PR. GEO. COUNTY DEPT. OF PUBLIC WORKS - GLENN DALE
AIR MINOR (AIRS/AFS) STATE MASTER (Maryland Air Emissions Database) - AIR MINOR Business SIC classification: GASOLINE SERVICE STATIONS Alternative names: CITGO GASOLINE STATION
MERKLE PRESS INCORPORATED (11200 PROSPECT HILL ROAD in GLENN DALE, MD)
Small Quantity Generators, between 100 kg and 1000 kg of hazardous waste/month (Resource Conservation and Recovery Act (tracking hazardous waste)) - notification Business NAICS classification: COMMERCIAL LITHOGRAPHIC PRINTING. Organizations: OPERNAME (CONTACT/OPERATOR)
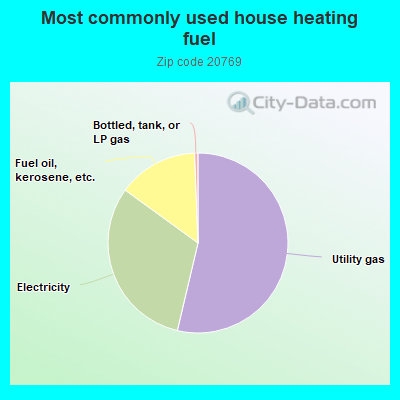
53.7%Utility gas
31.3%Electricity
14.4%Fuel oil, kerosene, etc.
0.6%Bottled, tank, or LP gas
Population in 1990: 3,242. Population change in the 1990s: +1,700 (+52.4%).
Place of birth for U.S.-born residents:
This state: 2,063
Northeast: 911
Midwest: 145
South: 1,382
West: 371
62% of the 20769 zip code residents lived in the same house 5 years ago. Out of people who lived in different houses, 64% lived in this county. Out of people who lived in different counties, 50% lived in Maryland.
95% of the 20769 zip code residents lived in the same house 1 year ago. Out of people who lived in different houses, 47% moved from this county. Out of people who lived in different houses, 13% moved from different county within same state. Out of people who lived in different houses, 40% moved from different state. Out of people who lived in different houses, 5% moved from abroad.
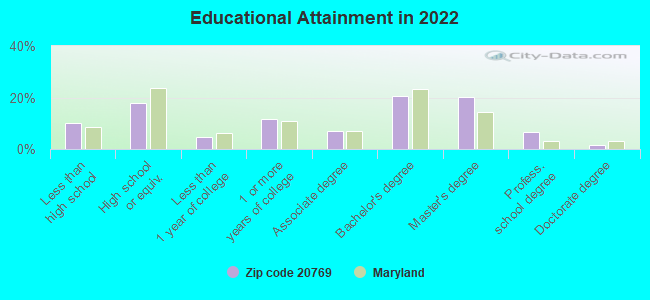
Private vs. public school enrollment:
Students in private schools in grades 1 to 8 (elementary and middle school): 323
Here:
46.7%
Maryland:
15.2%
Students in private schools in grades 9 to 12 (high school): 78
Here:
22.2%
Maryland:
14.4%
Students in private undergraduate colleges: 78
Here:
19.7%
Maryland:
20.2%
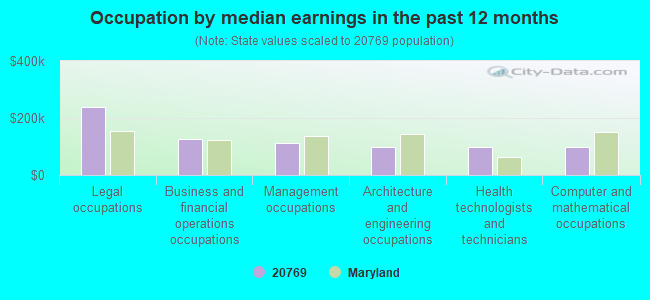
Occupation by median earnings in the past 12 months ($)
238,384Legal occupations
125,735Business and financial operations occupations
111,859Management occupations
99,363Architecture and engineering occupations
99,154Health technologists and technicians
97,985Computer and mathematical occupations
Companies with federal contracts located in this zip code:
CRYSTAL ENTERPRISES INC (10837 LANHAM SEVERN RD in GLENN DALE, MD; small business) : $48,688 in 2 contractsfrom 1999 to 2005
$26,314 with Army for Facilities Operations Support Services. Signed on 1999-10-01. Completion date: 2000-09-30.
$22,374 with Army for Custodial Janitorial Services. Signed on 2005-06-08. Completion date: 2005-09-18.
Top industries in this zip code by the number of employees in 2005:
Other Services (except Public Administration): Religious Organizations (100-249 employees: 1 establishment, 50-99 employees: 1 establishment, 5-9 employees: 1 establishment, 1-4 employees: 2 establishments)
Health Care and Social Assistance: Child Day Care Services (50-99: 1, 20-49: 1, 1-4: 3)
2009 - 2018 National Fire Incident Reporting System (NFIRS) incidents
Based on the data from the years 2009 - 2018 the average number of fire incidents per year is 18. The highest number of reported fire incidents - 46 took place in 2015, and the least - 1 in 2016. The data has a decreasing trend.
When looking into fire subcategories, the most reports belonged to: Structure Fires (45.9%), and Outside Fires (24.3%).
Fire incident types reported to NFIRS in Zip Code 20769


 Nearest zip codes: 20720, 20706, 20770, 20708, 20715, 20784.


 Based on the data from the years 2009 - 2018 the average number of fire incidents per year is 18. The highest number of reported fire incidents - 46 took place in 2015, and the least - 1 in 2016. The data has a decreasing trend.
 When looking into fire subcategories, the most reports belonged to: Structure Fires (45.9%), and Outside Fires (24.3%).