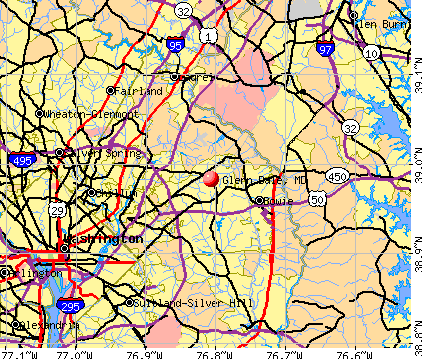
Glenn Dale, Maryland
Submit your own pictures of this place and show them to the world
- OSM Map
- General Map
- Google Map
- MSN Map
Population change since 2000: +6.8%
| Males: 6,780 | |
| Females: 6,686 |
| Median resident age: | 39.8 years |
| Maryland median age: | 39.7 years |
Zip codes: 20769.
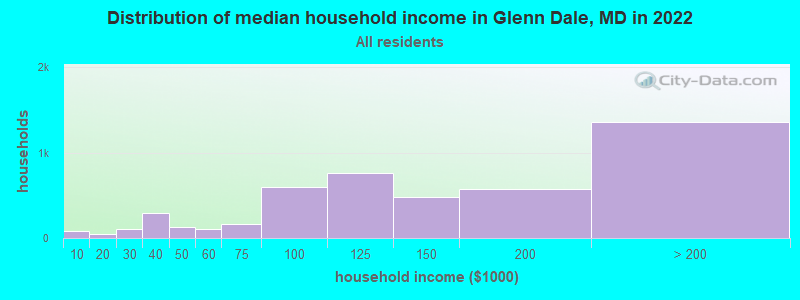
| Glenn Dale: | $126,338 |
| MD: | $94,991 |
Estimated per capita income in 2022: $48,647 (it was $27,920 in 2000)
Glenn Dale CDP income, earnings, and wages data
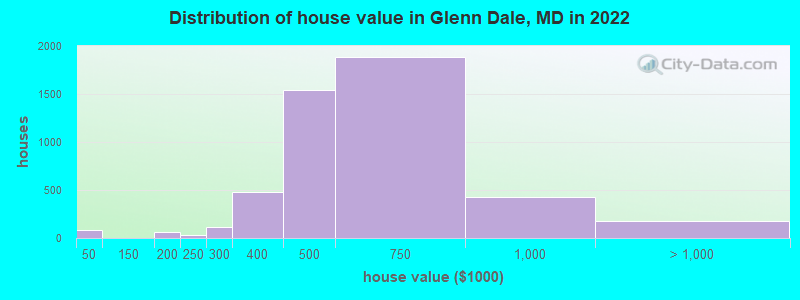
Estimated median house or condo value in 2022: $533,122 (it was $197,400 in 2000)
| Glenn Dale: | $533,122 |
| MD: | $398,100 |
Mean prices in 2022: all housing units: $424,688; detached houses: $460,769; townhouses or other attached units: $335,894; in 2-unit structures: $711,936; in 3-to-4-unit structures: $270,628; in 5-or-more-unit structures: $250,132; mobile homes: $129,345; occupied boats, rvs, vans, etc.: $551,726
Median gross rent in 2022: $1,720.
(8.0% for White Non-Hispanic residents, 1.4% for Black residents, 3.5% for Hispanic or Latino residents, 100.0% for American Indian residents, 3.6% for other race residents, 2.0% for two or more races residents)
Detailed information about poverty and poor residents in Glenn Dale, MD

Compare current foreclosures near Glenn Dale, MD:
| Photo | Address | Area | Beds / Baths | Price | Details |
|---|---|---|---|---|---|

|
#1
Sir Lancelot Dr
Glenn Dale, MD 20769
|
1,536 sq. feet
|
3 baths - beds |
show details | |

|
#2
Oakley Rd
Glenn Dale, MD 20769
|
4,448 sq. feet
|
3 baths - beds |
show details | |

|
#3
Wynfield Ct
Glenn Dale, MD 20769
|
2,888 sq. feet
|
3 baths - beds |
show details | |

|
#4
Prospect Ct
Glenn Dale, MD 20769
|
3,424 sq. feet
|
2 baths - beds |
show details | |

|
#5
Augusta Dr
Glenn Dale, MD 20769
|
2,658 sq. feet
|
3 baths - beds |
show details | |

|
#6
King Arthur Ct
Glenn Dale, MD 20769
|
2,148 sq. feet
|
2 baths - beds |
show details | |

|
#7
Wycombe Park Ln
Glenn Dale, MD 20769
|
3,192 sq. feet
|
2 baths - beds |
show details | |

|
#8
Lake Glen Dr
Glenn Dale, MD 20769
|
3,444 sq. feet
|
2 baths - beds |
show details | |

|
#9
Glenshire Dr
Glenn Dale, MD 20769
|
4,464 sq. feet
|
2 baths - beds |
show details | |

|
#10
Brookland Rd
Glenn Dale, MD 20769
|
2,185 sq. feet
|
2 baths - beds |
show details |
| Photo | Address | Area | Beds / Baths | Price | Details |
|---|---|---|---|---|---|

|
#11
Rigoli Ln
Glenn Dale, MD 20769
|
4,658 sq. feet
|
3 baths - beds |
show details | |

|
#12
Greenwood Dr
Glenn Dale, MD 20769
|
1,204 sq. feet
|
2 baths - beds |
show details | |

|
#13
Glenshire Dr
Glenn Dale, MD 20769
|
3,312 sq. feet
|
3 baths - beds |
show details | |

|
#14
Wood Pointe Ter
Glenn Dale, MD 20769
|
2,388 sq. feet
|
2 baths - beds |
show details | |

|
#15
Worrell Pl
Glenn Dale, MD 20769
|
- sq. feet
|
- baths - beds |
show details | |

|
#16
17th St NW Apt 504
Washington, DC 20009
|
800 sq. feet
|
1 baths 1 beds |
$419,900
|
show details |

|
#17
Interlachen Dr Apt 111
Silver Spring, MD 20906
|
965 sq. feet
|
1 baths 2 beds |
$148,000
|
show details |

|
#18
Pooks Hill Rd Apt 1612s
Bethesda, MD 20814
|
1,250 sq. feet
|
1 baths 2 beds |
$289,000
|
show details |

|
#19
Carousel Ct
Upper Marlboro, MD 20772
|
2,112 sq. feet
|
2 baths 3 beds |
$412,000
|
show details |

|
#20
19th St NW
Washington, DC 20036
|
2,515 sq. feet
|
6 baths 8 beds |
$1,684,800
|
show details |
| Photo | Address | Area | Beds / Baths | Price | Details |
|---|---|---|---|---|---|

|
#21
Pickett Dr
Suitland, MD 20746
|
1,296 sq. feet
|
1 baths 2 beds |
$358,900
|
show details |

|
#22
Heming Ln
Bowie, MD 20716
|
1,800 sq. feet
|
2 baths 3 beds |
$400,000
|
show details |

|
#23
Addison Rd
Capitol Heights, MD 20743
|
1,400 sq. feet
|
1 baths 3 beds |
$260,000
|
show details |

|
#24
Whistling Duck Dr
Upper Marlboro, MD 20774
|
1,740 sq. feet
|
2 baths 3 beds |
$389,500
|
show details |

|
#25
Gladys Retreat Cir
Bowie, MD 20720
|
2,880 sq. feet
|
3 baths 3 beds |
$409,900
|
show details |

|
#26
Elm Ave
Glen Burnie, MD 21061
|
1,092 sq. feet
|
2 baths 3 beds |
$399,900
|
show details |

|
#27
Parkside Dr
Bowie, MD 20721
|
5,066 sq. feet
|
2 baths 5 beds |
$780,000
|
show details |

|
#28
Eastern Ave NE
Washington, DC 20011
|
1,024 sq. feet
|
1 baths 3 beds |
$395,000
|
show details |

|
#29
Hammersmith Cir
Silver Spring, MD 20906
|
1,152 sq. feet
|
1 baths 3 beds |
$353,600
|
show details |

|
#30
Cathedral Ave NW Apt 108
Washington, DC 20016
|
765 sq. feet
|
1 baths 1 beds |
$279,900
|
show details |
| Photo | Address | Area | Beds / Baths | Price | Details |
|---|---|---|---|---|---|

|
#31
Brooke Ln
Upper Marlboro, MD 20772
|
- sq. feet
|
5 baths 6 beds |
$949,000
|
show details |

|
#32
Delaware Ave SW Apt N720
Washington, DC 20024
|
- sq. feet
|
1 baths 1 beds |
$155,000
|
show details |

|
#33
T St SE Apt 3
Washington, DC 20020
|
- sq. feet
|
2 baths 4 beds |
$339,900
|
show details |

|
#34
Sleepsoft Circle Arta 7216 Sleep Soft Circle
Columbia, MD 21045
|
972 sq. feet
|
3 baths 4 beds |
show details | |

|
#35
Millshire Dr
Millersville, MD 21108
|
1,280 sq. feet
|
2 baths 3 beds |
show details | |

|
#36
Willow Leaf Ct
Odenton, MD 21113
|
1,476 sq. feet
|
2 baths 2 beds |
show details | |

|
#37
4th St NE Apt 2
Washington, DC 20002
|
1,061 sq. feet
|
2 baths 2 beds |
show details | |

|
#38
Braden Loop
Glen Burnie, MD 21061
|
2,513 sq. feet
|
2 baths 3 beds |
show details | |

|
#39
Redwood Ter
Temple Hills, MD 20748
|
1,188 sq. feet
|
3 baths 3 beds |
show details | |

|
#40
Scaffold Way
Odenton, MD 21113
|
1,664 sq. feet
|
4 baths 4 beds |
show details |
| Photo | Address | Area | Beds / Baths | Price | Details |
|---|---|---|---|---|---|

|
#41
Parke West Dr
Glen Burnie, MD 21061
|
1,488 sq. feet
|
2 baths 3 beds |
show details | |

|
#42
Crelin Pl
Lanham, MD 20706
|
1,932 sq. feet
|
3 baths 4 beds |
show details | |

|
#43
Peacock Dr
Hyattsville, MD 20785
|
1,452 sq. feet
|
2 baths 3 beds |
show details | |

|
#44
Sutton Ln
Bowie, MD 20720
|
2,132 sq. feet
|
3 baths 3 beds |
show details | |

|
#45
Eddy Rd
Crownsville, MD 21032
|
1,100 sq. feet
|
2 baths 2 beds |
show details | |

|
#46
Connecticut Ave NW Apt 606
Washington, DC 20008
|
160 sq. feet
|
1 baths 1 beds |
show details | |

|
#47
10th St
Bowie, MD 20715
|
994 sq. feet
|
1 baths 2 beds |
show details | |

|
#48
Glen Eagles Dr
Silver Spring, MD 20906
|
3,328 sq. feet
|
3 baths 4 beds |
show details | |

|
#49
Birdsong Dr
Fort Washington, MD 20744
|
2,406 sq. feet
|
2 baths 4 beds |
show details | |

|
Check over 1 million property listings on Foreclosure.com!
|
browse all offers | |||


- 7,86752.2%Black alone
- 2,87319.1%Hispanic
- 2,04913.6%White alone
- 1,2038.0%Asian alone
- 7685.1%Other race alone
- 4312.9%Two or more races
- 30.02%Native Hawaiian and Other
Pacific Islander alone
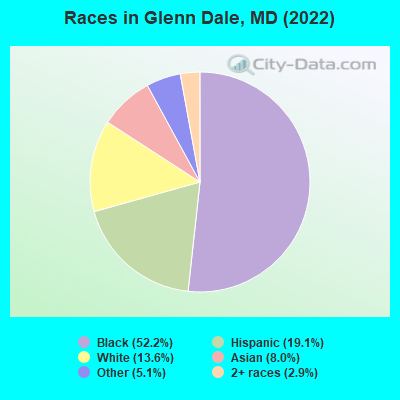
Races in Glenn Dale detailed stats: ancestries, foreign born residents, place of birth
According to our research of Maryland and other state lists, there were 6 registered sex offenders living in Glenn Dale, Maryland as of April 27, 2024.
The ratio of all residents to sex offenders in Glenn Dale is 2,231 to 1.
The ratio of registered sex offenders to all residents in this city is much lower than the state average.
 Recent articles from our blog. Our writers, many of them Ph.D. graduates or candidates, create easy-to-read articles on a wide variety of topics.

 | Is Bowie a good middle class suburb? (32 replies) |
| African American neighborhood with a reasonable commute to DC (36 replies) |
| Does Bowie feel like a mix of PG county and Annapolis culture wise? (16 replies) |
| PG County: Good/Bad Area Breakdown (48 replies) |
| Lidl Plans First Two Stores in DC Region in Prince George's County (170 replies) |
| Glenn Dale Hospital (5 replies) |
Latest news from Glenn Dale, MD collected exclusively by city-data.com from local newspapers, TV, and radio stations
Ancestries: Nigerian (7.7%), African (6.0%), American (4.3%), Zimbabwean (3.1%), Sierra Leonean (2.6%), Liberian (1.2%).
Current Local Time: EST time zone
Elevation: 46 feet
Land area: 7.37 square miles.
Population density: 1,826 people per square mile (low).
4,069 residents are foreign born (11.4% Africa, 7.4% Latin America, 5.5% Asia).
| This place: | 27.0% |
| Maryland: | 15.7% |
Median real estate property taxes paid for housing units with mortgages in 2022: $5,620 (1.0%)
Median real estate property taxes paid for housing units with no mortgage in 2022: $5,525 (1.1%)
Nearest city with pop. 50,000+: Bowie, MD (3.6 miles  , pop. 50,269).
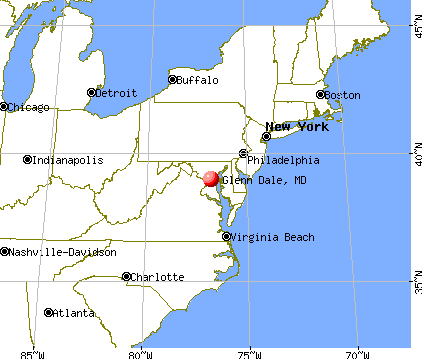
Nearest city with pop. 200,000+: Washington, DC (12.1 miles , pop. 572,059).
Nearest city with pop. 1,000,000+: Philadelphia, PA (113.1 miles , pop. 1,517,550).
Nearest cities:
), ), ), ), ), ), ), )Latitude: 38.98 N, Longitude: 76.81 W
Daytime population change due to commuting: -4,215 (-27.9%)
Workers who live and work in this place: 1,732 (23.3%)
Property values in Glenn Dale, MD
| Here: | 2.1% |
| Maryland: | 2.0% |
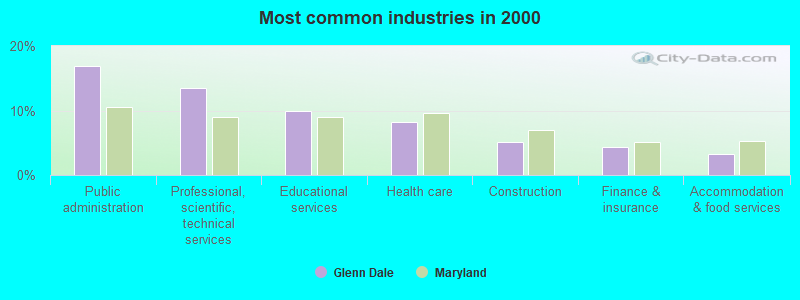
- Public administration (16.8%)
- Professional, scientific, technical services (13.5%)
- Educational services (9.9%)
- Health care (8.3%)
- Construction (5.1%)
- Finance & insurance (4.4%)
- Accommodation & food services (3.3%)
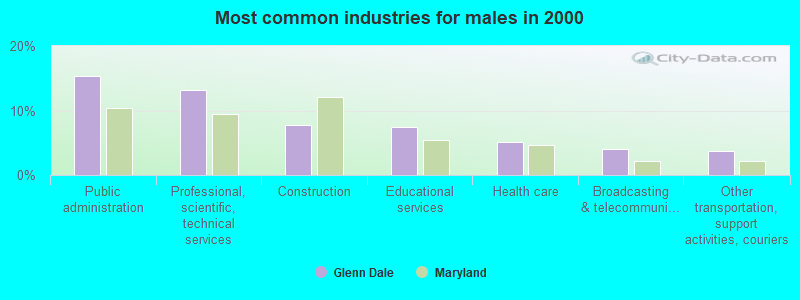
- Public administration (15.4%)
- Professional, scientific, technical services (13.1%)
- Construction (7.8%)
- Educational services (7.5%)
- Health care (5.0%)
- Broadcasting & telecommunications (4.0%)
- Other transportation, support activities, couriers (3.7%)
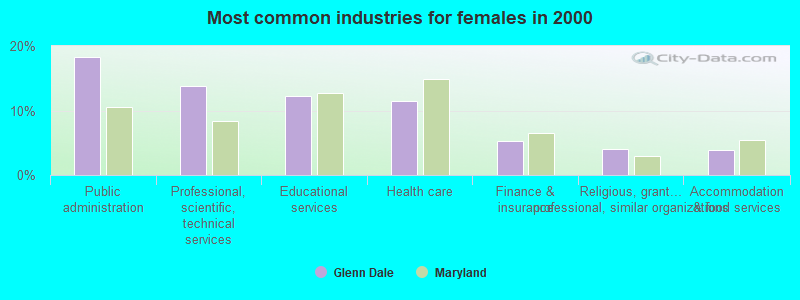
- Public administration (18.2%)
- Professional, scientific, technical services (13.8%)
- Educational services (12.2%)
- Health care (11.5%)
- Finance & insurance (5.3%)
- Religious, grantmaking, civic, professional, similar organizations (4.1%)
- Accommodation & food services (3.9%)
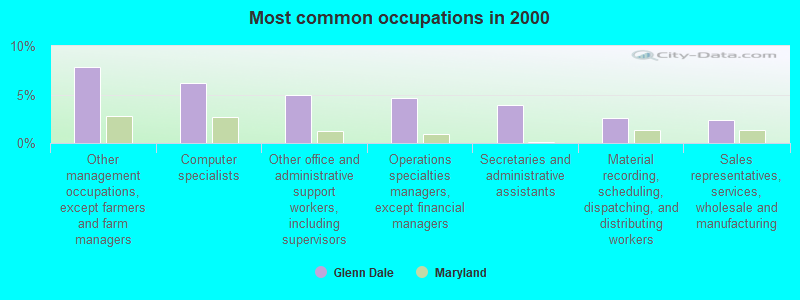
- Other management occupations, except farmers and farm managers (7.9%)
- Computer specialists (6.2%)
- Other office and administrative support workers, including supervisors (5.0%)
- Operations specialties managers, except financial managers (4.6%)
- Secretaries and administrative assistants (3.9%)
- Material recording, scheduling, dispatching, and distributing workers (2.6%)
- Sales representatives, services, wholesale and manufacturing (2.4%)
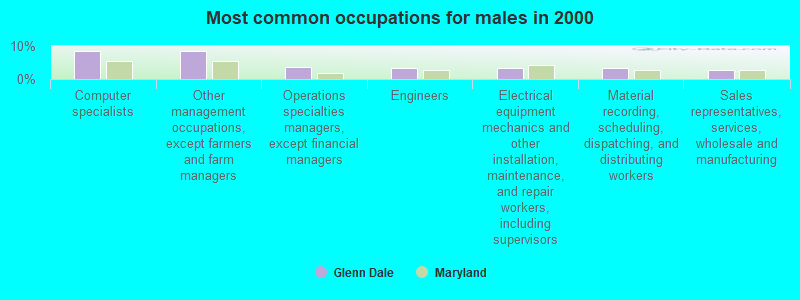
- Computer specialists (8.5%)
- Other management occupations, except farmers and farm managers (8.5%)
- Operations specialties managers, except financial managers (3.5%)
- Engineers (3.5%)
- Electrical equipment mechanics and other installation, maintenance, and repair workers, including supervisors (3.4%)
- Material recording, scheduling, dispatching, and distributing workers (3.2%)
- Sales representatives, services, wholesale and manufacturing (2.8%)
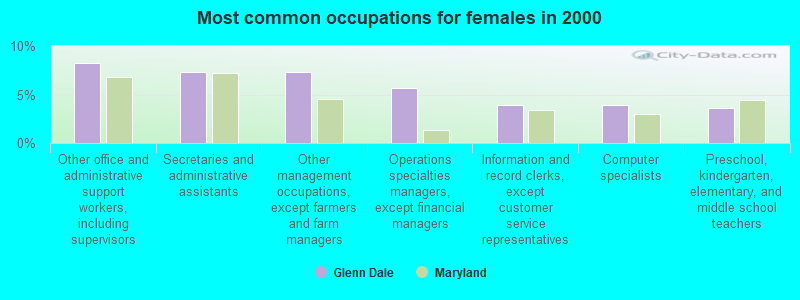
- Other office and administrative support workers, including supervisors (8.3%)
- Secretaries and administrative assistants (7.4%)
- Other management occupations, except farmers and farm managers (7.3%)
- Operations specialties managers, except financial managers (5.7%)
- Information and record clerks, except customer service representatives (4.0%)
- Computer specialists (3.9%)
- Preschool, kindergarten, elementary, and middle school teachers (3.6%)
Average climate in Glenn Dale, Maryland
Based on data reported by over 4,000 weather stations


|
|


(lower is better)
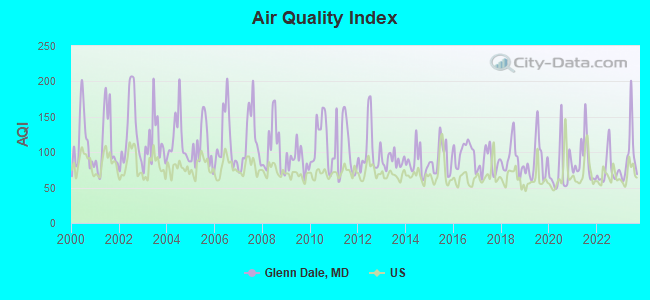
Air Quality Index (AQI) level in 2023 was 95.3. This is worse than average.
| City: | 95.3 |
| U.S.: | 72.6 |
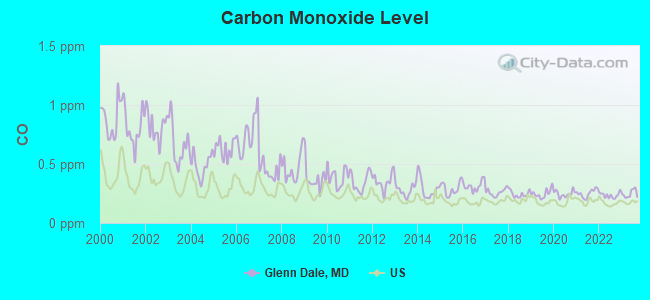
Carbon Monoxide (CO) [ppm] level in 2023 was 0.247. This is about average. Closest monitor was 6.3 miles away from the city center.
| City: | 0.247 |
| U.S.: | 0.251 |
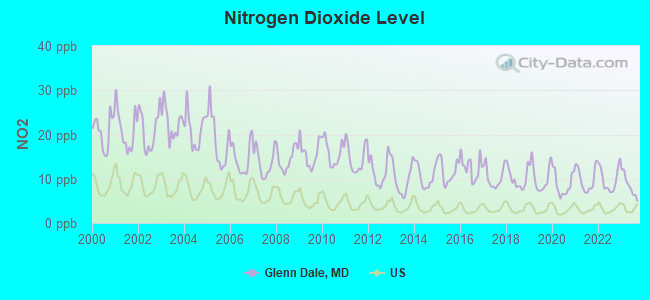
Nitrogen Dioxide (NO2) [ppb] level in 2023 was 8.51. This is significantly worse than average. Closest monitor was 2.8 miles away from the city center.
| City: | 8.51 |
| U.S.: | 5.11 |
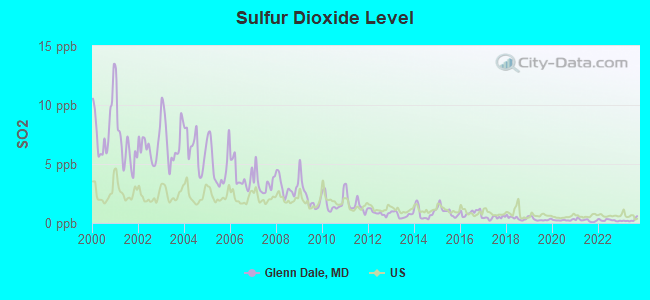
Sulfur Dioxide (SO2) [ppb] level in 2023 was 0.246. This is significantly better than average. Closest monitor was 3.2 miles away from the city center.
| City: | 0.246 |
| U.S.: | 1.515 |
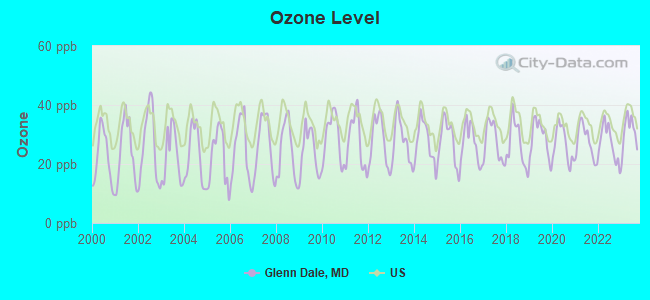
Ozone [ppb] level in 2023 was 31.0. This is about average. Closest monitor was 3.2 miles away from the city center.
| City: | 31.0 |
| U.S.: | 33.3 |
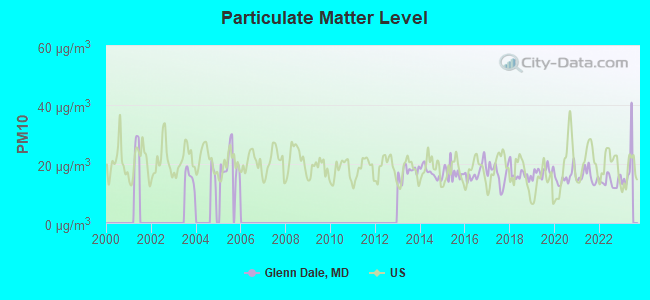
Particulate Matter (PM10) [µg/m3] level in 2022 was 14.1. This is better than average. Closest monitor was 4.0 miles away from the city center.
| City: | 14.1 |
| U.S.: | 19.2 |
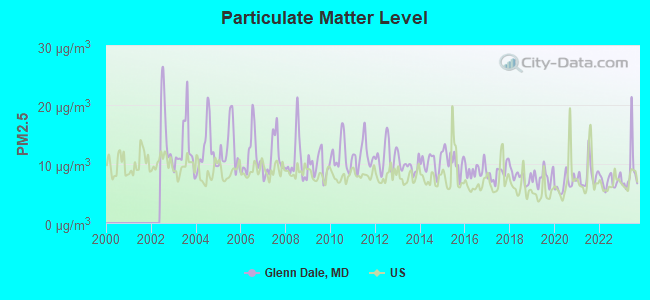
Particulate Matter (PM2.5) [µg/m3] level in 2023 was 8.78. This is about average. Closest monitor was 2.8 miles away from the city center.
| City: | 8.78 |
| U.S.: | 8.11 |
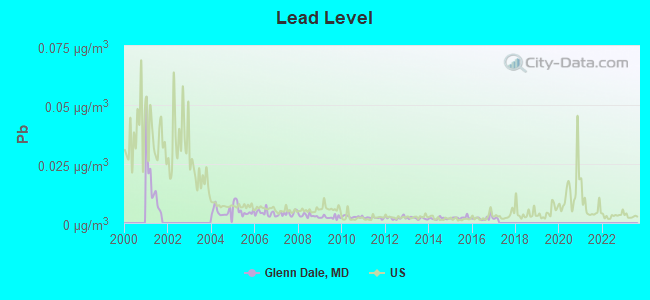
Lead (Pb) [µg/m3] level in 2016 was 0.00212. This is significantly better than average. Closest monitor was 6.6 miles away from the city center.
| City: | 0.00212 |
| U.S.: | 0.00931 |
Tornado activity:
Glenn Dale-area historical tornado activity is slightly above Maryland state average. It is 11% greater than the overall U.S. average.
On 9/24/2001, a category F3 (max. wind speeds 158-206 mph) tornado 10.0 miles away from the Glenn Dale place center killed 2 people and injured 55 people and caused $101 million in damages.
On 4/28/2002, a category F4 (max. wind speeds 207-260 mph) tornado 36.1 miles away from the place center killed 3 people and injured 122 people and caused $124 million in damages.
Earthquake activity:
Glenn Dale-area historical earthquake activity is significantly above Maryland state average. It is 58% smaller than the overall U.S. average.On 8/23/2011 at 17:51:04, a magnitude 5.8 (5.8 MW, Depth: 3.7 mi, Class: Moderate, Intensity: VI - VII) earthquake occurred 96.2 miles away from Glenn Dale center
On 1/16/1994 at 01:49:16, a magnitude 4.6 (4.6 MB, 4.6 LG, Depth: 3.1 mi, Class: Light, Intensity: IV - V) earthquake occurred 101.8 miles away from the city center
On 8/25/2011 at 05:07:52, a magnitude 4.5 (4.5 ML, Depth: 4.2 mi) earthquake occurred 95.3 miles away from Glenn Dale center
On 12/9/2003 at 20:59:18, a magnitude 4.5 (4.5 ML, Depth: 6.2 mi) earthquake occurred 109.1 miles away from the city center
On 12/9/2003 at 20:59:14, a magnitude 4.5 (4.5 MB, 4.5 LG) earthquake occurred 113.4 miles away from the city center
On 9/25/1998 at 19:52:52, a magnitude 5.2 (4.8 MB, 4.3 MS, 5.2 LG, 4.5 MW, Depth: 3.1 mi) earthquake occurred 256.9 miles away from Glenn Dale center
Magnitude types: regional Lg-wave magnitude (LG), body-wave magnitude (MB), local magnitude (ML), surface-wave magnitude (MS), moment magnitude (MW)
Natural disasters:
The number of natural disasters in Prince George's County (16) is near the US average (15).Major Disasters (Presidential) Declared: 11
Emergencies Declared: 5
Causes of natural disasters: Hurricanes: 5, Winter Storms: 5, Snowstorms: 3, Floods: 2, Storms: 2, Tropical Storms: 2, Blizzard: 1, Heavy Rain: 1, Ice Storm: 1, Snowfall: 1 (Note: some incidents may be assigned to more than one category).

Hospitals and medical centers near Glenn Dale:
- PROFESSIONAL HEALTHCARE (Home Health Center, about 3 miles away; LANHAM, MD)
- VILLA ROSA NURSING HOME (Nursing Home, about 4 miles away; MITCHELLVILLE, MD)
- MAGNOLIA CENTER (Nursing Home, about 4 miles away; LANHAM, MD)
- DOCTORS' COMMUNITY HOSPITAL Acute Care Hospitals (about 4 miles away; LANHAM, MD)
- DR CTR 4 AMBULATORY SURGY(DR C (Hospital, about 4 miles away; LANHAM, MD)
- TRANSITIONAL CARE DOCTORS COMM HOSP (Nursing Home, about 4 miles away; LANHAM, MD)
- RENAL CARE OF LANHAM (Dialysis Facility, about 4 miles away; LANHAM, MD)
Amtrak stations near Glenn Dale:
- 4 miles: NEW CARROLLTON (4300 GARDEN CITY DR.) . Services: ticket office, fully wheelchair accessible, enclosed waiting area, public restrooms, public payphones, snack bar, ATM, paid short-term parking, paid long-term parking, call for car rental service, taxi stand, public transit connection.
- 13 miles: WASHINGTON (50 MASSACHUSETTS AVE. N.E.) . Services: ticket office, fully wheelchair accessible, enclosed waiting area, public restrooms, public payphones, full-service food facilities and snack bar, ATM, paid short-term parking, paid long-term parking, car rental agency, taxi stand, public transit connection.
- 16 miles: BWI AIRPORT RAIL STATION (BALTIMORE, AMTRAK WAY) . Services: ticket office, fully wheelchair accessible, enclosed waiting area, public restrooms, public payphones, snack bar, ATM, paid short-term parking, paid long-term parking, call for car rental service, call for taxi service, public transit connection.
Colleges/universities with over 2000 students nearest to Glenn Dale:
- Bowie State University (about 4 miles; Bowie, MD; Full-time enrollment: 4,517)
- Prince George's Community College (about 7 miles; Largo, MD; FT enrollment: 8,537)
- University of Maryland-College Park (about 8 miles; College Park, MD; FT enrollment: 32,734)
- University of Maryland-University College (about 8 miles; Adelphi, MD; FT enrollment: 25,040)
- Catholic University of America (about 11 miles; Washington, DC; FT enrollment: 5,365)
- Howard University (about 13 miles; Washington, DC; FT enrollment: 7,838)
- Strayer University-Maryland (about 13 miles; Suitland, MD; FT enrollment: 2,748)
Public elementary/middle school in Glenn Dale:
- GLENN DALE ELEMENTARY (Location: 6700 GLENN DALE RD, Grades: KG-5)
Private elementary/middle schools in Glenn Dale:
Points of interest:
Notable locations in Glenn Dale: Glenn Dale Business Campus (A), Greenbelt Executive Center (B), Glenn Dale Golf Club (C), Prince Georges County Fire / EMS Company 818 Glenn Dale Volunteer Fire Association (D). Display/hide their locations on the map
Churches in Glenn Dale include: Saint Georges Episcopal Church (A), Good Samaritan Lutheran Church (B), Seaton Church (C). Display/hide their locations on the map
Cemetery: Saint Georges Chapel Cemetery (1). Display/hide its location on the map
Parks in Glenn Dale include: High Bridge Park (1), Marietta Manor Historic Site (2), Huntington North Recreation Area (3). Display/hide their locations on the map
Tourist attraction: Prince George's County Historical Society (Historical Places & Services; 5626 Bell Station Road).
| This place: | 3.1 people |
| Maryland: | 2.6 people |
| This place: | 82.1% |
| Whole state: | 67.1% |
| This place: | 5.2% |
| Whole state: | 6.4% |
Likely homosexual households (counted as self-reported same-sex unmarried-partner households)
- Lesbian couples: 0.3% of all households
- Gay men: 0.5% of all households
4 people in group homes intended for adults in 2010
6 people in homes for the mentally ill in 2000
3 people in other noninstitutional group quarters in 2000
Banks with branches in Glenn Dale (2011 data):
- Old Line Bank: Fairwood Branch at 12100 Annapolis Rd, Suite 1, branch established on 2009/10/13. Info updated 2011/04/12: Bank assets: $803.6 mil, Deposits: $691.2 mil, headquarters in Bowie, MD, positive income, Commercial Lending Specialization, 19 total offices, Holding Company: Old Line Bancshares, Inc.
For population 15 years and over in Glenn Dale:
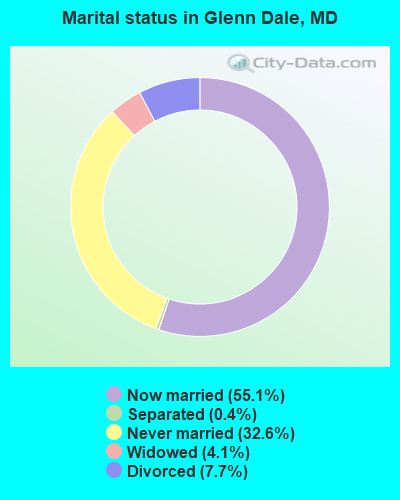
- Never married: 32.6%
- Now married: 55.1%
- Separated: 0.4%
- Widowed: 4.1%
- Divorced: 7.7%
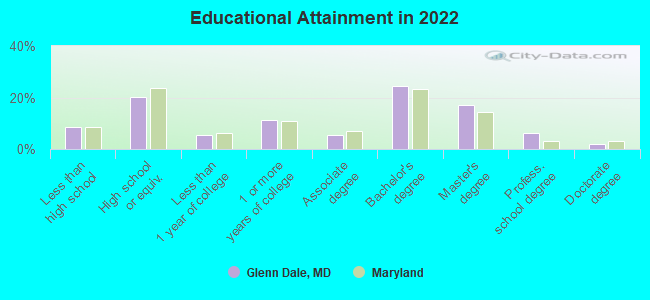
For population 25 years and over in Glenn Dale:
- High school or higher: 91.8%
- Bachelor's degree or higher: 47.8%
- Graduate or professional degree: 23.5%
- Unemployed: 3.3%
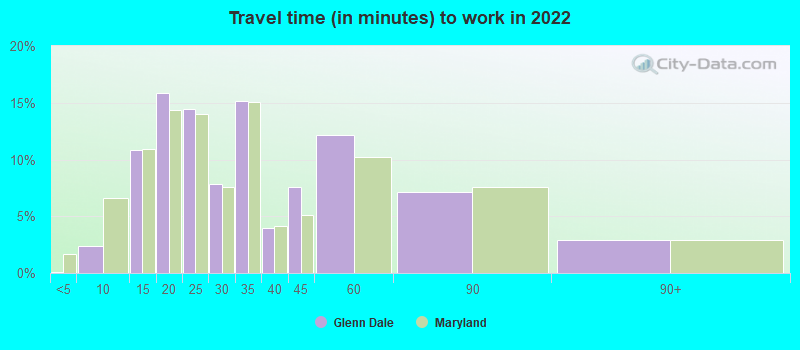
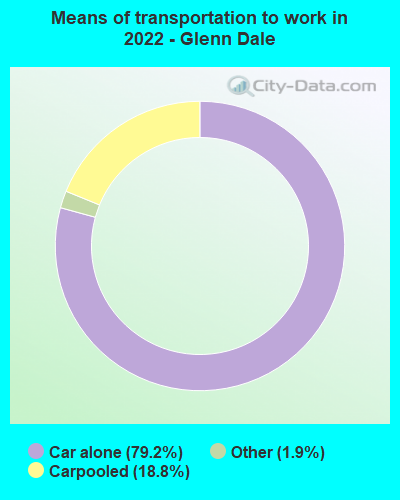
- Mean travel time to work (commute): 25.4 minutes
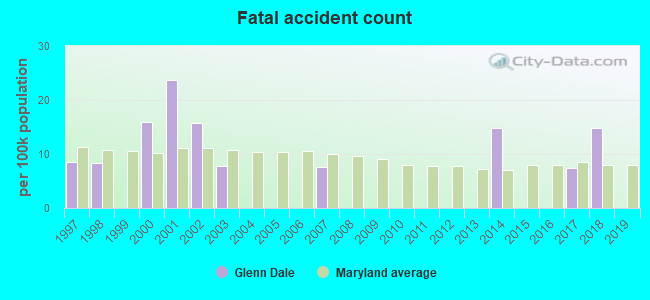
| Here: | 13.8 |
| Maryland average: | 12.7 |
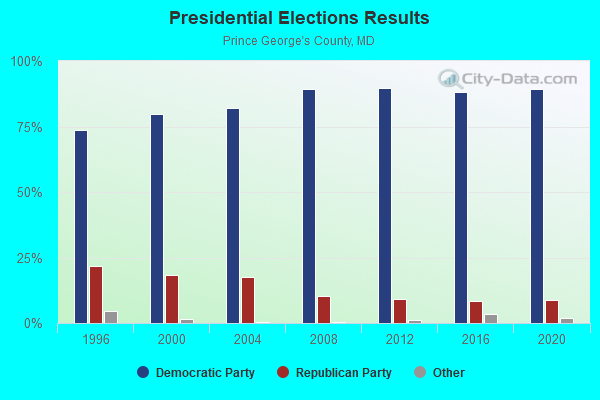
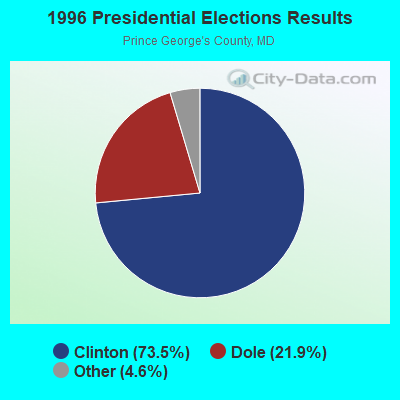
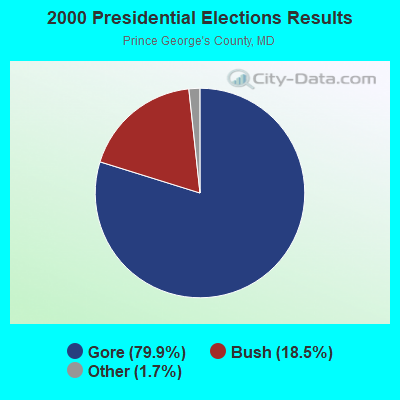
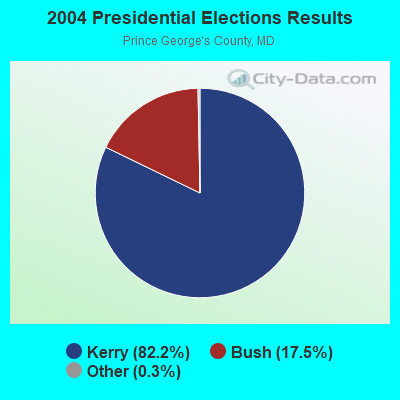
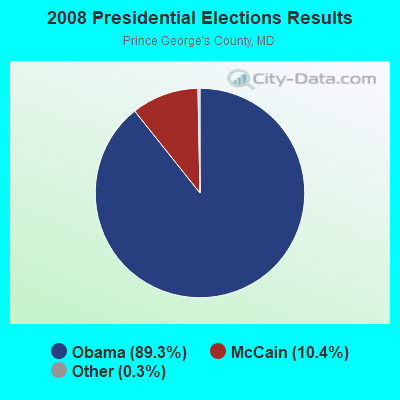

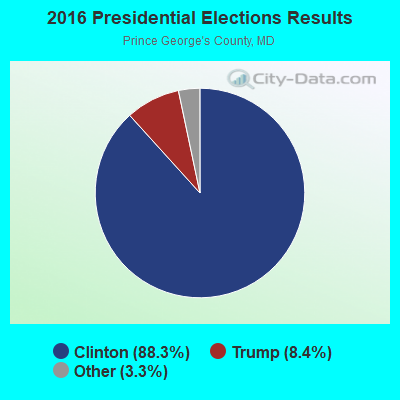
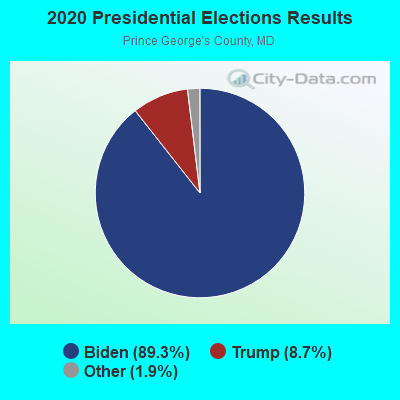
Graphs represent county-level data. Detailed 2008 Election Results
Religion statistics for Glenn Dale, MD (based on Prince George's County data)
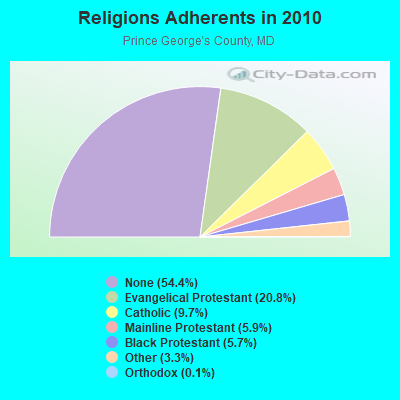
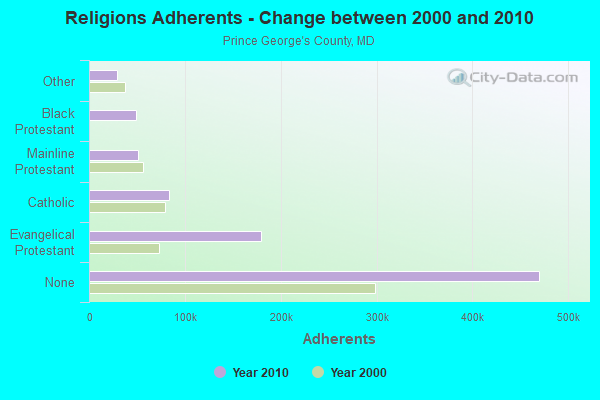
| Religion | Adherents | Congregations |
|---|---|---|
| Evangelical Protestant | 179,374 | 430 |
| Catholic | 83,959 | 35 |
| Mainline Protestant | 51,153 | 156 |
| Black Protestant | 48,984 | 66 |
| Other | 28,743 | 57 |
| Orthodox | 1,218 | 6 |
| None | 469,989 | - |
Food Environment Statistics:
| Prince George's County: | 1.70 / 10,000 pop. |
| Maryland: | 1.96 / 10,000 pop. |
| This county: | 0.02 / 10,000 pop. |
| Maryland: | 0.07 / 10,000 pop. |
| Prince George's County: | 1.60 / 10,000 pop. |
| State: | 1.22 / 10,000 pop. |
| Prince George's County: | 1.66 / 10,000 pop. |
| State: | 2.05 / 10,000 pop. |
| This county: | 3.24 / 10,000 pop. |
| Maryland: | 5.40 / 10,000 pop. |
| Prince George's County: | 10.5% |
| Maryland: | 9.1% |
| This county: | 30.7% |
| Maryland: | 26.7% |
| Prince George's County: | 16.7% |
| State: | 15.5% |
Health and Nutrition:
| Glenn Dale: | 51.0% |
| State: | 50.1% |
| Glenn Dale: | 49.7% |
| Maryland: | 47.6% |
| Here: | 29.0 |
| Maryland: | 28.8 |
| Glenn Dale: | 19.4% |
| Maryland: | 20.0% |
| Here: | 12.2% |
| State: | 11.3% |
| Here: | 6.6 |
| State: | 6.8 |
| Glenn Dale: | 35.1% |
| Maryland: | 34.1% |
| This city: | 57.8% |
| Maryland: | 56.5% |
| Glenn Dale: | 83.3% |
| Maryland: | 80.5% |
More about Health and Nutrition of Glenn Dale, MD Residents
6.37% of this county's 2021 resident taxpayers lived in other counties in 2020 ($55,200 average adjusted gross income)
| Here: | 6.37% |
| Maryland average: | 7.42% |
0.04% of residents moved from foreign countries ($466 average AGI)
Prince George's County: 0.04% Maryland average: 0.05%
Top counties from which taxpayers relocated into this county between 2020 and 2021:
| from District of Columbia, DC | |
| from Montgomery County, MD | |
| from Anne Arundel County, MD |
8.15% of this county's 2020 resident taxpayers moved to other counties in 2021 ($59,145 average adjusted gross income)
| Here: | 8.15% |
| Maryland average: | 7.91% |
0.05% of residents moved to foreign countries ($401 average AGI)
Prince George's County: 0.05% Maryland average: 0.04%
Top counties to which taxpayers relocated from this county between 2020 and 2021:
| to Montgomery County, MD | |
| to Anne Arundel County, MD | |
| to District of Columbia, DC |
Strongest AM radio stations in Glenn Dale:
- WTEM (980 AM; 50 kW; WASHINGTON, DC; Owner: AMFM RADIO LICENSES, L.L.C.)
- WPGC (1580 AM; 50 kW; MORNINGSIDE, MD; Owner: INFINITY WPGC(AM), INC.)
- WTOP (1500 AM; 50 kW; WASHINGTON, DC; Owner: BONNEVILLE HOLDING COMPANY)
- WBIS (1190 AM; 50 kW; ANNAPOLIS, MD; Owner: NATIONS RADIO, LLC)
- WCBM (680 AM; 50 kW; BALTIMORE, MD; Owner: WCBM MARYLAND, INC.)
- WMET (1150 AM; 50 kW; GAITHERSBURG, MD; Owner: BELTWAY ACQUISITION CORPORATION)
- WBAL (1090 AM; 50 kW; BALTIMORE, MD; Owner: HEARST RADIO, INC.)
- WWGB (1030 AM; daytime; 50 kW; INDIAN HEAD, MD; Owner: GOOD BODY MEDIA, LLC)
- WWLG (1370 AM; 50 kW; BALTIMORE, MD; Owner: M-10 BROADCASTING, INC.)
- WGOP (700 AM; daytime; 25 kW; WALKERSVILLE, MD; Owner: BIRACH BROADCASTING CORPORATION)
- WUST (1120 AM; daytime; 20 kW; WASHINGTON, DC)
- WILC (900 AM; 2 kW; LAUREL, MD; Owner: ILC CORPORATION)
- WMAL (630 AM; 5 kW; WASHINGTON, DC; Owner: WMAL, INC.)
Strongest FM radio stations in Glenn Dale:
- WFSI (107.9 FM; ANNAPOLIS, MD; Owner: FAMILY STATIONS, INC.)
- WPGC-FM (95.5 FM; MORNINGSIDE, MD; Owner: INFINITY BROADCASTING CORPORATION OF MARYLAND)
- WBIG-FM (100.3 FM; WASHINGTON, DC; Owner: AMFM RADIO LICENSES, L.L.C.)
- WWDC-FM (101.1 FM; WASHINGTON, DC; Owner: AMFM RADIO LICENSES, L.L.C.)
- WHFS (99.1 FM; ANNAPOLIS, MD; Owner: INFINITY BROADCASTING OPERATIONS, INC.)
- WRQX (107.3 FM; WASHINGTON, DC; Owner: WMAL, INC.)
- WHUR-FM (96.3 FM; WASHINGTON, DC; Owner: THE HOWARD UNIVERSITY)
- WASH (97.1 FM; WASHINGTON, DC; Owner: AMFM RADIO LICENSES, L.L.C.)
- WCSP-FM (90.1 FM; WASHINGTON, DC; Owner: NATIONAL CABLE SATELLITE CORPORATION)
- WARW (94.7 FM; BETHESDA, MD; Owner: INFINITY BROADCASTING OPERATIONS, INC.)
- WKYS (93.9 FM; WASHINGTON, DC; Owner: RADIO ONE LICENSES, LLC)
- WIHT (99.5 FM; WASHINGTON, DC; Owner: AMFM RADIO LICENSES, L.L.C.)
- WWMX (106.5 FM; BALTIMORE, MD; Owner: INFINITY RADIO OPERATIONS INC.)
- WPOC (93.1 FM; BALTIMORE, MD; Owner: CITICASTERS LICENSES, L.P.)
- WGMS-FM (103.5 FM; WASHINGTON, DC; Owner: BONNEVILLE HOLDING COMPANY)
- WAMU (88.5 FM; WASHINGTON, DC; Owner: THE EXEC. COMM. OF THE BD. OF TRUSTEES OF AMERICAN UNIV.)
- WIYY (97.9 FM; BALTIMORE, MD; Owner: HEARST RADIO, INC.)
- WETA (90.9 FM; WASHINGTON, DC; Owner: GREATER WASHINGTON EDUCATIONAL TELECOMMUNICATIONS ASSN.)
- WGTS (91.9 FM; TAKOMA PARK, MD; Owner: COLUMBIA UNION COLLEGE BROADCASTING, INC.)
- WMMJ (102.3 FM; BETHESDA, MD; Owner: RADIO ONE LICENSES, LLC)
TV broadcast stations around Glenn Dale:
- WMPT (Channel 22; ANNAPOLIS, MD; Owner: MARYLAND PUBLIC BROADCASTING COMMISSION)
- WBDC-TV (Channel 50; WASHINGTON, DC; Owner: WBDC BROADCASTING, INC.)
- WJLA-TV (Channel 7; WASHINGTON, DC; Owner: ACC LICENSEE, INC.)
- WUSA (Channel 9; WASHINGTON, DC; Owner: THE DETROIT NEWS, INC.)
- WTTG (Channel 5; WASHINGTON, DC; Owner: FOX TELEVISION STATIONS, INC.)
- WHUT-TV (Channel 32; WASHINGTON, DC; Owner: HOWARD UNIVERSITY)
- WETA-TV (Channel 26; WASHINGTON, DC; Owner: THE GREATER WASHINGTON ED TELECOMM. ASSOC)
- WDCA (Channel 20; WASHINGTON, DC; Owner: FOX TELEVISION STATIONS, INC.)
- WRC-TV (Channel 4; WASHINGTON, DC; Owner: NBC SUBSIDIARY (WRC-TV), INC.)
- WBAL-TV (Channel 11; BALTIMORE, MD; Owner: WBAL HEARST-ARGYLE TV, INC. (CA CORP.))
- WMAR-TV (Channel 2; BALTIMORE, MD; Owner: SCRIPPS HOWARD BROADCASTING COMPANY)
- WBFF (Channel 45; BALTIMORE, MD; Owner: CHESAPEAKE TELEVISION LICENSEE, LLC)
- WNUV (Channel 54; BALTIMORE, MD; Owner: BALTIMORE (WNUV-TV) LICENSEE, INC.)
- WUTB (Channel 24; BALTIMORE, MD; Owner: FOX TELEVISION STATIONS, INC.)
- WZDC-LP (Channel 64; WASHINGTON, DC; Owner: ONDA CAPITAL, INC.)
- WJZ-TV (Channel 13; BALTIMORE, MD; Owner: VIACOM INC.)
- W28BY (Channel 63; BALTIMORE, MD; Owner: INFORMATION SUPER STATION, L.L.C.)
- WMPB (Channel 67; BALTIMORE, MD; Owner: MARYLAND PUBLIC BROADCASTING COMMISSION)
- W63BP (Channel 63; ANNAPOLIS, MD; Owner: ANNAPOLIS BROADCASTING COMPANY, INC.)
- W61BY (Channel 61; ANNAPOLIS, MD; Owner: ANNAPOLIS BROADCASTING COMPANY, INC.)
- WIAV-LP (Channel 58; WASHINGTON, DC; Owner: ASIAVISION, INC.)
- WNVC (Channel 56; FAIRFAX, VA; Owner: COMMONWEALTH PUBLIC BROADCASTING CORPORATION)
- WMDO-CA (Channel 30; WASHINGTON, DC; Owner: ENTRAVISION HOLDINGS, LLC)
- WKRP-LP (Channel 42; WASHINGTON, DC; Owner: CAPITAL MEDIA, LLC)
- National Bridge Inventory (NBI) Statistics
- 5Number of bridges
- 59ft / 17.8mTotal length
- 69,630Total average daily traffic
- 5,395Total average daily truck traffic
- 96,377Total future (year 2032) average daily traffic
FCC Registered Antenna Towers:
4- Wayne McBride, 10400 Good Luck Road (Lat: 39.004667 Lon: -76.831917), Type: 129.5, Overall height: 121.9 m, Registrant: Prince George\'s County Office Of Homeland Security, Lando-ver, Phone: (301) 499-8101
- Richard Byrne, 8606 Springfield Road (Lat: 39.007667 Lon: -76.811778), Type: 44.2, Overall height: 42.6 m, Registrant: Towerco Assets LLC, Afry@towerco.Com, , Cary, Phone: (919) 653-5710
- Richard Byrne, 8606 Springfield Road (Lat: 39.007667 Lon: -76.811778), Type: 44.2, Overall height: 42.6 m, Registrant: Towerco Assets LLC, Afry@towerco.Com, , Cary, Phone: (919) 653-5710
- Edward G Roach, 8606 Springfield Road (Lat: 39.007667 Lon: -76.811778), Type: 44.2, Structure height: 24033 m, Overall height: 42.6 m, Registrant: Sba 2012 Tc Assets, LLC, Eroach@sbasite.Com, , Boca -Raton, Phone: (561) 995-7670
FCC Registered Broadcast Land Mobile Towers:
5- TRAP & SKEET, 10400 Good Luck Road (Lat: 39.004667 Lon: -76.831917), Type: Tower, Structure height: 121.9 m, Overall height: 129.5 m, Call Sign: WQKL949,
Assigned Frequencies: 851.012 MHz, 852.512 MHz, Grant Date: 04/19/2019, Expiration Date: 07/09/2029, Certifier: Wayne A Mcbride, Registrant: Prince George\'s County Public Safety Communications, 7911 Anchor St, Landover, MD 20785, Phone: (240) 832-0715, Fax: (717) 334-4739, Email:
- 10400 Good Luck Road (Lat: 39.004667 Lon: -76.831917), Type: Tower, Structure height: 121.9 m, Overall height: 129.5 m, Call Sign: WQKM471,
Assigned Frequencies: 851.012 MHz, 852.512 MHz, Grant Date: 07/14/2009, Expiration Date: 01/29/2010, Cancellation Date: 04/03/2010, Certifier: Wayne A Mcbride, Registrant: New Wave Licensing Services Inc., 517 Sachs Road, Gettysburg, PA 17325, Phone: (717) 334-0910, Fax: (717) 334-4739, Email:
- Lat: 38.984639 Lon: -76.808917, Call Sign: WQTS648,
Assigned Frequencies: 463.200 MHz, 463.625 MHz, 452.512 MHz, 461.025 MHz, 466.025 MHz, Grant Date: 04/03/2014, Expiration Date: 04/03/2024, Certifier: Marion Broady, Registrant: Teltronic, Inc., 7051-E Muirkirk Meadows Dr., Beltsville, MD 20705, Phone: (301) 468-6500, Fax: (301) 816-0007, Email:
- Lat: 39.005694 Lon: -76.832444, Call Sign: WRAX348,
Assigned Frequencies: 451.312 MHz, 451.612 MHz, 452.137 MHz, 452.862 MHz, 452.487 MHz, Grant Date: 04/02/2018, Expiration Date: 04/02/2028, Certifier: Chen Sun, Registrant: Teltronic, 7051 Muirkirk Meadows Drive Suite E, Beltsville, MD 20705, Phone: (301) 575-3955, Email:
- 11400 Glenn Dale Boulevard (Lat: 38.984444 Lon: -76.808889), Call Sign: WROA368,
Assigned Frequencies: 452.062 MHz, Grant Date: 09/15/2021, Expiration Date: 09/15/2031, Certifier: Michael Wilson, Registrant: Visiplex, 1287 Barclay Boulevard, Buffalo Grove, IL 60089, Phone: (847) 229-0250, Email:
FCC Registered Microwave Towers:
5- MD-WSH102A, 10812 Duvall St (Lat: 38.986778 Lon: -76.817889), Type: Pole, Structure height: 50.3 m, Call Sign: WQGN311,
Assigned Frequencies: 23075.0 MHz, 23125.0 MHz, Grant Date: 03/07/2007, Expiration Date: 03/07/2017, Cancellation Date: 09/23/2008, Certifier: Nadja Sodos-Wallace, Registrant: Clearwire Corporation, 815 Connecticut Avenue, Nw, Suite 610, Washington, DC 20006, Phone: (202) 330-4011, Fax: (202) 330-4008, Email:
- WDC0924, 10210 Greenbelt Road (Lat: 38.991722 Lon: -76.829472), Type: Bant, Structure height: 33.5 m, Call Sign: WQIE519, Licensee ID: L01728370,
Assigned Frequencies: 11405.0 MHz, 23170.0 MHz, Grant Date: 01/17/2008, Expiration Date: 01/17/2018, Cancellation Date: 09/09/2013, Certifier: Joseph M Sandri Jr., Registrant: Fibertower Network Services, Corp., Debtor-In-Possession, 1875 Eye Street, Nw, 5th Floor, Room 505, Washington, DC 20006, Phone: (202) 223-1028, Email:
- TRAP AND SKEET, 10400 Good Luck Road (Lat: 39.004667 Lon: -76.831917), Type: Tower, Structure height: 121.9 m, Overall height: 129.5 m, Call Sign: WQJK560,
Assigned Frequencies: 6034.15 MHz, 6004.50 MHz, 6034.15 MHz, 6004.50 MHz, 6034.15 MHz, 6004.50 MHz, 6034.15 MHz, 6004.50 MHz, 6034.15 MHz, 6004.50 MHz... (+4 more), Grant Date: 07/26/2018, Expiration Date: 10/14/2028, Certifier: Wayne A Mcbride, Registrant: Prince George\'s County Government, 17321 Melford Blvd, Bowie, MD 20715, Phone: (301) 832-2363, Fax: (301) 306-5694, Email:
- DC-WSH5292A, 10812 Duvall St (Lat: 38.986889 Lon: -76.818111), Type: Pole, Structure height: 45.7 m, Call Sign: WQLH599,
Assigned Frequencies: 23075.0 MHz, 23075.0 MHz, 23225.0 MHz, 23225.0 MHz, Grant Date: 03/10/2020, Expiration Date: 01/22/2030, Cancellation Date: 09/10/2021, Certifier: Nadja S Sodos-Wallace, Registrant: T-Mobile Usa, Inc., 12920 Se 38th Street, Bellevue, WA 98006, Phone: (425) 383-8402, Fax: (425) 383-4840, Email:
- GREENBELT AT, 10812 Duval St (Lat: 38.986861 Lon: -76.818056), Type: Mtower, Structure height: 44.3 m, Overall height: 45.3 m, Call Sign: WQSA772,
Assigned Frequencies: 11535.0 MHz, Grant Date: 06/01/2023, Expiration Date: 08/23/2033, Certifier: James L Snyder Jr, Registrant: Keller And Heckman LLP, 1001 G Street Nw, Suite 500, Washington, DC 20001, Phone: (202) 434-4100, Fax: (202) 434-4646, Email:
FCC Registered Amateur Radio Licenses:
20 (See the full list of FCC Registered Amateur Radio Licenses in Glenn Dale)FAA Registered Aircraft:
4- Aircraft: PIPER PA-32R-301 (Category: Land, Seats: 7, Weight: Up to 12,499 Pounds), Engine: LYCOMING IO-540 SER (300 HP) (Reciprocating)
N-Number: 226DT, N226DT, N-226DT, Serial Number: 3246006, Year manufactured: 1995, Airworthiness Date: 09/20/1995, Certificate Issue Date: 04/06/2009
Registrant (LLC): Alpha Tango LLC, 8101 Hollygate Dr, Glenn Dale, MD 20769 - Aircraft: BEECH E33 (Category: Land, Seats: 4, Weight: Up to 12,499 Pounds, Speed: 138 mph), Engine: CONT MOTOR I0-470 SERIES (260 HP) (Reciprocating)
N-Number: 5475U, N5475U, N-5475U, Serial Number: CD-1121, Year manufactured: 1967, Certificate Issue Date: 02/26/2013
Registrant (Co-Owned): Leonard C Rennie, Po Box 42, Glenn Dale, MD 20769, Other Owners: Janice O Rennie - Aircraft: SIMONIAN MARTIN J STDRD HMLTN SII S RG (Category: Land, Seats: 2, Weight: Up to 12,499 Pounds), Engine: LYCOMING I0360 SER (180 HP) (Reciprocating)
N-Number: 627JM, N627JM, N-627JM, Serial Number: IIRGS-2122, Year manufactured: 1996, Airworthiness Date: 06/06/1996, Certificate Issue Date: 04/06/2015
Registrant (LLC): Sastre LLC, 11420 Kedleston Rd, Glenn Dale, MD 20769 - Aircraft: CESSNA 182Q (Category: Land, Seats: 4, Weight: Up to 12,499 Pounds, Speed: 112 mph), Engine: CONT MOTOR O-470 SERIES (230 HP) (Reciprocating)
N-Number: 735UL, N735UL, N-735UL, Serial Number: 18265694, Year manufactured: 1977, Airworthiness Date: 05/13/1977, Certificate Issue Date: 04/03/2013
Registrant (Co-Owned): Matthew Straughn, 6308 Wood Pointe Dr, Glenn Dale, MD 20769, Other Owners: Amber Straughn
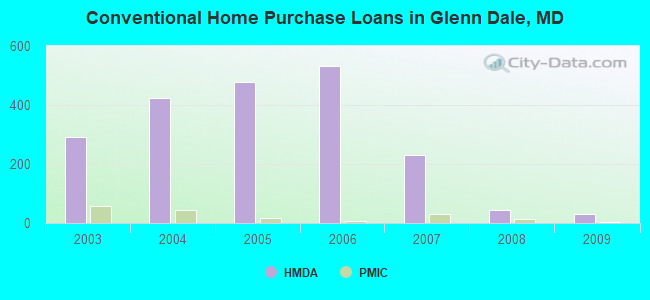
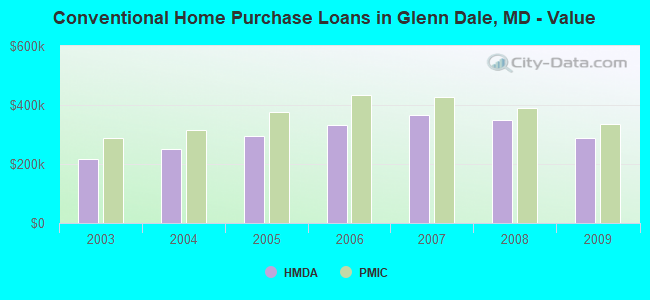
| Home Mortgage Disclosure Act Aggregated Statistics For Year 2009 (Based on 4 partial tracts) | ||||||||||
| A) FHA, FSA/RHS & VA Home Purchase Loans | B) Conventional Home Purchase Loans | C) Refinancings | D) Home Improvement Loans | F) Non-occupant Loans on < 5 Family Dwellings (A B C & D) | ||||||
|---|---|---|---|---|---|---|---|---|---|---|
| Number | Average Value | Number | Average Value | Number | Average Value | Number | Average Value | Number | Average Value | |
| LOANS ORIGINATED | 68 | $342,810 | 30 | $289,226 | 236 | $278,387 | 12 | $114,301 | 8 | $241,686 |
| APPLICATIONS APPROVED, NOT ACCEPTED | 4 | $281,238 | 1 | $357,090 | 25 | $298,720 | 3 | $178,577 | 1 | $137,990 |
| APPLICATIONS DENIED | 20 | $321,794 | 12 | $318,749 | 136 | $331,153 | 9 | $78,652 | 4 | $223,380 |
| APPLICATIONS WITHDRAWN | 13 | $311,366 | 5 | $309,632 | 86 | $295,276 | 3 | $129,793 | 3 | $191,277 |
| FILES CLOSED FOR INCOMPLETENESS | 3 | $299,833 | 3 | $291,890 | 21 | $279,384 | 3 | $226,853 | 0 | $0 |
Detailed HMDA statistics for the following Tracts: 8004.06 , 8004.07, 8004.08, 8004.09
| Private Mortgage Insurance Companies Aggregated Statistics For Year 2009 (Based on 4 partial tracts) | ||||
| A) Conventional Home Purchase Loans | B) Refinancings | |||
|---|---|---|---|---|
| Number | Average Value | Number | Average Value | |
| LOANS ORIGINATED | 3 | $336,493 | 5 | $378,820 |
| APPLICATIONS APPROVED, NOT ACCEPTED | 1 | $156,410 | 5 | $398,180 |
| APPLICATIONS DENIED | 4 | $363,520 | 0 | $0 |
| APPLICATIONS WITHDRAWN | 0 | $0 | 0 | $0 |
| FILES CLOSED FOR INCOMPLETENESS | 0 | $0 | 0 | $0 |
Detailed PMIC statistics for the following Tracts: 8004.06 , 8004.07, 8004.08, 8004.09
2009 - 2018 National Fire Incident Reporting System (NFIRS) incidents
- Fire incident types reported to NFIRS in Glenn Dale, MD
- 8245.8%Structure Fires
- 4324.0%Outside Fires
- 3720.7%Other
- 179.5%Mobile Property/Vehicle Fires
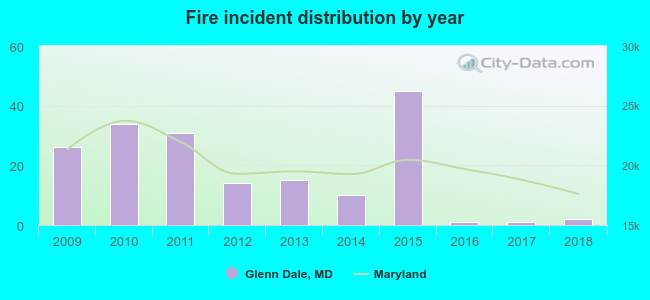 Based on the data from the years 2009 - 2018 the average number of fire incidents per year is 18. The highest number of fires - 45 took place in 2015, and the least - 1 in 2016. The data has a dropping trend.
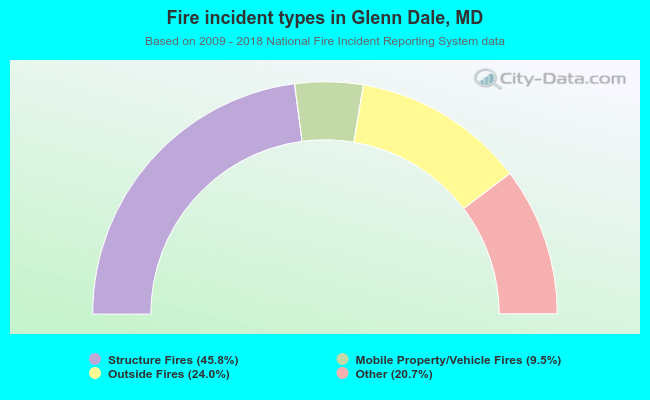 When looking into fire subcategories, the most incidents belonged to: Structure Fires (45.8%), and Outside Fires (24.0%).
| Most common first names in Glenn Dale, MD among deceased individuals | ||
| Name | Count | Lived (average) |
|---|---|---|
| William | 35 | 73.2 years |
| James | 21 | 76.5 years |
| John | 20 | 71.9 years |
| Mary | 18 | 81.7 years |
| Robert | 16 | 67.5 years |
| George | 14 | 74.6 years |
| Dorothy | 12 | 76.2 years |
| Margaret | 11 | 75.1 years |
| Charles | 11 | 71.9 years |
| Elizabeth | 9 | 78.3 years |
| Most common last names in Glenn Dale, MD among deceased individuals | ||
| Last name | Count | Lived (average) |
|---|---|---|
| Smith | 12 | 65.9 years |
| Brown | 11 | 71.8 years |
| Bell | 9 | 78.1 years |
| Jackson | 7 | 78.9 years |
| King | 7 | 72.0 years |
| Jones | 7 | 70.9 years |
| Moore | 7 | 79.1 years |
| Lee | 7 | 77.8 years |
| Collins | 6 | 72.1 years |
| Stewart | 6 | 70.7 years |
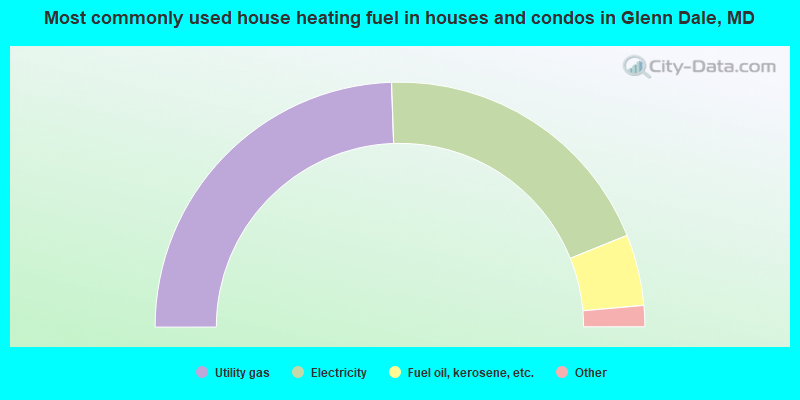
- 48.9%Utility gas
- 38.9%Electricity
- 9.4%Fuel oil, kerosene, etc.
- 1.5%Bottled, tank, or LP gas
- 1.0%Wood
- 0.4%Solar energy
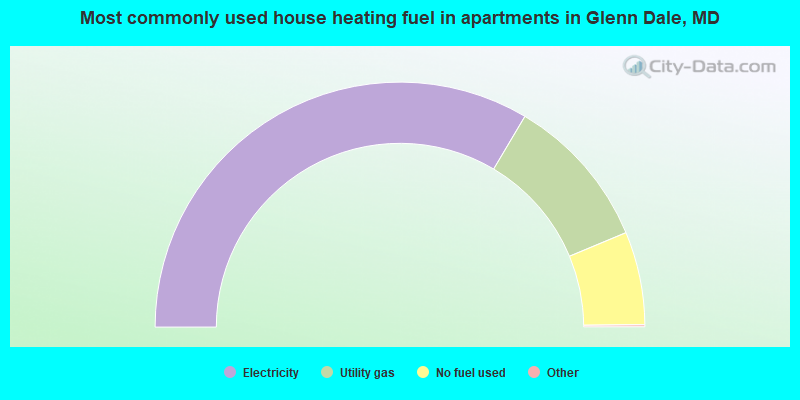
- 67.2%Electricity
- 20.4%Utility gas
- 12.3%No fuel used
Glenn Dale compared to Maryland state average:
- Unemployed percentage significantly below state average.
- Black race population percentage above state average.
- Hispanic race population percentage above state average.
- Median age above state average.
- Foreign-born population percentage above state average.
- Renting percentage below state average.
- Number of rooms per house above state average.
- House age below state average.
- Percentage of population with a bachelor's degree or higher above state average.
Glenn Dale on our top lists:
- #11 on the list of "Top 101 cities with the most residents born in Sierra Leone (population 500+)"
- #24 on the list of "Top 101 cities with the most residents born in Middle Africa (population 500+)"
- #38 on the list of "Top 101 cities with the most residents born in Western Africa (population 500+)"
- #47 on the list of "Top 101 cities with the most residents born in Africa (population 500+)"
- #56 on the list of "Top 101 cities with the largest percentage of elementary and middle school students in private schools (1,000+ students)"
- #57 on the list of "Top 101 cities with the most residents born in Africa, n.e.c. (population 500+)"
- #79 on the list of "Top 101 cities with the most residents born in Nicaragua (population 500+)"
- #81 on the list of "Top 101 cities with the most residents born in Nigeria (population 500+)"
- #84 on the list of "Top 101 cities with the most residents born in Ghana (population 500+)"
- #5 on the list of "Top 101 counties with highest percentage of residents voting for Obama (Democrat) in the 2012 Presidential Election"
- #12 on the list of "Top 101 counties with the highest number of infant deaths per 1000 residents 2007-2013 (pop. 50,000+)"
- #13 on the list of "Top 101 counties with the highest average weight of females"
- #14 on the list of "Top 101 counties with the highest Nitrogen Dioxide air pollution readings in 2012 (ppm)"
- #14 on the list of "Top 101 counties with the most Black Protestant adherents"

|
|
Total of 34 patent applications in 2008-2024.