Mitchellville, Maryland Submit your own pictures of this place and show them to the world
OSM Map
General Map
Google Map
MSN Map
OSM Map
General Map
Google Map
MSN Map
OSM Map
General Map
Google Map
MSN Map
OSM Map
General Map
Google Map
MSN Map
Please wait while loading the map...
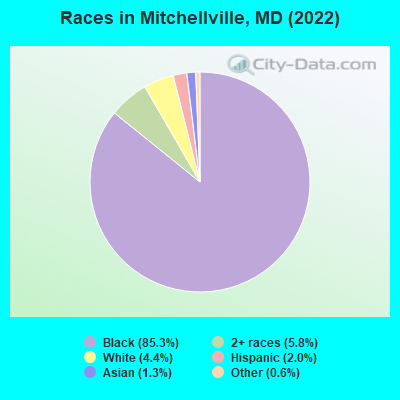
Population in 2010: 10,967. Population change since 2000: +14.1%Males: 5,309 Females: 5,658
March 2022 cost of living index in Mitchellville: 161.1 (very high, U.S. average is 100) Percentage of residents living in poverty in 2022: 2.9%for White Non-Hispanic residents , 2.9% for Black residents , 4.8% for other race residents , 3.9% for two or more races residents )Business Search - 14 Million verified businesses
Data:
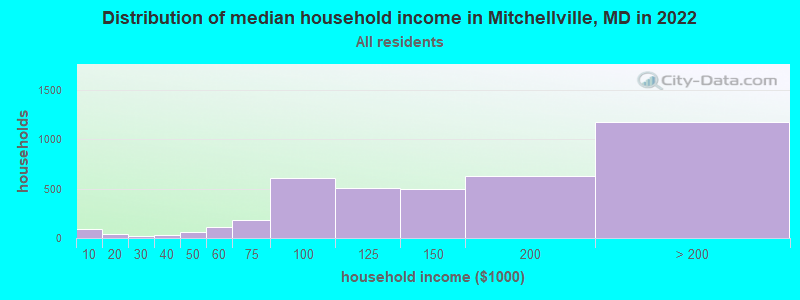
Median household income ($)
Median household income (% change since 2000)
Household income diversity
Ratio of average income to average house value (%)
Ratio of average income to average rent
Median household income ($) - White
Median household income ($) - Black or African American
Median household income ($) - Asian
Median household income ($) - Hispanic or Latino
Median household income ($) - American Indian and Alaska Native
Median household income ($) - Multirace
Median household income ($) - Other Race
Median household income for houses/condos with a mortgage ($)
Median household income for apartments without a mortgage ($)
Races - White alone (%)
Races - White alone (% change since 2000)
Races - Black alone (%)
Races - Black alone (% change since 2000)
Races - American Indian alone (%)
Races - American Indian alone (% change since 2000)
Races - Asian alone (%)
Races - Asian alone (% change since 2000)
Races - Hispanic (%)
Races - Hispanic (% change since 2000)
Races - Native Hawaiian and Other Pacific Islander alone (%)
Races - Native Hawaiian and Other Pacific Islander alone (% change since 2000)
Races - Two or more races (%)
Races - Two or more races (% change since 2000)
Races - Other race alone (%)
Races - Other race alone (% change since 2000)
Racial diversity
Unemployment (%)
Unemployment (% change since 2000)
Unemployment (%) - White
Unemployment (%) - Black or African American
Unemployment (%) - Asian
Unemployment (%) - Hispanic or Latino
Unemployment (%) - American Indian and Alaska Native
Unemployment (%) - Multirace
Unemployment (%) - Other Race
Population density (people per square mile)
Population - Males (%)
Population - Females (%)
Population - Males (%) - White
Population - Males (%) - Black or African American
Population - Males (%) - Asian
Population - Males (%) - Hispanic or Latino
Population - Males (%) - American Indian and Alaska Native
Population - Males (%) - Multirace
Population - Males (%) - Other Race
Population - Females (%) - White
Population - Females (%) - Black or African American
Population - Females (%) - Asian
Population - Females (%) - Hispanic or Latino
Population - Females (%) - American Indian and Alaska Native
Population - Females (%) - Multirace
Population - Females (%) - Other Race
Coronavirus confirmed cases (Apr 27, 2024)
Deaths caused by coronavirus (Apr 27, 2024)
Coronavirus confirmed cases (per 100k population) (Apr 27, 2024)
Deaths caused by coronavirus (per 100k population) (Apr 27, 2024)
Daily increase in number of cases (Apr 27, 2024)
Weekly increase in number of cases (Apr 27, 2024)
Cases doubled (in days) (Apr 27, 2024)
Hospitalized patients (Apr 18, 2022)
Negative test results (Apr 18, 2022)
Total test results (Apr 18, 2022)
COVID Vaccine doses distributed (per 100k population) (Sep 19, 2023)
COVID Vaccine doses administered (per 100k population) (Sep 19, 2023)
COVID Vaccine doses distributed (Sep 19, 2023)
COVID Vaccine doses administered (Sep 19, 2023)
Likely homosexual households (%)
Likely homosexual households (% change since 2000)
Likely homosexual households - Lesbian couples (%)
Likely homosexual households - Lesbian couples (% change since 2000)
Likely homosexual households - Gay men (%)
Likely homosexual households - Gay men (% change since 2000)
Cost of living index
Median gross rent ($)
Median contract rent ($)
Median monthly housing costs ($)
Median house or condo value ($)
Median house or condo value ($ change since 2000)
Mean house or condo value by units in structure - 1, detached ($)
Mean house or condo value by units in structure - 1, attached ($)
Mean house or condo value by units in structure - 2 ($)
Mean house or condo value by units in structure by units in structure - 3 or 4 ($)
Mean house or condo value by units in structure - 5 or more ($)
Mean house or condo value by units in structure - Boat, RV, van, etc. ($)
Mean house or condo value by units in structure - Mobile home ($)
Median house or condo value ($) - White
Median house or condo value ($) - Black or African American
Median house or condo value ($) - Asian
Median house or condo value ($) - Hispanic or Latino
Median house or condo value ($) - American Indian and Alaska Native
Median house or condo value ($) - Multirace
Median house or condo value ($) - Other Race
Median resident age
Resident age diversity
Median resident age - Males
Median resident age - Females
Median resident age - White
Median resident age - Black or African American
Median resident age - Asian
Median resident age - Hispanic or Latino
Median resident age - American Indian and Alaska Native
Median resident age - Multirace
Median resident age - Other Race
Median resident age - Males - White
Median resident age - Males - Black or African American
Median resident age - Males - Asian
Median resident age - Males - Hispanic or Latino
Median resident age - Males - American Indian and Alaska Native
Median resident age - Males - Multirace
Median resident age - Males - Other Race
Median resident age - Females - White
Median resident age - Females - Black or African American
Median resident age - Females - Asian
Median resident age - Females - Hispanic or Latino
Median resident age - Females - American Indian and Alaska Native
Median resident age - Females - Multirace
Median resident age - Females - Other Race
Commute - mean travel time to work (minutes)
Travel time to work - Less than 5 minutes (%)
Travel time to work - Less than 5 minutes (% change since 2000)
Travel time to work - 5 to 9 minutes (%)
Travel time to work - 5 to 9 minutes (% change since 2000)
Travel time to work - 10 to 19 minutes (%)
Travel time to work - 10 to 19 minutes (% change since 2000)
Travel time to work - 20 to 29 minutes (%)
Travel time to work - 20 to 29 minutes (% change since 2000)
Travel time to work - 30 to 39 minutes (%)
Travel time to work - 30 to 39 minutes (% change since 2000)
Travel time to work - 40 to 59 minutes (%)
Travel time to work - 40 to 59 minutes (% change since 2000)
Travel time to work - 60 to 89 minutes (%)
Travel time to work - 60 to 89 minutes (% change since 2000)
Travel time to work - 90 or more minutes (%)
Travel time to work - 90 or more minutes (% change since 2000)
Marital status - Never married (%)
Marital status - Now married (%)
Marital status - Separated (%)
Marital status - Widowed (%)
Marital status - Divorced (%)
Median family income ($)
Median family income (% change since 2000)
Median non-family income ($)
Median non-family income (% change since 2000)
Median per capita income ($)
Median per capita income (% change since 2000)
Median family income ($) - White
Median family income ($) - Black or African American
Median family income ($) - Asian
Median family income ($) - Hispanic or Latino
Median family income ($) - American Indian and Alaska Native
Median family income ($) - Multirace
Median family income ($) - Other Race
Median year house/condo built
Median year apartment built
Year house built - Built 2005 or later (%)
Year house built - Built 2000 to 2004 (%)
Year house built - Built 1990 to 1999 (%)
Year house built - Built 1980 to 1989 (%)
Year house built - Built 1970 to 1979 (%)
Year house built - Built 1960 to 1969 (%)
Year house built - Built 1950 to 1959 (%)
Year house built - Built 1940 to 1949 (%)
Year house built - Built 1939 or earlier (%)
Average household size
Household density (households per square mile)
Average household size - White
Average household size - Black or African American
Average household size - Asian
Average household size - Hispanic or Latino
Average household size - American Indian and Alaska Native
Average household size - Multirace
Average household size - Other Race
Occupied housing units (%)
Vacant housing units (%)
Owner occupied housing units (%)
Renter occupied housing units (%)
Vacancy status - For rent (%)
Vacancy status - For sale only (%)
Vacancy status - Rented or sold, not occupied (%)
Vacancy status - For seasonal, recreational, or occasional use (%)
Vacancy status - For migrant workers (%)
Vacancy status - Other vacant (%)
Residents with income below the poverty level (%)
Residents with income below 50% of the poverty level (%)
Children below poverty level (%)
Poor families by family type - Married-couple family (%)
Poor families by family type - Male, no wife present (%)
Poor families by family type - Female, no husband present (%)
Poverty status for native-born residents (%)
Poverty status for foreign-born residents (%)
Poverty among high school graduates not in families (%)
Poverty among people who did not graduate high school not in families (%)
Residents with income below the poverty level (%) - White
Residents with income below the poverty level (%) - Black or African American
Residents with income below the poverty level (%) - Asian
Residents with income below the poverty level (%) - Hispanic or Latino
Residents with income below the poverty level (%) - American Indian and Alaska Native
Residents with income below the poverty level (%) - Multirace
Residents with income below the poverty level (%) - Other Race
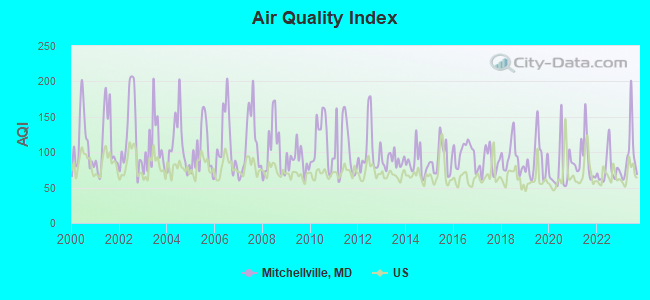
Air pollution - Air Quality Index (AQI)
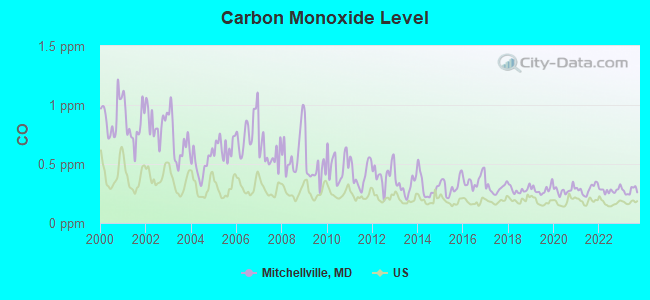
Air pollution - CO
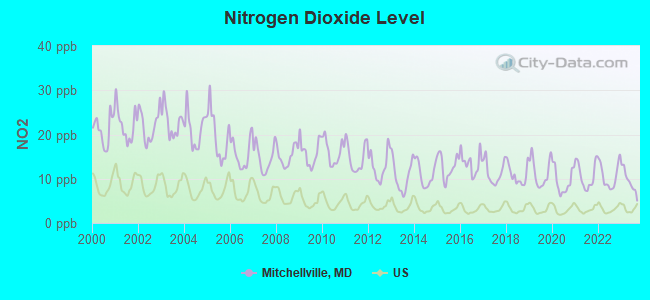
Air pollution - NO2
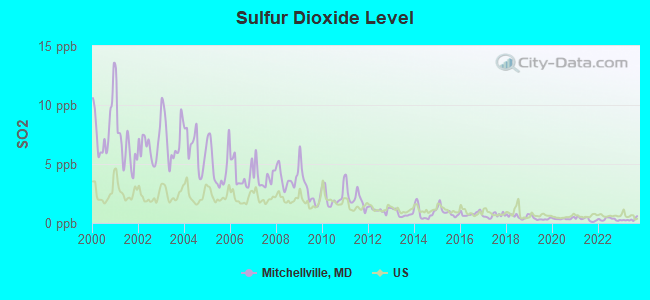
Air pollution - SO2
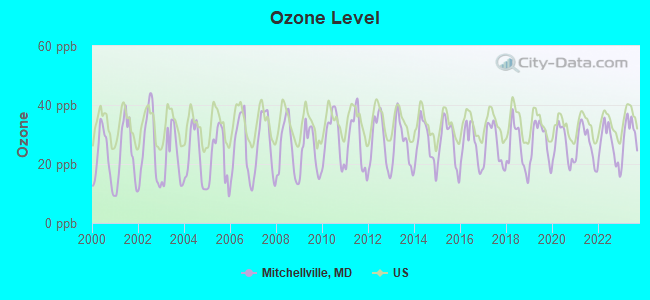
Air pollution - Ozone
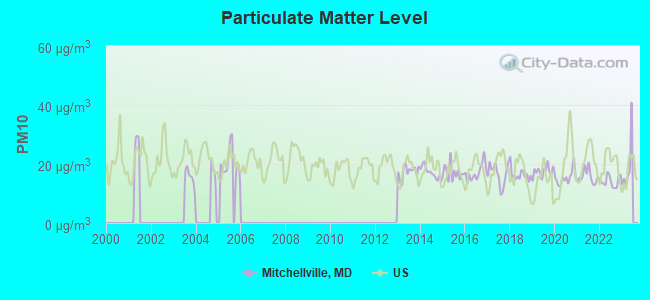
Air pollution - PM10
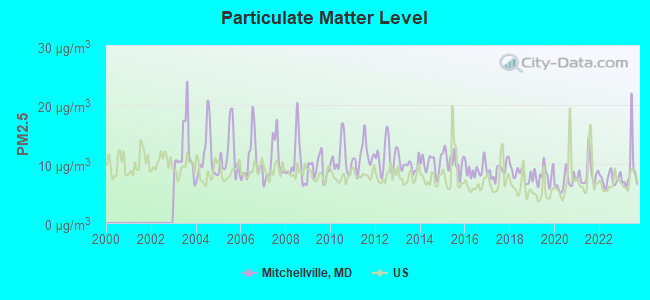
Air pollution - PM25
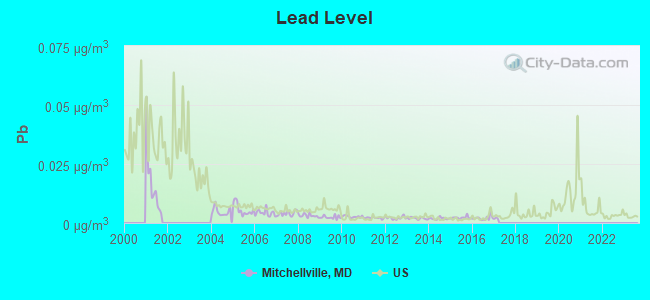
Air pollution - Pb
Crime - Murders per 100,000 population
Crime - Rapes per 100,000 population
Crime - Robberies per 100,000 population
Crime - Assaults per 100,000 population
Crime - Burglaries per 100,000 population
Crime - Thefts per 100,000 population
Crime - Auto thefts per 100,000 population
Crime - Arson per 100,000 population
Crime - City-data.com crime index
Crime - Violent crime index
Crime - Property crime index
Crime - Murders per 100,000 population (5 year average)
Crime - Rapes per 100,000 population (5 year average)
Crime - Robberies per 100,000 population (5 year average)
Crime - Assaults per 100,000 population (5 year average)
Crime - Burglaries per 100,000 population (5 year average)
Crime - Thefts per 100,000 population (5 year average)
Crime - Auto thefts per 100,000 population (5 year average)
Crime - Arson per 100,000 population (5 year average)
Crime - City-data.com crime index (5 year average)
Crime - Violent crime index (5 year average)
Crime - Property crime index (5 year average)
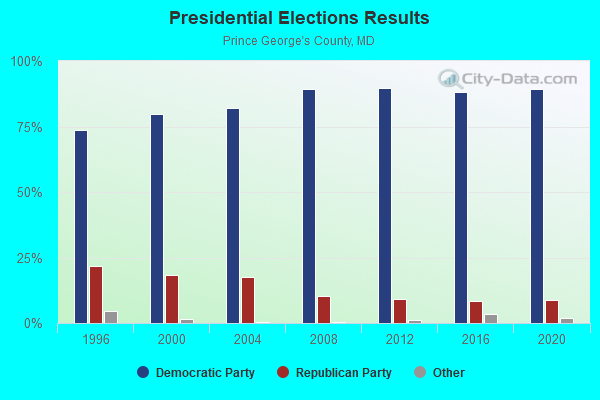
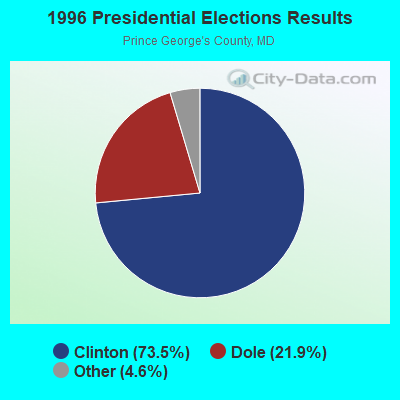
1996 Presidential Elections Results (%) - Democratic Party (Clinton)
1996 Presidential Elections Results (%) - Republican Party (Dole)
1996 Presidential Elections Results (%) - Other
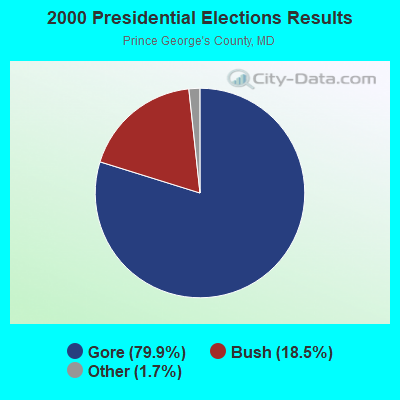
2000 Presidential Elections Results (%) - Democratic Party (Gore)
2000 Presidential Elections Results (%) - Republican Party (Bush)
2000 Presidential Elections Results (%) - Other
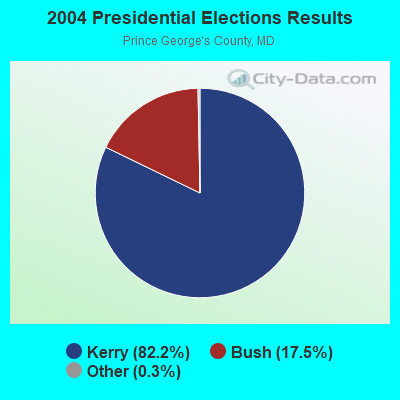
2004 Presidential Elections Results (%) - Democratic Party (Kerry)
2004 Presidential Elections Results (%) - Republican Party (Bush)
2004 Presidential Elections Results (%) - Other
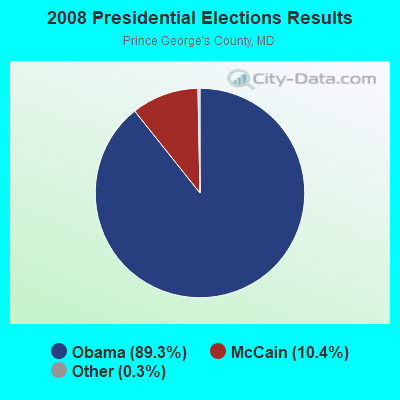
2008 Presidential Elections Results (%) - Democratic Party (Obama)
2008 Presidential Elections Results (%) - Republican Party (McCain)
2008 Presidential Elections Results (%) - Other
2012 Presidential Elections Results (%) - Democratic Party (Obama)
2012 Presidential Elections Results (%) - Republican Party (Romney)
2012 Presidential Elections Results (%) - Other
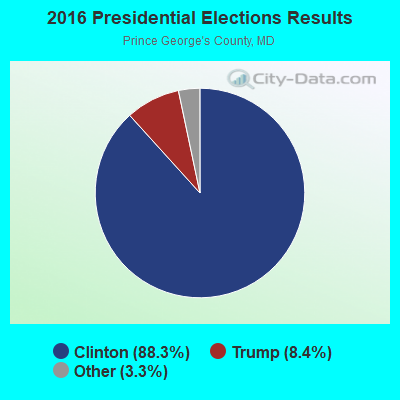
2016 Presidential Elections Results (%) - Democratic Party (Clinton)
2016 Presidential Elections Results (%) - Republican Party (Trump)
2016 Presidential Elections Results (%) - Other
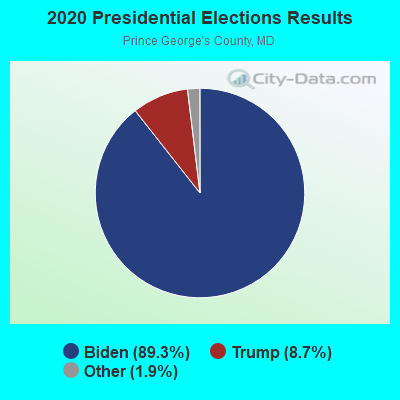
2020 Presidential Elections Results (%) - Democratic Party (Biden)
2020 Presidential Elections Results (%) - Republican Party (Trump)
2020 Presidential Elections Results (%) - Other
Ancestries Reported - Arab (%)
Ancestries Reported - Czech (%)
Ancestries Reported - Danish (%)
Ancestries Reported - Dutch (%)
Ancestries Reported - English (%)
Ancestries Reported - French (%)
Ancestries Reported - French Canadian (%)
Ancestries Reported - German (%)
Ancestries Reported - Greek (%)
Ancestries Reported - Hungarian (%)
Ancestries Reported - Irish (%)
Ancestries Reported - Italian (%)
Ancestries Reported - Lithuanian (%)
Ancestries Reported - Norwegian (%)
Ancestries Reported - Polish (%)
Ancestries Reported - Portuguese (%)
Ancestries Reported - Russian (%)
Ancestries Reported - Scotch-Irish (%)
Ancestries Reported - Scottish (%)
Ancestries Reported - Slovak (%)
Ancestries Reported - Subsaharan African (%)
Ancestries Reported - Swedish (%)
Ancestries Reported - Swiss (%)
Ancestries Reported - Ukrainian (%)
Ancestries Reported - United States (%)
Ancestries Reported - Welsh (%)
Ancestries Reported - West Indian (%)
Ancestries Reported - Other (%)
Educational Attainment - No schooling completed (%)
Educational Attainment - Less than high school (%)
Educational Attainment - High school or equivalent (%)
Educational Attainment - Less than 1 year of college (%)
Educational Attainment - 1 or more years of college (%)
Educational Attainment - Associate degree (%)
Educational Attainment - Bachelor's degree (%)
Educational Attainment - Master's degree (%)
Educational Attainment - Professional school degree (%)
Educational Attainment - Doctorate degree (%)
School Enrollment - Nursery, preschool (%)
School Enrollment - Kindergarten (%)
School Enrollment - Grade 1 to 4 (%)
School Enrollment - Grade 5 to 8 (%)
School Enrollment - Grade 9 to 12 (%)
School Enrollment - College undergrad (%)
School Enrollment - Graduate or professional (%)
School Enrollment - Not enrolled in school (%)
School enrollment - Public schools (%)
School enrollment - Private schools (%)
School enrollment - Not enrolled (%)
Median number of rooms in houses and condos
Median number of rooms in apartments
Housing units lacking complete plumbing facilities (%)
Housing units lacking complete kitchen facilities (%)
Density of houses
Urban houses (%)
Rural houses (%)
Households with people 60 years and over (%)
Households with people 65 years and over (%)
Households with people 75 years and over (%)
Households with one or more nonrelatives (%)
Households with no nonrelatives (%)
Population in households (%)
Family households (%)
Nonfamily households (%)
Population in families (%)
Family households with own children (%)
Median number of bedrooms in owner occupied houses
Mean number of bedrooms in owner occupied houses
Median number of bedrooms in renter occupied houses
Mean number of bedrooms in renter occupied houses
Median number of vehichles in owner occupied houses
Mean number of vehichles in owner occupied houses
Median number of vehichles in renter occupied houses
Mean number of vehichles in renter occupied houses
Mortgage status - with mortgage (%)
Mortgage status - with second mortgage (%)
Mortgage status - with home equity loan (%)
Mortgage status - with both second mortgage and home equity loan (%)
Mortgage status - without a mortgage (%)
Average family size
Average family size - White
Average family size - Black or African American
Average family size - Asian
Average family size - Hispanic or Latino
Average family size - American Indian and Alaska Native
Average family size - Multirace
Average family size - Other Race
Geographical mobility - Same house 1 year ago (%)
Geographical mobility - Moved within same county (%)
Geographical mobility - Moved from different county within same state (%)
Geographical mobility - Moved from different state (%)
Geographical mobility - Moved from abroad (%)
Place of birth - Born in state of residence (%)
Place of birth - Born in other state (%)
Place of birth - Native, outside of US (%)
Place of birth - Foreign born (%)
Housing units in structures - 1, detached (%)
Housing units in structures - 1, attached (%)
Housing units in structures - 2 (%)
Housing units in structures - 3 or 4 (%)
Housing units in structures - 5 to 9 (%)
Housing units in structures - 10 to 19 (%)
Housing units in structures - 20 to 49 (%)
Housing units in structures - 50 or more (%)
Housing units in structures - Mobile home (%)
Housing units in structures - Boat, RV, van, etc. (%)
House/condo owner moved in on average (years ago)
Renter moved in on average (years ago)
Year householder moved into unit - Moved in 1999 to March 2000 (%)
Year householder moved into unit - Moved in 1995 to 1998 (%)
Year householder moved into unit - Moved in 1990 to 1994 (%)
Year householder moved into unit - Moved in 1980 to 1989 (%)
Year householder moved into unit - Moved in 1970 to 1979 (%)
Year householder moved into unit - Moved in 1969 or earlier (%)
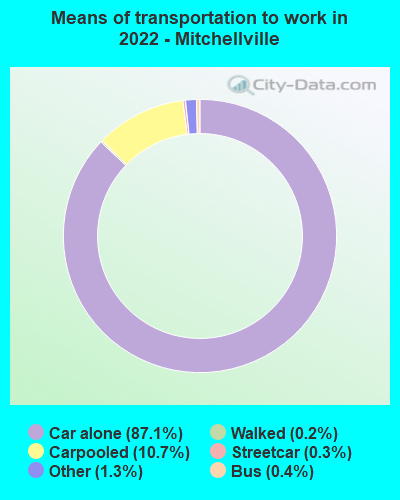
Means of transportation to work - Drove car alone (%)
Means of transportation to work - Carpooled (%)
Means of transportation to work - Public transportation (%)
Means of transportation to work - Bus or trolley bus (%)
Means of transportation to work - Streetcar or trolley car (%)
Means of transportation to work - Subway or elevated (%)
Means of transportation to work - Railroad (%)
Means of transportation to work - Ferryboat (%)
Means of transportation to work - Taxicab (%)
Means of transportation to work - Motorcycle (%)
Means of transportation to work - Bicycle (%)
Means of transportation to work - Walked (%)
Means of transportation to work - Other means (%)
Working at home (%)
Industry diversity
Most Common Industries - Agriculture, forestry, fishing and hunting, and mining (%)
Most Common Industries - Agriculture, forestry, fishing and hunting (%)
Most Common Industries - Mining, quarrying, and oil and gas extraction (%)
Most Common Industries - Construction (%)
Most Common Industries - Manufacturing (%)
Most Common Industries - Wholesale trade (%)
Most Common Industries - Retail trade (%)
Most Common Industries - Transportation and warehousing, and utilities (%)
Most Common Industries - Transportation and warehousing (%)
Most Common Industries - Utilities (%)
Most Common Industries - Information (%)
Most Common Industries - Finance and insurance, and real estate and rental and leasing (%)
Most Common Industries - Finance and insurance (%)
Most Common Industries - Real estate and rental and leasing (%)
Most Common Industries - Professional, scientific, and management, and administrative and waste management services (%)
Most Common Industries - Professional, scientific, and technical services (%)
Most Common Industries - Management of companies and enterprises (%)
Most Common Industries - Administrative and support and waste management services (%)
Most Common Industries - Educational services, and health care and social assistance (%)
Most Common Industries - Educational services (%)
Most Common Industries - Health care and social assistance (%)
Most Common Industries - Arts, entertainment, and recreation, and accommodation and food services (%)
Most Common Industries - Arts, entertainment, and recreation (%)
Most Common Industries - Accommodation and food services (%)
Most Common Industries - Other services, except public administration (%)
Most Common Industries - Public administration (%)
Occupation diversity
Most Common Occupations - Management, business, science, and arts occupations (%)
Most Common Occupations - Management, business, and financial occupations (%)
Most Common Occupations - Management occupations (%)
Most Common Occupations - Business and financial operations occupations (%)
Most Common Occupations - Computer, engineering, and science occupations (%)
Most Common Occupations - Computer and mathematical occupations (%)
Most Common Occupations - Architecture and engineering occupations (%)
Most Common Occupations - Life, physical, and social science occupations (%)
Most Common Occupations - Education, legal, community service, arts, and media occupations (%)
Most Common Occupations - Community and social service occupations (%)
Most Common Occupations - Legal occupations (%)
Most Common Occupations - Education, training, and library occupations (%)
Most Common Occupations - Arts, design, entertainment, sports, and media occupations (%)
Most Common Occupations - Healthcare practitioners and technical occupations (%)
Most Common Occupations - Health diagnosing and treating practitioners and other technical occupations (%)
Most Common Occupations - Health technologists and technicians (%)
Most Common Occupations - Service occupations (%)
Most Common Occupations - Healthcare support occupations (%)
Most Common Occupations - Protective service occupations (%)
Most Common Occupations - Fire fighting and prevention, and other protective service workers including supervisors (%)
Most Common Occupations - Law enforcement workers including supervisors (%)
Most Common Occupations - Food preparation and serving related occupations (%)
Most Common Occupations - Building and grounds cleaning and maintenance occupations (%)
Most Common Occupations - Personal care and service occupations (%)
Most Common Occupations - Sales and office occupations (%)
Most Common Occupations - Sales and related occupations (%)
Most Common Occupations - Office and administrative support occupations (%)
Most Common Occupations - Natural resources, construction, and maintenance occupations (%)
Most Common Occupations - Farming, fishing, and forestry occupations (%)
Most Common Occupations - Construction and extraction occupations (%)
Most Common Occupations - Installation, maintenance, and repair occupations (%)
Most Common Occupations - Production, transportation, and material moving occupations (%)
Most Common Occupations - Production occupations (%)
Most Common Occupations - Transportation occupations (%)
Most Common Occupations - Material moving occupations (%)
People in Group quarters - Institutionalized population (%)
People in Group quarters - Correctional institutions (%)
People in Group quarters - Federal prisons and detention centers (%)
People in Group quarters - Halfway houses (%)
People in Group quarters - Local jails and other confinement facilities (including police lockups) (%)
People in Group quarters - Military disciplinary barracks (%)
People in Group quarters - State prisons (%)
People in Group quarters - Other types of correctional institutions (%)
People in Group quarters - Nursing homes (%)
People in Group quarters - Hospitals/wards, hospices, and schools for the handicapped (%)
People in Group quarters - Hospitals/wards and hospices for chronically ill (%)
People in Group quarters - Hospices or homes for chronically ill (%)
People in Group quarters - Military hospitals or wards for chronically ill (%)
People in Group quarters - Other hospitals or wards for chronically ill (%)
People in Group quarters - Hospitals or wards for drug/alcohol abuse (%)
People in Group quarters - Mental (Psychiatric) hospitals or wards (%)
People in Group quarters - Schools, hospitals, or wards for the mentally retarded (%)
People in Group quarters - Schools, hospitals, or wards for the physically handicapped (%)
People in Group quarters - Institutions for the deaf (%)
People in Group quarters - Institutions for the blind (%)
People in Group quarters - Orthopedic wards and institutions for the physically handicapped (%)
People in Group quarters - Wards in general hospitals for patients who have no usual home elsewhere (%)
People in Group quarters - Wards in military hospitals for patients who have no usual home elsewhere (%)
People in Group quarters - Juvenile institutions (%)
People in Group quarters - Long-term care (%)
People in Group quarters - Homes for abused, dependent, and neglected children (%)
People in Group quarters - Residential treatment centers for emotionally disturbed children (%)
People in Group quarters - Training schools for juvenile delinquents (%)
People in Group quarters - Short-term care, detention or diagnostic centers for delinquent children (%)
People in Group quarters - Type of juvenile institution unknown (%)
People in Group quarters - Noninstitutionalized population (%)
People in Group quarters - College dormitories (includes college quarters off campus) (%)
People in Group quarters - Military quarters (%)
People in Group quarters - On base (%)
People in Group quarters - Barracks, unaccompanied personnel housing (UPH), (Enlisted/Officer), ;and similar group living quarters for military personnel (%)
People in Group quarters - Transient quarters for temporary residents (%)
People in Group quarters - Military ships (%)
People in Group quarters - Group homes (%)
People in Group quarters - Homes or halfway houses for drug/alcohol abuse (%)
People in Group quarters - Homes for the mentally ill (%)
People in Group quarters - Homes for the mentally retarded (%)
People in Group quarters - Homes for the physically handicapped (%)
People in Group quarters - Other group homes (%)
People in Group quarters - Religious group quarters (%)
People in Group quarters - Dormitories (%)
People in Group quarters - Agriculture workers' dormitories on farms (%)
People in Group quarters - Job Corps and vocational training facilities (%)
People in Group quarters - Other workers' dormitories (%)
People in Group quarters - Crews of maritime vessels (%)
People in Group quarters - Other nonhousehold living situations (%)
People in Group quarters - Other noninstitutional group quarters (%)
Residents speaking English at home (%)
Residents speaking English at home - Born in the United States (%)
Residents speaking English at home - Native, born elsewhere (%)
Residents speaking English at home - Foreign born (%)
Residents speaking Spanish at home (%)
Residents speaking Spanish at home - Born in the United States (%)
Residents speaking Spanish at home - Native, born elsewhere (%)
Residents speaking Spanish at home - Foreign born (%)
Residents speaking other language at home (%)
Residents speaking other language at home - Born in the United States (%)
Residents speaking other language at home - Native, born elsewhere (%)
Residents speaking other language at home - Foreign born (%)
Class of Workers - Employee of private company (%)
Class of Workers - Self-employed in own incorporated business (%)
Class of Workers - Private not-for-profit wage and salary workers (%)
Class of Workers - Local government workers (%)
Class of Workers - State government workers (%)
Class of Workers - Federal government workers (%)
Class of Workers - Self-employed workers in own not incorporated business and Unpaid family workers (%)
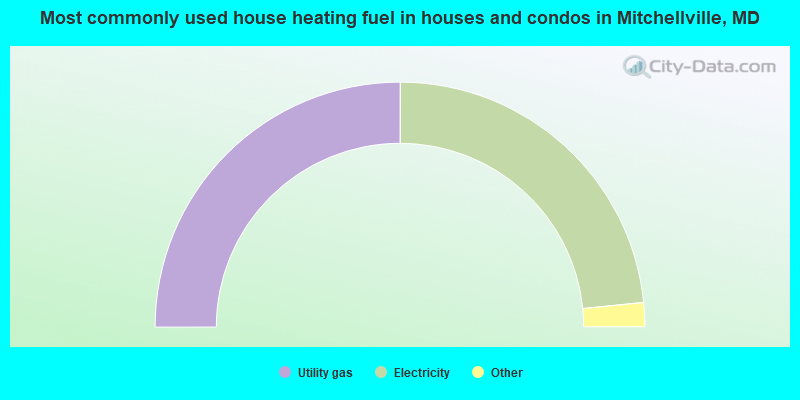
House heating fuel used in houses and condos - Utility gas (%)
House heating fuel used in houses and condos - Bottled, tank, or LP gas (%)
House heating fuel used in houses and condos - Electricity (%)
House heating fuel used in houses and condos - Fuel oil, kerosene, etc. (%)
House heating fuel used in houses and condos - Coal or coke (%)
House heating fuel used in houses and condos - Wood (%)
House heating fuel used in houses and condos - Solar energy (%)
House heating fuel used in houses and condos - Other fuel (%)
House heating fuel used in houses and condos - No fuel used (%)
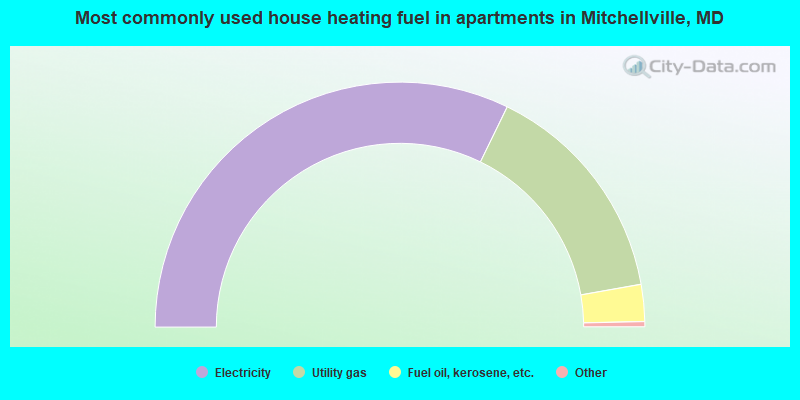
House heating fuel used in apartments - Utility gas (%)
House heating fuel used in apartments - Bottled, tank, or LP gas (%)
House heating fuel used in apartments - Electricity (%)
House heating fuel used in apartments - Fuel oil, kerosene, etc. (%)
House heating fuel used in apartments - Coal or coke (%)
House heating fuel used in apartments - Wood (%)
House heating fuel used in apartments - Solar energy (%)
House heating fuel used in apartments - Other fuel (%)
House heating fuel used in apartments - No fuel used (%)
Armed forces status - In Armed Forces (%)
Armed forces status - Civilian (%)
Armed forces status - Civilian - Veteran (%)
Armed forces status - Civilian - Nonveteran (%)
Fatal accidents locations in years 2005-2021
Fatal accidents locations in 2005
Fatal accidents locations in 2006
Fatal accidents locations in 2007
Fatal accidents locations in 2008
Fatal accidents locations in 2009
Fatal accidents locations in 2010
Fatal accidents locations in 2011
Fatal accidents locations in 2012
Fatal accidents locations in 2013
Fatal accidents locations in 2014
Fatal accidents locations in 2015
Fatal accidents locations in 2016
Fatal accidents locations in 2017
Fatal accidents locations in 2018
Fatal accidents locations in 2019
Fatal accidents locations in 2020
Fatal accidents locations in 2021
Alcohol use - People drinking some alcohol every month (%)
Alcohol use - People not drinking at all (%)
Alcohol use - Average days/month drinking alcohol
Alcohol use - Average drinks/week
Alcohol use - Average days/year people drink much
Audiometry - Average condition of hearing (%)
Audiometry - People that can hear a whisper from across a quiet room (%)
Audiometry - People that can hear normal voice from across a quiet room (%)
Audiometry - Ears ringing, roaring, buzzing (%)
Audiometry - Had a job exposure to loud noise (%)
Audiometry - Had off-work exposure to loud noise (%)
Blood Pressure & Cholesterol - Has high blood pressure (%)
Blood Pressure & Cholesterol - Checking blood pressure at home (%)
Blood Pressure & Cholesterol - Frequently checking blood cholesterol (%)
Blood Pressure & Cholesterol - Has high cholesterol level (%)
Consumer Behavior - Money monthly spent on food at supermarket/grocery store
Consumer Behavior - Money monthly spent on food at other stores
Consumer Behavior - Money monthly spent on eating out
Consumer Behavior - Money monthly spent on carryout/delivered foods
Consumer Behavior - Income spent on food at supermarket/grocery store (%)
Consumer Behavior - Income spent on food at other stores (%)
Consumer Behavior - Income spent on eating out (%)
Consumer Behavior - Income spent on carryout/delivered foods (%)
Current Health Status - General health condition (%)
Current Health Status - Blood donors (%)
Current Health Status - Has blood ever tested for HIV virus (%)
Current Health Status - Left-handed people (%)
Dermatology - People using sunscreen (%)
Diabetes - Diabetics (%)
Diabetes - Had a blood test for high blood sugar (%)
Diabetes - People taking insulin (%)
Diet Behavior & Nutrition - Diet health (%)
Diet Behavior & Nutrition - Milk product consumption (# of products/month)
Diet Behavior & Nutrition - Meals not home prepared (#/week)
Diet Behavior & Nutrition - Meals from fast food or pizza place (#/week)
Diet Behavior & Nutrition - Ready-to-eat foods (#/month)
Diet Behavior & Nutrition - Frozen meals/pizza (#/month)
Drug Use - People that ever used marijuana or hashish (%)
Drug Use - Ever used hard drugs (%)
Drug Use - Ever used any form of cocaine (%)
Drug Use - Ever used heroin (%)
Drug Use - Ever used methamphetamine (%)
Health Insurance - People covered by health insurance (%)
Kidney Conditions-Urology - Avg. # of times urinating at night
Medical Conditions - People with asthma (%)
Medical Conditions - People with anemia (%)
Medical Conditions - People with psoriasis (%)
Medical Conditions - People with overweight (%)
Medical Conditions - Elderly people having difficulties in thinking or remembering (%)
Medical Conditions - People who ever received blood transfusion (%)
Medical Conditions - People having trouble seeing even with glass/contacts (%)
Medical Conditions - People with arthritis (%)
Medical Conditions - People with gout (%)
Medical Conditions - People with congestive heart failure (%)
Medical Conditions - People with coronary heart disease (%)
Medical Conditions - People with angina pectoris (%)
Medical Conditions - People who ever had heart attack (%)
Medical Conditions - People who ever had stroke (%)
Medical Conditions - People with emphysema (%)
Medical Conditions - People with thyroid problem (%)
Medical Conditions - People with chronic bronchitis (%)
Medical Conditions - People with any liver condition (%)
Medical Conditions - People who ever had cancer or malignancy (%)
Mental Health - People who have little interest in doing things (%)
Mental Health - People feeling down, depressed, or hopeless (%)
Mental Health - People who have trouble sleeping or sleeping too much (%)
Mental Health - People feeling tired or having little energy (%)
Mental Health - People with poor appetite or overeating (%)
Mental Health - People feeling bad about themself (%)
Mental Health - People who have trouble concentrating on things (%)
Mental Health - People moving or speaking slowly or too fast (%)
Mental Health - People having thoughts they would be better off dead (%)
Oral Health - Average years since last visit a dentist
Oral Health - People embarrassed because of mouth (%)
Oral Health - People with gum disease (%)
Oral Health - General health of teeth and gums (%)
Oral Health - Average days a week using dental floss/device
Oral Health - Average days a week using mouthwash for dental problem
Oral Health - Average number of teeth
Pesticide Use - Households using pesticides to control insects (%)
Pesticide Use - Households using pesticides to kill weeds (%)
Physical Activity - People doing vigorous-intensity work activities (%)
Physical Activity - People doing moderate-intensity work activities (%)
Physical Activity - People walking or bicycling (%)
Physical Activity - People doing vigorous-intensity recreational activities (%)
Physical Activity - People doing moderate-intensity recreational activities (%)
Physical Activity - Average hours a day doing sedentary activities
Physical Activity - Average hours a day watching TV or videos
Physical Activity - Average hours a day using computer
Physical Functioning - People having limitations keeping them from working (%)
Physical Functioning - People limited in amount of work they can do (%)
Physical Functioning - People that need special equipment to walk (%)
Physical Functioning - People experiencing confusion/memory problems (%)
Physical Functioning - People requiring special healthcare equipment (%)
Prescription Medications - Average number of prescription medicines taking
Preventive Aspirin Use - Adults 40+ taking low-dose aspirin (%)
Reproductive Health - Vaginal deliveries (%)
Reproductive Health - Cesarean deliveries (%)
Reproductive Health - Deliveries resulted in a live birth (%)
Reproductive Health - Pregnancies resulted in a delivery (%)
Reproductive Health - Women breastfeeding newborns (%)
Reproductive Health - Women that had a hysterectomy (%)
Reproductive Health - Women that had both ovaries removed (%)
Reproductive Health - Women that have ever taken birth control pills (%)
Reproductive Health - Women taking birth control pills (%)
Reproductive Health - Women that have ever used Depo-Provera or injectables (%)
Reproductive Health - Women that have ever used female hormones (%)
Sexual Behavior - People 18+ that ever had sex (vaginal, anal, or oral) (%)
Sexual Behavior - Males 18+ that ever had vaginal sex with a woman (%)
Sexual Behavior - Males 18+ that ever performed oral sex on a woman (%)
Sexual Behavior - Males 18+ that ever had anal sex with a woman (%)
Sexual Behavior - Males 18+ that ever had any sex with a man (%)
Sexual Behavior - Females 18+ that ever had vaginal sex with a man (%)
Sexual Behavior - Females 18+ that ever performed oral sex on a man (%)
Sexual Behavior - Females 18+ that ever had anal sex with a man (%)
Sexual Behavior - Females 18+ that ever had any kind of sex with a woman (%)
Sexual Behavior - Average age people first had sex
Sexual Behavior - Average number of female sex partners in lifetime (males 18+)
Sexual Behavior - Average number of female vaginal sex partners in lifetime (males 18+)
Sexual Behavior - Average age people first performed oral sex on a woman (18+)
Sexual Behavior - Average number of woman performed oral sex on in lifetime (18+)
Sexual Behavior - Average number of male sex partners in lifetime (males 18+)
Sexual Behavior - Average number of male anal sex partners in lifetime (males 18+)
Sexual Behavior - Average age people first performed oral sex on a man (18+)
Sexual Behavior - Average number of male oral sex partners in lifetime (18+)
Sexual Behavior - People using protection when performing oral sex (%)
Sexual Behavior - Average number of times people have vaginal or anal sex a year
Sexual Behavior - People having sex without condom (%)
Sexual Behavior - Average number of male sex partners in lifetime (females 18+)
Sexual Behavior - Average number of male vaginal sex partners in lifetime (females 18+)
Sexual Behavior - Average number of female sex partners in lifetime (females 18+)
Sexual Behavior - Circumcised males 18+ (%)
Sleep Disorders - Average hours sleeping at night
Sleep Disorders - People that has trouble sleeping (%)
Smoking-Cigarette Use - People smoking cigarettes (%)
Taste & Smell - People 40+ having problems with smell (%)
Taste & Smell - People 40+ having problems with taste (%)
Taste & Smell - People 40+ that ever had wisdom teeth removed (%)
Taste & Smell - People 40+ that ever had tonsils teeth removed (%)
Taste & Smell - People 40+ that ever had a loss of consciousness because of a head injury (%)
Taste & Smell - People 40+ that ever had a broken nose or other serious injury to face or skull (%)
Taste & Smell - People 40+ that ever had two or more sinus infections (%)
Weight - Average height (inches)
Weight - Average weight (pounds)
Weight - Average BMI
Weight - People that are obese (%)
Weight - People that ever were obese (%)
Weight - People trying to lose weight (%)
According to our research of Maryland and other state lists, there were 3 registered sex offenders living in Mitchellville, Maryland as of April 27, 2024 . The ratio of all residents to sex offenders in Mitchellville is 3,675 to 1.The ratio of registered sex offenders to all residents in this city is much lower than the state average.
Latest news from Mitchellville, MD collected exclusively by city-data.com from local newspapers, TV, and radio stations
Mitchellville, MD City Guides: Ancestries: Nigerian (6.1%), Jamaican (3.6%), African (2.9%), Haitian (1.4%), American (1.3%), Ugandan (1.0%).
Current Local Time:
Land area: 4.98 square miles.
Population density: 2,203 people per square mile (low).
2,272 residents are foreign born (9.7% Africa , 6.3% Latin America ).
This place:
19.0%Maryland:
15.7%
Median real estate property taxes paid for housing units with mortgages in 2022: $5,138 (1.0%)Median real estate property taxes paid for housing units with no mortgage in 2022: $4,376 (1.1%)
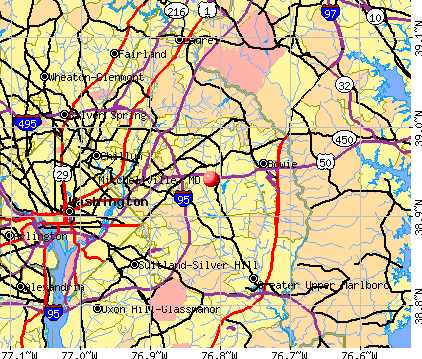
Nearest city with pop. 50,000+: Bowie, MD (4.1 miles
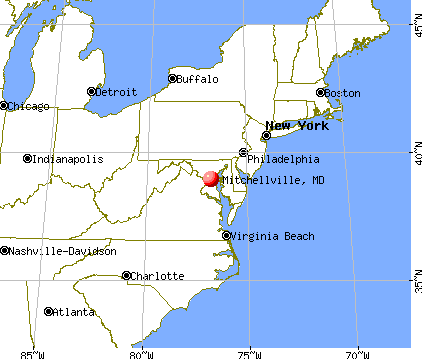
Nearest city with pop. 200,000+: Washington, DC
Nearest city with pop. 1,000,000+: Philadelphia, PA
Nearest cities:
Latitude: 38.94 N, Longitude: 76.81 W
Daytime population change due to commuting: -423 (-3.5%)Workers who live and work in this place: 1,439 (23.2%)
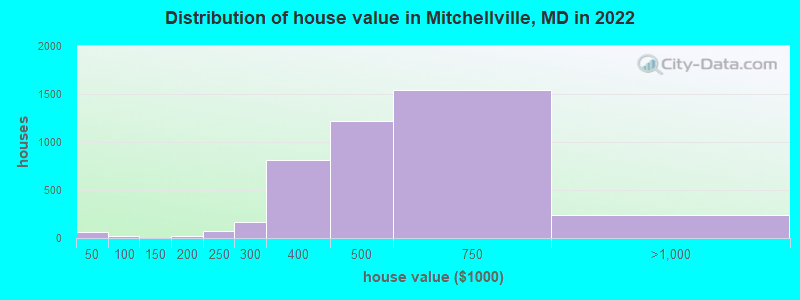
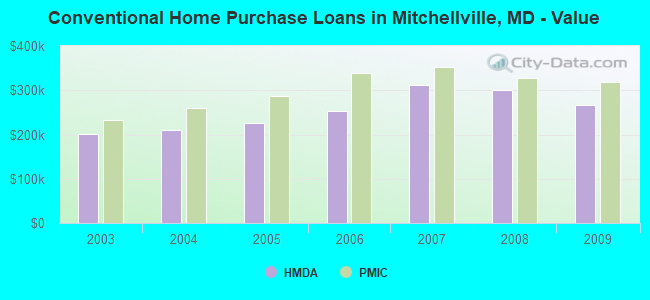
Property values in Mitchellville, MD
Unemployment in December 2023:
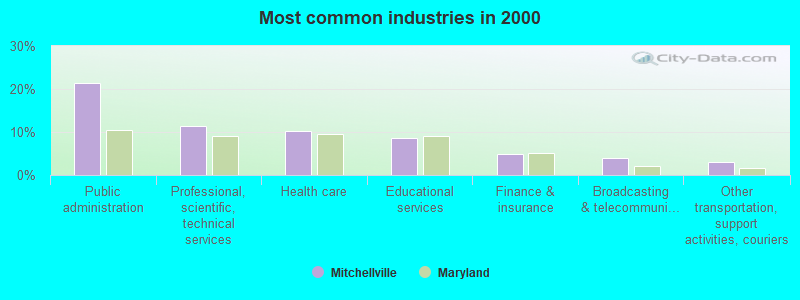
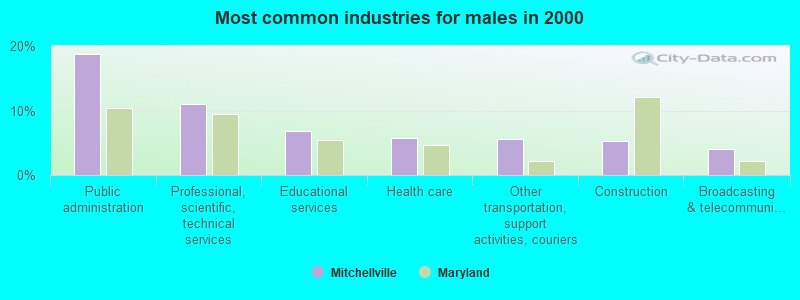
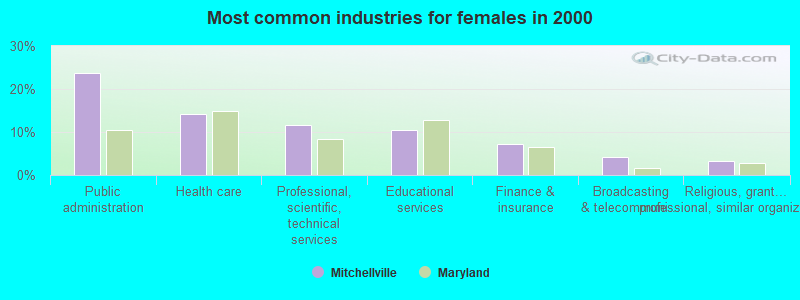
Most common industries in Mitchellville, MD (%)
Both Males Females
Public administration (21.4%)
Professional, scientific, technical services (11.3%)
Health care (10.2%)
Educational services (8.7%)
Finance & insurance (4.8%)
Broadcasting & telecommunications (4.1%)
Other transportation, support activities, couriers (3.0%)
Public administration (18.8%)
Professional, scientific, technical services (11.0%)
Educational services (6.8%)
Health care (5.7%)
Other transportation, support activities, couriers (5.6%)
Construction (5.2%)
Broadcasting & telecommunications (4.0%)
Public administration (23.6%)
Health care (14.1%)
Professional, scientific, technical services (11.6%)
Educational services (10.4%)
Finance & insurance (7.2%)
Broadcasting & telecommunications (4.1%)
Religious, grantmaking, civic, professional, similar organizations (3.2%)
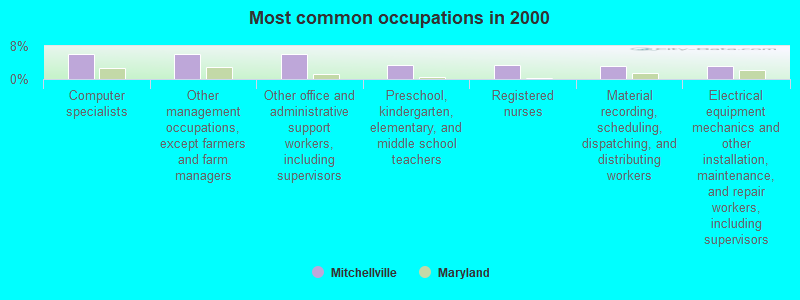
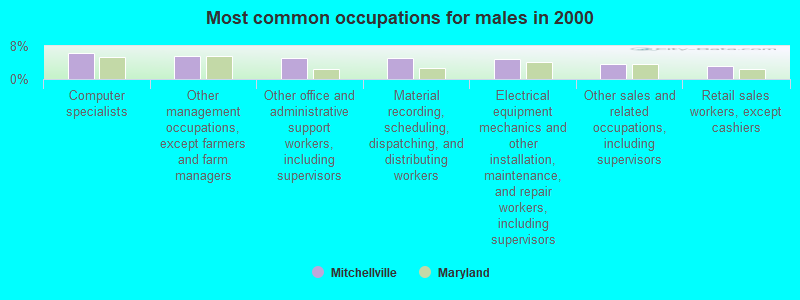
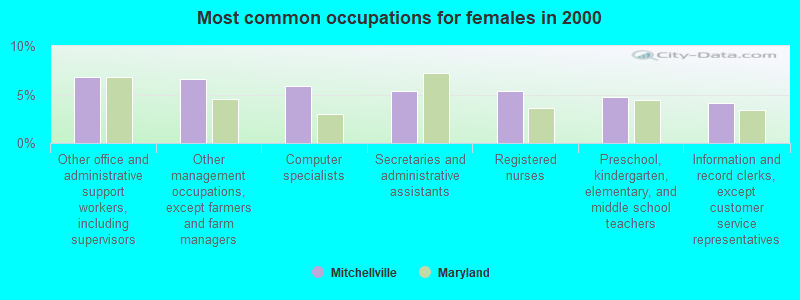
Most common occupations in Mitchellville, MD (%)
Both Males Females
Computer specialists (6.1%)
Other management occupations, except farmers and farm managers (6.1%)
Other office and administrative support workers, including supervisors (6.0%)
Preschool, kindergarten, elementary, and middle school teachers (3.4%)
Registered nurses (3.3%)
Material recording, scheduling, dispatching, and distributing workers (3.1%)
Electrical equipment mechanics and other installation, maintenance, and repair workers, including supervisors (3.1%)
Computer specialists (6.4%)
Other management occupations, except farmers and farm managers (5.5%)
Other office and administrative support workers, including supervisors (5.1%)
Material recording, scheduling, dispatching, and distributing workers (5.1%)
Electrical equipment mechanics and other installation, maintenance, and repair workers, including supervisors (4.8%)
Other sales and related occupations, including supervisors (3.7%)
Retail sales workers, except cashiers (3.2%)
Other office and administrative support workers, including supervisors (6.8%)
Other management occupations, except farmers and farm managers (6.6%)
Computer specialists (5.9%)
Secretaries and administrative assistants (5.4%)
Registered nurses (5.4%)
Preschool, kindergarten, elementary, and middle school teachers (4.8%)
Information and record clerks, except customer service representatives (4.1%)
Tornado activity:
Mitchellville-area historical tornado activity is slightly above Maryland state average. It is 10% greater than the overall U.S. average.
On 9/24/2001, a category F3 (max. wind speeds 158-206 mph) tornado 9.0 miles away from the Mitchellville place center killed 2 people and injured 55 people and caused $101 million in damages.
On 4/28/2002, a category F4 (max. wind speeds 207-260 mph) tornado 33.5 miles away from the place center killed 3 people and injured 122 people and caused $124 million in damages.
Earthquake activity:
Mitchellville-area historical earthquake activity is significantly above Maryland state average. It is 58% smaller than the overall U.S. average. On 8/23/2011 at 17:51:04, a magnitude 5.8 (5.8 MW, Depth: 3.7 mi, Class: Moderate, Intensity: VI - VII) earthquake occurred 93.8 miles away from the city center On 1/16/1994 at 01:49:16, a magnitude 4.6 (4.6 MB, 4.6 LG, Depth: 3.1 mi, Class: Light, Intensity: IV - V) earthquake occurred 104.6 miles away from the city center On 8/25/2011 at 05:07:52, a magnitude 4.5 (4.5 ML, Depth: 4.2 mi) earthquake occurred 92.9 miles away from Mitchellville center On 12/9/2003 at 20:59:18, a magnitude 4.5 (4.5 ML, Depth: 6.2 mi) earthquake occurred 106.7 miles away from Mitchellville center On 12/9/2003 at 20:59:14, a magnitude 4.5 (4.5 MB, 4.5 LG) earthquake occurred 110.8 miles away from the city center On 9/25/1998 at 19:52:52, a magnitude 5.2 (4.8 MB, 4.3 MS, 5.2 LG, 4.5 MW, Depth: 3.1 mi) earthquake occurred 258.6 miles away from the city center Magnitude types: regional Lg-wave magnitude (LG), body-wave magnitude (MB), local magnitude (ML), surface-wave magnitude (MS), moment magnitude (MW) Natural disasters: The number of natural disasters in Prince George's County (16) is near the US average (15).Major Disasters (Presidential) Declared: 11Emergencies Declared: 5Hurricanes: 5, Winter Storms: 5, Snowstorms: 3, Floods: 2, Storms: 2, Tropical Storms: 2, Blizzard: 1, Heavy Rain: 1, Ice Storm: 1, Snowfall: 1 (Note: some incidents may be assigned to more than one category). Hospitals and medical centers in Mitchellville: COLLINGTON EPISCOPAL LIFE CARE (10450 LOTTSFORD ROAD)
VILLA ROSA NURSING HOME (3800 LOTTSFORD VISTA ROAD)
HOLY CROSS DIALYSIS CENTER - WOODMORE (11721 WOODMORE RD STE 190)
Airports located in Mitchellville: Freeway Airport (W00) Runways: , Air Taxi Ops: 15, Itinerant Ops: 1,000, Local Ops: 23,000, Military Ops: 100)Amtrak stations near Mitchellville: 3 miles: NEW CARROLLTON (4300 GARDEN CITY DR.) Services: ticket office, fully wheelchair accessible, enclosed waiting area, public restrooms, public payphones, snack bar, ATM, paid short-term parking, paid long-term parking, call for car rental service, taxi stand, public transit connection.
11 miles: WASHINGTON (50 MASSACHUSETTS AVE. N.E.) Services: ticket office, fully wheelchair accessible, enclosed waiting area, public restrooms, public payphones, full-service food facilities and snack bar, ATM, paid short-term parking, paid long-term parking, car rental agency, taxi stand, public transit connection.
17 miles: ALEXANDRIA (110 CALLAHAN DR.) Services: ticket office, partially wheelchair accessible, enclosed waiting area, public restrooms, public payphones, vending machines, ATM, free short-term parking, free long-term parking, call for car rental service, call for taxi service, public transit connection.
Colleges/universities with over 2000 students nearest to Mitchellville:
Prince George's Community College (about 4 miles; Largo, MD ; Full-time enrollment: 8,537)
Bowie State University (about 7 miles; Bowie, MD ; FT enrollment: 4,517)
University of Maryland-College Park (about 8 miles; College Park, MD ; FT enrollment: 32,734)
University of Maryland-University College (about 9 miles; Adelphi, MD ; FT enrollment: 25,040)
Strayer University-Maryland (about 10 miles; Suitland, MD ; FT enrollment: 2,748)
Catholic University of America (about 10 miles; Washington, DC ; FT enrollment: 5,365)
Howard University (about 12 miles; Washington, DC ; FT enrollment: 7,838)
Public high school in Mitchellville:
Private high school in Mitchellville: WASHINGTON NEW CHURCH SCHOOL Students: 54, Location: 11914 CHANTILLY LN, Grades: PK-10)
Public elementary/middle schools in Mitchellville:
See full list of schools located in Mitchellville
Notable locations in Mitchellville: (A) , Hanson-Palmer Business Park (B) , Eastpoint Metro Business Center (C) , Villa Rosa Nursing Home (D) , Newton White Mansion (E) . Display/hide their locations on the map
Shopping Center: (1) . Display/hide its location on the map
Church in Mitchellville: (A) . Display/hide its location on the map
Streams, rivers, and creeks: (A) , Folly Branch (B) . Display/hide their locations on the map
Parks in Mitchellville include: (1) , Glenn Dale Recreation Center (2) , Folly Branch Park (3) , Enterprise Estates Recreation Center (4) . Display/hide their locations on the map
Birthplace of: Austin Freeman - Basketball player, Calvin Brown - College basketball player (Norfolk State Spartans), Keri Gonsalves - College basketball player (George Washington Colonials), Steve Matthias - Baseball player.
Prince George's County has a predicted average indoor radon screening level between 2 and 4 pCi/L (pico curies per liter) - Moderate Potential Average household size: This place:
2.9 peopleMaryland:
2.6 people
Percentage of family households: This place:
77.2%Whole state:
67.1%
Percentage of households with unmarried partners: This place:
3.7%Whole state:
6.4%
Likely homosexual households (counted as self-reported same-sex unmarried-partner households)
Lesbian couples: 0.3% of all households Gay men: 0.3% of all households
86 people in nursing facilities/skilled-nursing facilities in 2010people in group homes for juveniles (non-correctional) in 2010People in group quarters in Mitchellville in 2000:
89 people in nursing homes
14 people in other group homes
6 people in homes for the mentally ill
3 people in homes for the mentally retarded
Banks with branches in Mitchellville (2011 data):
Branch Banking and Trust Company: Collington Branch at 10450 Lottsford Road, branch established on 1989/05/10. Info updated 2010/03/29: Bank assets: $168,867.6 mil, Deposits: $127,549.5 mil, headquarters in Winston Salem, NC, positive income , Commercial Lending Specialization, 1793 total offices , Holding Company: Bb&T Corporation
Bank of America, National Association: Lake Arbor Branch at 10200 Lake Arbor Way, branch established on 1990/12/17. Info updated 2009/11/18: Bank assets: $1,451,969.3 mil, Deposits: $1,077,176.8 mil, headquarters in Charlotte, NC, positive income , 5782 total offices , Holding Company: Bank Of America Corporation
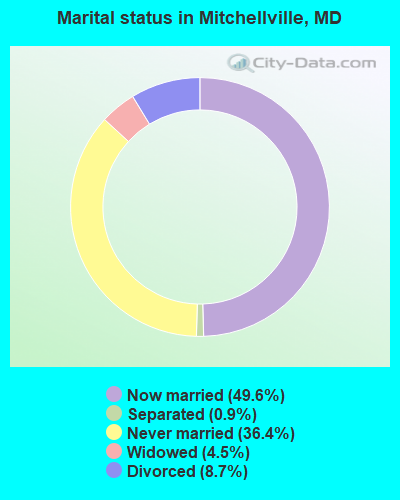
For population 15 years and over in Mitchellville:
Never married: 36.4%Now married: 49.6%Separated: 0.9%Widowed: 4.5%Divorced: 8.7% For population 25 years and over in Mitchellville:
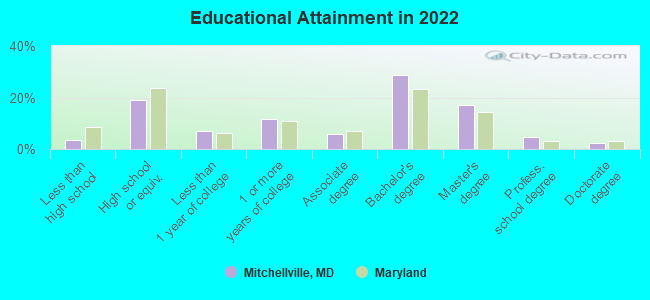
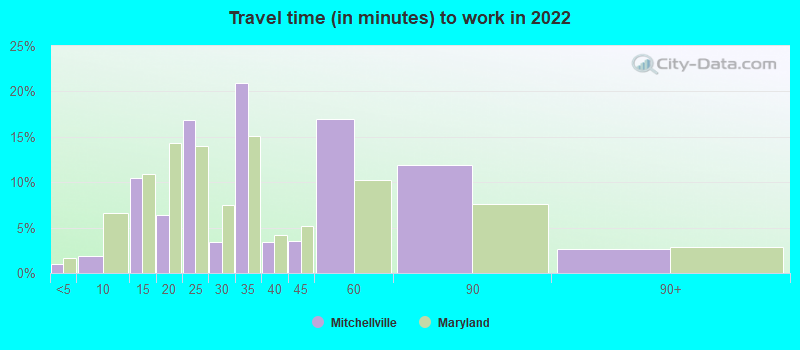
High school or higher: 96.6%Bachelor's degree or higher: 51.8%Graduate or professional degree: 23.1%Unemployed: 4.4%Mean travel time to work (commute): 28.2 minutes
Education Gini index (Inequality in education) Here:
10.6Maryland average:
12.7
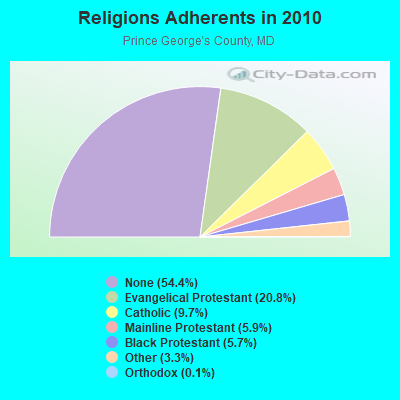
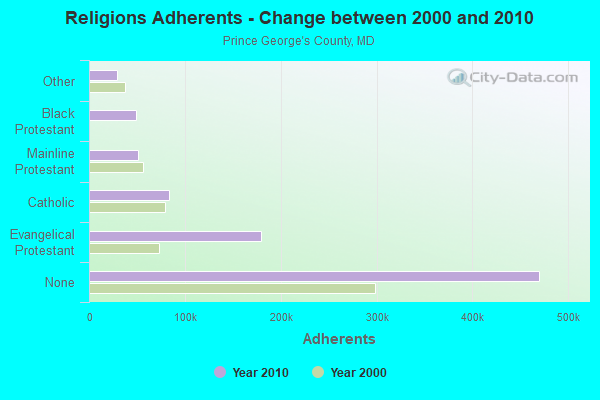
Religion statistics for Mitchellville, MD (based on Prince George's County data)
Religion Adherents Congregations Evangelical Protestant 179,374 430 Catholic 83,959 35 Mainline Protestant 51,153 156 Black Protestant 48,984 66 Other 28,743 57 Orthodox 1,218 6 None 469,989 -
Source: Clifford Grammich, Kirk Hadaway, Richard Houseal, Dale E.Jones, Alexei Krindatch, Richie Stanley and Richard H.Taylor. 2012. 2010 U.S.Religion Census: Religious Congregations & Membership Study. Association of Statisticians of American Religious Bodies. Jones, Dale E., et al. 2002. Congregations and Membership in the United States 2000. Nashville, TN: Glenmary Research Center. Graphs represent county-level data
Food Environment Statistics: Number of grocery stores : 140Here :
1.70 / 10,000 pop.State :
1.96 / 10,000 pop.
Number of supercenters and club stores : 2This county :
0.02 / 10,000 pop.Maryland :
0.07 / 10,000 pop.
Number of convenience stores (no gas) : 132This county :
1.60 / 10,000 pop.State :
1.22 / 10,000 pop.
Number of convenience stores (with gas) : 137This county :
1.66 / 10,000 pop.Maryland :
2.05 / 10,000 pop.
Number of full-service restaurants : 267Here :
3.24 / 10,000 pop.Maryland :
5.40 / 10,000 pop.
Adult obesity rate : This county :
30.7%Maryland :
26.7%
Low-income preschool obesity rate : This county :
16.7%Maryland :
15.5%
Health and Nutrition: Healthy diet rate : This city:
50.2%Maryland:
50.1%
Average overall health of teeth and gums : This city:
48.8%Maryland:
47.6%
Average BMI : Mitchellville:
29.8Maryland:
28.8
People feeling badly about themselves : Mitchellville:
17.7%Maryland:
20.0%
People not drinking alcohol at all : Mitchellville:
14.0%Maryland:
11.3%
Average hours sleeping at night : Mitchellville:
6.5State:
6.8
Overweight people : Mitchellville:
37.4%Maryland:
34.1%
General health condition : Mitchellville:
56.8%State:
56.5%
Average condition of hearing : This city:
84.4%State:
80.5%
More about Health and Nutrition of Mitchellville, MD Residents
6.37% of this county's 2021 resident taxpayers lived in other counties in 2020 ($55,200 average adjusted gross income )
Here:
6.37%Maryland average:
7.42%
0.04% of residents moved from foreign countries ($466 average AGI )Prince George's County:
0.04%Maryland average:
0.05%
Top counties from which taxpayers relocated into this county between 2020 and 2021:
8.15% of this county's 2020 resident taxpayers moved to other counties in 2021 ($59,145 average adjusted gross income )
Here:
8.15%Maryland average:
7.91%
0.05% of residents moved to foreign countries ($401 average AGI )Prince George's County:
0.05%Maryland average:
0.04%
Top counties to which taxpayers relocated from this county between 2020 and 2021:
Businesses in Mitchellville, MD
Name Count Name Count
Ben & Jerry's 3 Pizza Hut 1 McDonald's 1 Popeyes 1 Nike 2 Subway 2 Panda Express 1
Strongest AM radio stations in Mitchellville:
WPGC (1580 AM; 50 kW; MORNINGSIDE, MD; Owner: INFINITY WPGC(AM), INC.)
WTEM (980 AM; 50 kW; WASHINGTON, DC; Owner: AMFM RADIO LICENSES, L.L.C.)
WTOP (1500 AM; 50 kW; WASHINGTON, DC; Owner: BONNEVILLE HOLDING COMPANY)
WBIS (1190 AM; 50 kW; ANNAPOLIS, MD; Owner: NATIONS RADIO, LLC)
WCBM (680 AM; 50 kW; BALTIMORE, MD; Owner: WCBM MARYLAND, INC.)
WWGB (1030 AM; daytime; 50 kW; INDIAN HEAD, MD; Owner: GOOD BODY MEDIA, LLC)
WMET (1150 AM; 50 kW; GAITHERSBURG, MD; Owner: BELTWAY ACQUISITION CORPORATION)
WBAL (1090 AM; 50 kW; BALTIMORE, MD; Owner: HEARST RADIO, INC.)
WUST (1120 AM; daytime; 20 kW; WASHINGTON, DC)
WWLG (1370 AM; 50 kW; BALTIMORE, MD; Owner: M-10 BROADCASTING, INC.)
WGOP (700 AM; daytime; 25 kW; WALKERSVILLE, MD; Owner: BIRACH BROADCASTING CORPORATION)
WKDL (730 AM; 8 kW; ALEXANDRIA, VA; Owner: MEGA COMMUNICATIONS OF ALEXANDRIA LICENSEE, LLC)
WMAL (630 AM; 5 kW; WASHINGTON, DC; Owner: WMAL, INC.)
Strongest FM radio stations in Mitchellville:
WPGC-FM (95.5 FM; MORNINGSIDE, MD; Owner: INFINITY BROADCASTING CORPORATION OF MARYLAND)
WHFS (99.1 FM; ANNAPOLIS, MD; Owner: INFINITY BROADCASTING OPERATIONS, INC.)
WBIG-FM (100.3 FM; WASHINGTON, DC; Owner: AMFM RADIO LICENSES, L.L.C.)
WFSI (107.9 FM; ANNAPOLIS, MD; Owner: FAMILY STATIONS, INC.)
WRQX (107.3 FM; WASHINGTON, DC; Owner: WMAL, INC.)
WWDC-FM (101.1 FM; WASHINGTON, DC; Owner: AMFM RADIO LICENSES, L.L.C.)
WHUR-FM (96.3 FM; WASHINGTON, DC; Owner: THE HOWARD UNIVERSITY)
WASH (97.1 FM; WASHINGTON, DC; Owner: AMFM RADIO LICENSES, L.L.C.)
WCSP-FM (90.1 FM; WASHINGTON, DC; Owner: NATIONAL CABLE SATELLITE CORPORATION)
WKYS (93.9 FM; WASHINGTON, DC; Owner: RADIO ONE LICENSES, LLC)
WARW (94.7 FM; BETHESDA, MD; Owner: INFINITY BROADCASTING OPERATIONS, INC.)
WIHT (99.5 FM; WASHINGTON, DC; Owner: AMFM RADIO LICENSES, L.L.C.)
WGMS-FM (103.5 FM; WASHINGTON, DC; Owner: BONNEVILLE HOLDING COMPANY)
WWMX (106.5 FM; BALTIMORE, MD; Owner: INFINITY RADIO OPERATIONS INC.)
WAMU (88.5 FM; WASHINGTON, DC; Owner: THE EXEC. COMM. OF THE BD. OF TRUSTEES OF AMERICAN UNIV.)
WETA (90.9 FM; WASHINGTON, DC; Owner: GREATER WASHINGTON EDUCATIONAL TELECOMMUNICATIONS ASSN.)
WGTS (91.9 FM; TAKOMA PARK, MD; Owner: COLUMBIA UNION COLLEGE BROADCASTING, INC.)
WMMJ (102.3 FM; BETHESDA, MD; Owner: RADIO ONE LICENSES, LLC)
WWZZ (104.1 FM; WALDORF, MD; Owner: BONNEVILLE HOLDING COMPANY)
WPOC (93.1 FM; BALTIMORE, MD; Owner: CITICASTERS LICENSES, L.P.)
TV broadcast stations around Mitchellville:
WMPT (Channel 22; ANNAPOLIS, MD; Owner: MARYLAND PUBLIC BROADCASTING COMMISSION)
WBDC-TV (Channel 50; WASHINGTON, DC; Owner: WBDC BROADCASTING, INC.)
WJLA-TV (Channel 7; WASHINGTON, DC; Owner: ACC LICENSEE, INC.)
WUSA (Channel 9; WASHINGTON, DC; Owner: THE DETROIT NEWS, INC.)
WTTG (Channel 5; WASHINGTON, DC; Owner: FOX TELEVISION STATIONS, INC.)
WHUT-TV (Channel 32; WASHINGTON, DC; Owner: HOWARD UNIVERSITY)
WETA-TV (Channel 26; WASHINGTON, DC; Owner: THE GREATER WASHINGTON ED TELECOMM. ASSOC)
WDCA (Channel 20; WASHINGTON, DC; Owner: FOX TELEVISION STATIONS, INC.)
WRC-TV (Channel 4; WASHINGTON, DC; Owner: NBC SUBSIDIARY (WRC-TV), INC.)
WBAL-TV (Channel 11; BALTIMORE, MD; Owner: WBAL HEARST-ARGYLE TV, INC. (CA CORP.))
WMAR-TV (Channel 2; BALTIMORE, MD; Owner: SCRIPPS HOWARD BROADCASTING COMPANY)
WBFF (Channel 45; BALTIMORE, MD; Owner: CHESAPEAKE TELEVISION LICENSEE, LLC)
WZDC-LP (Channel 64; WASHINGTON, DC; Owner: ONDA CAPITAL, INC.)
WNUV (Channel 54; BALTIMORE, MD; Owner: BALTIMORE (WNUV-TV) LICENSEE, INC.)
WUTB (Channel 24; BALTIMORE, MD; Owner: FOX TELEVISION STATIONS, INC.)
W28BY (Channel 63; BALTIMORE, MD; Owner: INFORMATION SUPER STATION, L.L.C.)
WIAV-LP (Channel 58; WASHINGTON, DC; Owner: ASIAVISION, INC.)
WJZ-TV (Channel 13; BALTIMORE, MD; Owner: VIACOM INC.)
W63BP (Channel 63; ANNAPOLIS, MD; Owner: ANNAPOLIS BROADCASTING COMPANY, INC.)
WNVC (Channel 56; FAIRFAX, VA; Owner: COMMONWEALTH PUBLIC BROADCASTING CORPORATION)
WMPB (Channel 67; BALTIMORE, MD; Owner: MARYLAND PUBLIC BROADCASTING COMMISSION)
W61BY (Channel 61; ANNAPOLIS, MD; Owner: ANNAPOLIS BROADCASTING COMPANY, INC.)
WMDO-CA (Channel 30; WASHINGTON, DC; Owner: ENTRAVISION HOLDINGS, LLC)
WKRP-LP (Channel 42; WASHINGTON, DC; Owner: CAPITAL MEDIA, LLC)
WPXW (Channel 66; MANASSAS, VA; Owner: PAXSON WASHINGTON LICENSE, INC.)
FCC Registered Cell Phone Towers: 1 (
See the full list of FCC Registered Cell Phone Towers in Mitchellville )
FCC Registered Antenna Towers: 13 (
See the full list of FCC Registered Antenna Towers )
FCC Registered Broadcast Land Mobile Towers: 8 (
See the full list of FCC Registered Broadcast Land Mobile Towers in Mitchellville, MD )
FCC Registered Microwave Towers: 3
WDC4526, 11411 Lake Arbor Way (Lat: 38.898611 Lon: -76.809444), Type: Tower, Structure height: 43.2 m, Call Sign: WQJA304, Assigned Frequencies: 11135.0 MHz, Grant Date: 07/02/2008, Expiration Date: 07/02/2018, Cancellation Date: 01/04/2010, Certifier: Joseph M Sandri Jr., Registrant: Fibertower Corporation, 1667 K Street Nw, Suite 250, Washington, DC 20006, Phone: (202) 223-1028, Fax: (202) 315-3415, Email:
WDCFP45, Derekwood Ln (Lat: 38.949000 Lon: -76.833611), Type: Bant, Structure height: 52.4 m, Call Sign: WQJA307, Assigned Frequencies: 11625.0 MHz, 11215.0 MHz, 11405.0 MHz, 11285.0 MHz, 11325.0 MHz, 11245.0 MHz, 11365.0 MHz, Grant Date: 07/02/2008, Expiration Date: 07/02/2018, Cancellation Date: 01/04/2010, Certifier: Joseph M Sandri Jr., Registrant: Fibertower Corporation, 1667 K Street Nw, Suite 250, Washington, DC 20006, Phone: (202) 223-1028, Fax: (202) 315-3415, Email:
DC03XC253, 4200 Forbes Blvd (Lat: 38.947611 Lon: -76.827306), Type: Mtower, Structure height: 46.3 m, Call Sign: WQUE844, Assigned Frequencies: 11505.0 MHz, 11545.0 MHz, 11305.0 MHz, 11425.0 MHz, 11505.0 MHz, 11545.0 MHz, 11305.0 MHz, 11425.0 MHz, 11505.0 MHz, 11545.0 MHz... (+5 more), Grant Date: 06/18/2014, Expiration Date: 06/18/2024, Cancellation Date: 05/12/2023, Certifier: David Werblow, Registrant: T-Mobile Usa, Inc., 12920 Se 38th Street, Bellevue, WA 98006, Phone: (425) 383-8401, Email:
FCC Registered Maritime Coast & Aviation Ground Towers: 2
Freeway Airport (Lat: 38.945111 Lon: -76.775250), Type: Building, Overall height: 3 m, Call Sign: KCY6, Assigned Frequencies: 123.050 MHz, Grant Date: 07/18/1996, Expiration Date: 07/18/2001, Cancellation Date: 10/21/2001, Registrant: Freeway Airport Inc, 3900 Church Rd, Mitchellville, MD 20721 Freeway Airport (Lat: 38.945111 Lon: -76.775250), Type: Building, Structure height: 3 m, Call Sign: WPTY720, Assigned Frequencies: 123.075 MHz, Grant Date: 02/22/2007, Expiration Date: 01/14/2017, Cancellation Date: 03/18/2017, Certifier: Marcel L Bernard, Registrant: Chief Flight Instructor, 3900 Church Road, Mitchellville, MD 20721, Phone: (301) 390-6424, Email:
FCC Registered Amateur Radio Licenses: 27 (
See the full list of FCC Registered Amateur Radio Licenses in Mitchellville )
FAA Registered Aircraft: 14 (
See the full list of FAA Registered Aircraft in Mitchellville )
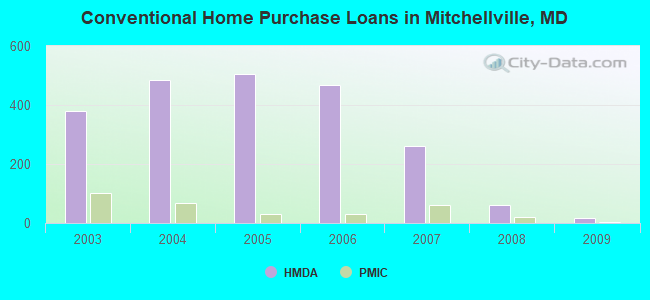
Home Mortgage Disclosure Act Aggregated Statistics For Year 2009(Based on 1 full and 2 partial tracts) A) FHA, FSA/RHS & VA B) Conventional C) Refinancings D) Home Improvement Loans F) Non-occupant Loans on G) Loans On Manufactured Number Average Value Number Average Value Number Average Value Number Average Value Number Average Value Number Average Value
LOANS ORIGINATED 122 $306,522 18 $266,177 301 $264,485 12 $104,127 7 $200,343 1 $205,830 APPLICATIONS APPROVED, NOT ACCEPTED 7 $303,681 1 $207,370 34 $306,893 2 $13,250 1 $100,700 0 $0 APPLICATIONS DENIED 19 $309,978 6 $288,538 166 $311,478 11 $66,209 6 $192,247 0 $0 APPLICATIONS WITHDRAWN 27 $316,517 5 $319,894 102 $296,782 3 $149,390 2 $248,120 0 $0 FILES CLOSED FOR INCOMPLETENESS 5 $314,790 0 $0 50 $311,361 5 $98,676 0 $0 0 $0
Aggregated Statistics For Year 2008(Based on 1 full and 2 partial tracts) A) FHA, FSA/RHS & VA B) Conventional C) Refinancings D) Home Improvement Loans F) Non-occupant Loans on G) Loans On Manufactured Number Average Value Number Average Value Number Average Value Number Average Value Number Average Value Number Average Value
LOANS ORIGINATED 65 $335,268 61 $300,980 258 $278,533 31 $89,429 19 $242,510 0 $0 APPLICATIONS APPROVED, NOT ACCEPTED 4 $269,985 9 $286,552 50 $312,605 8 $148,280 3 $270,880 0 $0 APPLICATIONS DENIED 20 $416,200 18 $298,608 254 $333,132 39 $129,007 10 $246,839 2 $57,735 APPLICATIONS WITHDRAWN 16 $351,911 25 $332,307 121 $322,708 9 $108,140 4 $324,632 0 $0 FILES CLOSED FOR INCOMPLETENESS 2 $396,685 6 $392,163 43 $345,242 1 $389,050 7 $402,057 0 $0
Aggregated Statistics For Year 2007(Based on 1 full and 2 partial tracts) A) FHA, FSA/RHS & VA B) Conventional C) Refinancings D) Home Improvement Loans F) Non-occupant Loans on Number Average Value Number Average Value Number Average Value Number Average Value Number Average Value
LOANS ORIGINATED 7 $327,174 260 $312,157 605 $291,676 85 $129,799 35 $229,368 APPLICATIONS APPROVED, NOT ACCEPTED 0 $0 48 $279,113 128 $293,633 18 $98,453 9 $239,037 APPLICATIONS DENIED 4 $311,730 144 $350,297 521 $354,054 87 $200,073 27 $332,449 APPLICATIONS WITHDRAWN 4 $319,762 43 $254,409 216 $328,888 12 $196,978 14 $228,706 FILES CLOSED FOR INCOMPLETENESS 1 $168,760 18 $336,418 94 $374,863 4 $153,358 5 $270,752
Aggregated Statistics For Year 2006(Based on 1 full and 2 partial tracts) A) FHA, FSA/RHS & VA B) Conventional C) Refinancings D) Home Improvement Loans F) Non-occupant Loans on Number Average Value Number Average Value Number Average Value Number Average Value Number Average Value
LOANS ORIGINATED 4 $334,108 467 $253,894 985 $282,590 104 $146,946 53 $230,515 APPLICATIONS APPROVED, NOT ACCEPTED 0 $0 64 $250,592 130 $291,732 16 $72,016 8 $230,259 APPLICATIONS DENIED 0 $0 145 $269,952 467 $314,260 75 $154,282 24 $261,285 APPLICATIONS WITHDRAWN 1 $300,000 66 $250,003 319 $306,353 25 $280,666 12 $220,921 FILES CLOSED FOR INCOMPLETENESS 0 $0 12 $243,176 106 $321,117 5 $99,426 2 $300,900
Aggregated Statistics For Year 2005(Based on 1 full and 2 partial tracts) A) FHA, FSA/RHS & VA B) Conventional C) Refinancings D) Home Improvement Loans F) Non-occupant Loans on G) Loans On Manufactured Number Average Value Number Average Value Number Average Value Number Average Value Number Average Value Number Average Value
LOANS ORIGINATED 3 $283,003 506 $226,975 1,225 $258,997 127 $171,886 71 $225,303 2 $135,310 APPLICATIONS APPROVED, NOT ACCEPTED 0 $0 75 $205,964 158 $245,345 22 $106,510 9 $226,029 0 $0 APPLICATIONS DENIED 1 $273,710 120 $228,394 456 $263,991 77 $113,555 15 $275,790 2 $37,860 APPLICATIONS WITHDRAWN 0 $0 83 $221,662 399 $266,569 43 $203,865 9 $229,693 0 $0 FILES CLOSED FOR INCOMPLETENESS 0 $0 18 $243,153 102 $279,031 7 $56,910 3 $224,030 1 $148,280
Aggregated Statistics For Year 2004(Based on 1 full and 2 partial tracts) A) FHA, FSA/RHS & VA B) Conventional C) Refinancings D) Home Improvement Loans F) Non-occupant Loans on G) Loans On Manufactured Number Average Value Number Average Value Number Average Value Number Average Value Number Average Value Number Average Value
LOANS ORIGINATED 29 $234,642 486 $210,757 1,027 $219,842 89 $111,218 68 $175,944 3 $64,387 APPLICATIONS APPROVED, NOT ACCEPTED 4 $155,878 64 $202,350 162 $225,692 20 $34,188 9 $122,667 0 $0 APPLICATIONS DENIED 5 $201,736 108 $210,092 486 $221,032 81 $54,064 27 $189,942 0 $0 APPLICATIONS WITHDRAWN 5 $204,700 58 $228,153 372 $218,302 19 $158,567 9 $184,636 0 $0 FILES CLOSED FOR INCOMPLETENESS 0 $0 18 $235,631 88 $229,474 4 $170,665 2 $228,005 0 $0
Aggregated Statistics For Year 2003(Based on 1 full and 2 partial tracts) A) FHA, FSA/RHS & VA B) Conventional C) Refinancings D) Home Improvement Loans F) Non-occupant Loans on Number Average Value Number Average Value Number Average Value Number Average Value Number Average Value
LOANS ORIGINATED 119 $211,296 380 $200,059 1,356 $187,803 64 $30,817 36 $144,777 APPLICATIONS APPROVED, NOT ACCEPTED 7 $161,543 54 $193,973 243 $190,895 16 $19,494 7 $138,481 APPLICATIONS DENIED 13 $232,816 61 $198,954 360 $195,161 59 $34,795 12 $156,596 APPLICATIONS WITHDRAWN 8 $210,160 50 $210,211 298 $189,597 5 $43,394 8 $134,414 FILES CLOSED FOR INCOMPLETENESS 8 $181,710 12 $216,058 63 $194,459 4 $43,655 2 $122,725
Detailed HMDA statistics for the following Tracts:
8035.15
, 8035.16 , 8035.17
Private Mortgage Insurance Companies Aggregated Statistics For Year 2009(Based on 1 full and 2 partial tracts) A) Conventional B) Refinancings Number Average Value Number Average Value
LOANS ORIGINATED 3 $318,827 6 $290,932 APPLICATIONS APPROVED, NOT ACCEPTED 2 $258,005 5 $313,086 APPLICATIONS DENIED 7 $357,556 3 $351,237 APPLICATIONS WITHDRAWN 0 $0 2 $225,915 FILES CLOSED FOR INCOMPLETENESS 0 $0 1 $460,360
Aggregated Statistics For Year 2008(Based on 1 full and 2 partial tracts) A) Conventional B) Refinancings C) Non-occupant Loans on Number Average Value Number Average Value Number Average Value
LOANS ORIGINATED 21 $327,027 18 $349,016 1 $318,340 APPLICATIONS APPROVED, NOT ACCEPTED 18 $332,810 32 $379,652 5 $286,136 APPLICATIONS DENIED 2 $407,795 2 $379,550 2 $383,585 APPLICATIONS WITHDRAWN 2 $331,660 2 $523,940 0 $0 FILES CLOSED FOR INCOMPLETENESS 0 $0 3 $384,973 0 $0
Aggregated Statistics For Year 2007(Based on 1 full and 2 partial tracts) A) Conventional B) Refinancings C) Non-occupant Loans on Number Average Value Number Average Value Number Average Value
LOANS ORIGINATED 60 $352,542 53 $368,381 4 $304,908 APPLICATIONS APPROVED, NOT ACCEPTED 10 $420,740 12 $381,162 1 $356,140 APPLICATIONS DENIED 4 $419,772 0 $0 0 $0 APPLICATIONS WITHDRAWN 6 $337,938 5 $357,634 0 $0 FILES CLOSED FOR INCOMPLETENESS 1 $307,080 1 $359,380 1 $359,380
Aggregated Statistics For Year 2006(Based on 1 full and 2 partial tracts) A) Conventional B) Refinancings C) Non-occupant Loans on Number Average Value Number Average Value Number Average Value
LOANS ORIGINATED 31 $339,102 27 $373,635 1 $305,740 APPLICATIONS APPROVED, NOT ACCEPTED 6 $331,440 11 $399,864 1 $413,840 APPLICATIONS DENIED 0 $0 2 $723,850 0 $0 APPLICATIONS WITHDRAWN 2 $263,570 2 $440,240 0 $0 FILES CLOSED FOR INCOMPLETENESS 0 $0 0 $0 0 $0
Aggregated Statistics For Year 2005(Based on 1 full and 2 partial tracts) A) Conventional B) Refinancings Number Average Value Number Average Value
LOANS ORIGINATED 29 $288,036 33 $295,540 APPLICATIONS APPROVED, NOT ACCEPTED 8 $300,106 11 $287,623 APPLICATIONS DENIED 0 $0 1 $488,010 APPLICATIONS WITHDRAWN 1 $454,390 1 $352,930 FILES CLOSED FOR INCOMPLETENESS 0 $0 0 $0
Aggregated Statistics For Year 2004(Based on 1 full and 2 partial tracts) A) Conventional B) Refinancings C) Non-occupant Loans on Number Average Value Number Average Value Number Average Value
LOANS ORIGINATED 67 $260,370 57 $262,854 6 $226,853 APPLICATIONS APPROVED, NOT ACCEPTED 18 $277,051 25 $233,502 1 $144,700 APPLICATIONS DENIED 1 $200,850 2 $293,525 1 $138,330 APPLICATIONS WITHDRAWN 2 $232,560 6 $214,620 1 $440,970 FILES CLOSED FOR INCOMPLETENESS 0 $0 3 $236,540 0 $0
Aggregated Statistics For Year 2003(Based on 1 full and 2 partial tracts) A) Conventional B) Refinancings C) Non-occupant Loans on Number Average Value Number Average Value Number Average Value
LOANS ORIGINATED 102 $232,677 115 $217,566 6 $167,562 APPLICATIONS APPROVED, NOT ACCEPTED 11 $267,073 34 $218,920 0 $0 APPLICATIONS DENIED 5 $201,386 7 $246,821 1 $157,000 APPLICATIONS WITHDRAWN 7 $219,969 6 $256,480 0 $0 FILES CLOSED FOR INCOMPLETENESS 0 $0 0 $0 0 $0
Detailed PMIC statistics for the following Tracts:
8035.15
, 8035.16 , 8035.17 Mitchellville compared to Maryland state average:
Unemployed percentage significantly below state average. Black race population percentage significantly above state average. Hispanic race population percentage significantly below state average. Median age above state average. Foreign-born population percentage above state average. Renting percentage significantly below state average. Length of stay since moving in significantly above state average. Number of rooms per house significantly above state average. House age below state average. Percentage of population with a bachelor's degree or higher above state average. Mitchellville on our top lists :
#8 on the list of "Top 101 cities with the most residents born in Nigeria (population 500+)"
#20 on the list of "Top 101 cities with the most residents born in Western Africa (population 500+)"
#30 on the list of "Top 101 cities with the most residents born in Sierra Leone (population 500+)"
#31 on the list of "Top 101 cities with the most residents born in Guyana (population 500+)"
#36 on the list of "Top 101 cities with the most residents born in Other Western Africa (population 500+)"
#36 on the list of "Top 101 cities with the most residents born in Other Caribbean (population 500+)"
#46 on the list of "Top 101 cities with the most residents born in Africa (population 500+)"
#51 on the list of "Top 101 cities with largest percentage of females in industries: public administration (population 5,000+)"
#56 on the list of "Top 101 cities with the most residents born in Africa, n.e.c. (population 500+)"
#95 on the list of "Top 101 cities with the most residents born in Other Northern America (population 500+)"
#101 on the list of "Top 101 cities with largest percentage of males in industries: real estate and rental and leasing (population 5,000+)"
#52 (20721) on the list of "Top 101 zip codes with the largest percentage of taxpayers using charity contributions deductions in 2012 (pop 5,000+)"
#87 (20721) on the list of "Top 101 zip codes with the largest percentage of Subsaharan African first ancestries"
#100 (20721) on the list of "Top 101 zip codes with the largest charity contributions deductions as a percentage of AGI in 2012 (pop 5,000+)"
#5 on the list of "Top 101 counties with highest percentage of residents voting for Obama (Democrat) in the 2012 Presidential Election"
#12 on the list of "Top 101 counties with the highest number of infant deaths per 1000 residents 2007-2013 (pop. 50,000+)"
#13 on the list of "Top 101 counties with the highest average weight of females"
#14 on the list of "Top 101 counties with the highest Nitrogen Dioxide air pollution readings in 2012 (ppm)"
#14 on the list of "Top 101 counties with the most Black Protestant adherents"
Top Patent Applicants
David Clyde Chiles (10)
Ming-Chiang Li (3)
Jennifer Dawn Antoine (2)
Robert L. Alexander, Sr. (2)
Emmanuel Akala (2)
Ronald Garey (2)
Anthony Rollando Robinson (2)
Emmanuel Oyekanmi Akala (2)
Clarence M. Lee (2)
Tibor Czinki (1)
Total of 33 patent applications in 2008-2024.


 Recent articles from our blog. Our writers, many of them Ph.D. graduates or candidates, create easy-to-read articles on a wide variety of topics.

 , pop. 50,269).