Estimated zip code population in 2022: 34,708 Zip code population in 2010: 33,282 Zip code population in 2000: 32,881
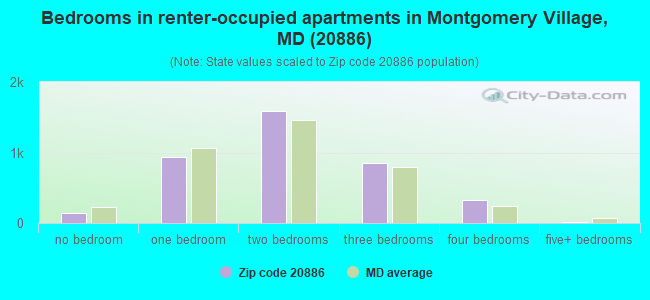
Houses and condos: 12,969 Renter-occupied apartments: 3,887
% of renters here:
31%
State:
32%
March 2022 cost of living index in zip code 20886: 172.8 (very high, U.S. average is 100)
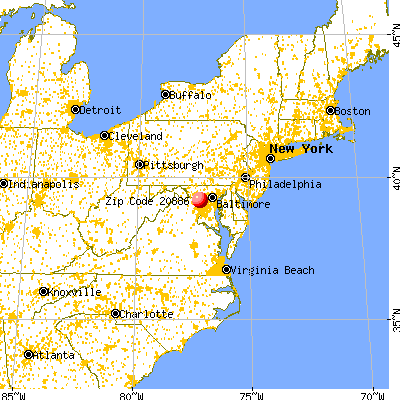
Land area: 4.7 sq. mi. Water area: 0.1 sq. mi.
Population density: 7,383 people per square mile
(high).
OSM Map
General Map
Google Map
MSN Map
OSM Map
General Map
Google Map
MSN Map
OSM Map
General Map
Google Map
MSN Map
OSM Map
General Map
Google Map
MSN Map
Please wait while loading the map...
Real estate property taxes paid for housing units in 2022:
This zip code:
0.8% ($2,808)
Maryland:
0.9% ($3,777)
Median real estate property taxes paid for housing units with mortgages in 2022: $2,804 (0.7%) Median real estate property taxes paid for housing units with no mortgage in 2022: $2,826 (0.8%)
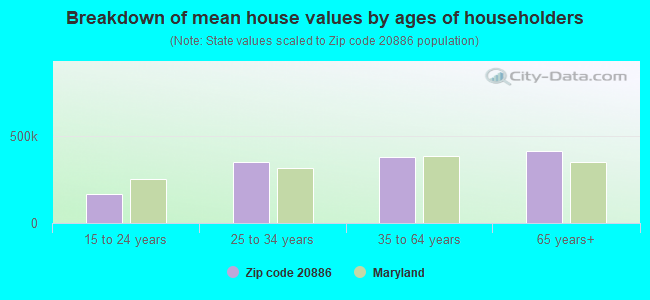
Estimated median house/condo value in 2022: $370,793
20886:
$370,793
Maryland:
$398,100
According to our research of Maryland and other state lists, there were 33 registered sex offenders living in 20886 zip code as of April 26, 2024. The ratio of all residents to sex offenders in zip code 20886 is 1,053 to 1. The ratio of registered sex offenders to all residents in this zip code is lower than the state average.
Median resident age:
This zip code:
38.5 years
Maryland median age:
39.7 years
Average household size:
This zip code:
2.8 people
Maryland:
2.5 people
Averages for the 2020 tax year for zip code 20886, filed in 2021:
Average Adjusted Gross Income (AGI) in 2020: $59,269 (Individual Income Tax Returns)
Here:
$59,269
State:
$86,905
Salary/wage: $58,074 (reported on 79.7% of returns)
Here:
$58,074
State:
$73,953
(% of AGI for various income ranges: 1211.5% for AGIs below $25k, 3904.4% for AGIs $25k-50k, 7180.7% for AGIs $50k-75k, 10821.2% for AGIs $75k-100k, 18474.2% for AGIs $100k-200k, 58692.5% for AGIs over 200k)
Taxable interest for individuals: $786 (reported on 27.2% of returns)
This zip code:
$786
Maryland:
$1,528
(% of AGI for various income ranges: 7.2% for AGIs below $25k, 12.7% for AGIs $25k-50k, 21.0% for AGIs $50k-75k, 41.3% for AGIs $75k-100k, 93.8% for AGIs $100k-200k, 412.5% for AGIs over 200k)
Ordinary dividends: $4,834 (reported on 13.7% of returns)
Here:
$4,834
State:
$8,028
(% of AGI for various income ranges: 11.3% for AGIs below $25k, 16.2% for AGIs $25k-50k, 49.0% for AGIs $50k-75k, 89.9% for AGIs $75k-100k, 282.9% for AGIs $100k-200k, 2139.2% for AGIs over 200k)
Net capital gain/loss in AGI: +$8,191 (reported on 12.9% of returns)
Here:
+$8,191
State:
+$25,238
(% of AGI for various income ranges: 2.6% for AGIs below $25k, 16.7% for AGIs $25k-50k, 41.0% for AGIs $50k-75k, 65.4% for AGIs $75k-100k, 320.6% for AGIs $100k-200k, 5247.5% for AGIs over 200k)
Profit/loss from business: +$7,510 (reported on 27.9% of returns)
Here:
+$7,510
State:
+$11,398
(% of AGI for various income ranges: 381.0% for AGIs below $25k, 224.1% for AGIs $25k-50k, 184.9% for AGIs $50k-75k, 180.7% for AGIs $75k-100k, 446.1% for AGIs $100k-200k, 1831.2% for AGIs over 200k)
Taxable individual retirement arrangement distribution: $21,512 (reported on 4.9% of returns)
20886:
$21,512
Maryland:
$20,944
(% of AGI for various income ranges: 19.8% for AGIs below $25k, 39.2% for AGIs $25k-50k, 97.9% for AGIs $50k-75k, 150.4% for AGIs $75k-100k, 455.3% for AGIs $100k-200k, 3000.0% for AGIs over 200k)
Self-employed (Keogh) retirement plans: $16,550 (reported on 0.3% of returns)
20886:
$16,550
Maryland:
$29,558
(% of AGI for various income ranges: 68.0% for AGIs $100k-200k)
Total itemized deductions: $25,911 (reported on 17.0% of returns)
Here:
$25,911
State:
$30,672
(% of AGI for various income ranges: 73.0% for AGIs below $25k, 259.0% for AGIs $25k-50k, 691.6% for AGIs $50k-75k, 1393.3% for AGIs $75k-100k, 1980.0% for AGIs $100k-200k, 4870.8% for AGIs over 200k)
Charity contributions: $6,537 (reported on 13.3% of returns)
Here:
$6,537
State:
$9,065
(% of AGI for various income ranges: 6.9% for AGIs below $25k, 46.4% for AGIs $25k-50k, 131.4% for AGIs $50k-75k, 234.8% for AGIs $75k-100k, 402.9% for AGIs $100k-200k, 1291.7% for AGIs over 200k)
Taxes paid: $7,749 (reported on 17.0% of returns)
20886:
$7,749
State:
$8,475
(% of AGI for various income ranges: 10.8% for AGIs below $25k, 59.2% for AGIs $25k-50k, 191.0% for AGIs $50k-75k, 466.6% for AGIs $75k-100k, 658.9% for AGIs $100k-200k, 1352.5% for AGIs over 200k)
Earned income credit: $2,214 (reported on 15.8% of returns)
Here:
$2,214
State:
$2,151
(% of AGI for various income ranges: 104.3% for AGIs below $25k, 71.9% for AGIs $25k-50k, 1.7% for AGIs $50k-75k)
Percentage of individuals using paid preparers for their 2020 taxes: 86.3%
Here:
86%
State:
90%
(% for various income ranges: 80.9% for AGIs below $25k, 88.8% for AGIs $25k-50k, 89.0% for AGIs $50k-75k, 89.3% for AGIs $75k-100k, 89.3% for AGIs $100k-200k, 88.4% for AGIs over 200k)
Averages for the 2012 tax year for zip code 20886, filed in 2013:
Average Adjusted Gross Income (AGI) in 2012: $56,545 (Individual Income Tax Returns)
Here:
$56,545
State:
$72,703
Salary/wage: $53,915 (reported on 85.4% of returns)
Here:
$53,915
State:
$62,228
(% of AGI for various income ranges: 78.1% for AGIs below $25k, 88.6% for AGIs $25k-50k, 85.8% for AGIs $50k-75k, 82.8% for AGIs $75k-100k, 81.2% for AGIs $100k-200k, 70.9% for AGIs over 200k)
Taxable interest for individuals: $720 (reported on 33.2% of returns)
This zip code:
$720
Maryland:
$1,413
(% of AGI for various income ranges: 0.5% for AGIs below $25k, 0.3% for AGIs $25k-50k, 0.3% for AGIs $50k-75k, 0.4% for AGIs $75k-100k, 0.5% for AGIs $100k-200k, 0.5% for AGIs over 200k)
Ordinary dividends: $4,052 (reported on 15.9% of returns)
Here:
$4,052
State:
$6,933
(% of AGI for various income ranges: 0.6% for AGIs below $25k, 0.5% for AGIs $25k-50k, 0.6% for AGIs $50k-75k, 1.1% for AGIs $75k-100k, 1.4% for AGIs $100k-200k, 2.1% for AGIs over 200k)
Net capital gain/loss in AGI: +$3,180 (reported on 11.3% of returns)
Here:
+$3,180
State:
+$14,830
(% of AGI for various income ranges: 0.2% for AGIs $50k-75k, 0.2% for AGIs $75k-100k, 0.5% for AGIs $100k-200k, 2.8% for AGIs over 200k)
Profit/loss from business: +$8,651 (reported on 21.3% of returns)
Here:
+$8,651
State:
+$12,606
(% of AGI for various income ranges: 15.0% for AGIs below $25k, 2.5% for AGIs $25k-50k, 1.8% for AGIs $50k-75k, 1.6% for AGIs $75k-100k, 2.2% for AGIs $100k-200k, 3.4% for AGIs over 200k)
Taxable individual retirement arrangement distribution: $16,029 (reported on 6.4% of returns)
20886:
$16,029
Maryland:
$17,065
(% of AGI for various income ranges: 1.2% for AGIs below $25k, 1.2% for AGIs $25k-50k, 1.2% for AGIs $50k-75k, 1.9% for AGIs $75k-100k, 1.9% for AGIs $100k-200k, 3.1% for AGIs over 200k)
Self-employment retirement plans: $11,790 (reported on 0.6% of returns)
20886:
$11,790
Maryland:
$24,439
(% of AGI for various income ranges: 0.2% for AGIs $50k-75k, 0.1% for AGIs $100k-200k, 0.3% for AGIs over 200k)
Total itemized deductions: $22,153 (25% of AGI, reported on 47.5% of returns)
Here:
$22,153
State:
$27,886
Here:
24.7% of AGI
State:
22.8% of AGI
(% of AGI for various income ranges: 13.6% for AGIs below $25k, 18.6% for AGIs $25k-50k, 21.0% for AGIs $50k-75k, 20.9% for AGIs $75k-100k, 18.9% for AGIs $100k-200k, 15.8% for AGIs over 200k)
Charity contributions: $3,205 (reported on 37.3% of returns)
Here:
$3,205
State:
$4,452
(% of AGI for various income ranges: 1.0% for AGIs below $25k, 1.9% for AGIs $25k-50k, 2.3% for AGIs $50k-75k, 2.4% for AGIs $75k-100k, 2.2% for AGIs $100k-200k, 2.3% for AGIs over 200k)
Taxes paid: $7,989 (reported on 47.1% of returns)
20886:
$7,989
State:
$11,690
(% of AGI for various income ranges: 2.0% for AGIs below $25k, 3.8% for AGIs $25k-50k, 6.2% for AGIs $50k-75k, 7.3% for AGIs $75k-100k, 8.2% for AGIs $100k-200k, 8.6% for AGIs over 200k)
Earned income credit: $2,328 (reported on 16.7% of returns)
Here:
$2,328
State:
$2,199
(% of AGI for various income ranges: 6.8% for AGIs below $25k, 1.1% for AGIs $25k-50k)
Percentage of individuals using paid preparers for their 2012 taxes: 51.3%
Here:
51%
State:
52%
(% for various income ranges: 54.6% for AGIs below $25k, 52.3% for AGIs $25k-50k, 50.0% for AGIs $50k-75k, 48.4% for AGIs $75k-100k, 44.4% for AGIs $100k-200k, 47.1% for AGIs over 200k)
Averages for the 2004 tax year for zip code 20886, filed in 2005:
Average Adjusted Gross Income (AGI) in 2004: $52,699 (Individual Income Tax Returns)
Here:
$52,699
State:
$60,339
Salary/wage: $49,746 (reported on 89.4% of returns)
Here:
$49,746
State:
$52,211
(% of AGI for various income ranges: 103.4% for AGIs below $10k, 84.5% for AGIs $10k-25k, 89.2% for AGIs $25k-50k, 86.9% for AGIs $50k-75k, 85.5% for AGIs $75k-100k, 79.8% for AGIs over 100k)
Taxable interest for individuals: $923 (reported on 46.8% of returns)
This zip code:
$923
Maryland:
$1,701
(% of AGI for various income ranges: 2.4% for AGIs below $10k, 0.9% for AGIs $10k-25k, 0.6% for AGIs $25k-50k, 0.9% for AGIs $50k-75k, 0.8% for AGIs $75k-100k, 0.9% for AGIs over 100k)
Taxable dividends: $2,289 (reported on 23.6% of returns)
Here:
$2,289
State:
$4,235
(% of AGI for various income ranges: 2.4% for AGIs below $10k, 0.9% for AGIs $10k-25k, 0.6% for AGIs $25k-50k, 0.8% for AGIs $50k-75k, 1.0% for AGIs $75k-100k, 1.3% for AGIs over 100k)
Net capital gain/loss: +$4,615 (reported on 19.1% of returns)
Here:
+$4,615
State:
+$15,888
(% of AGI for various income ranges: -1.1% for AGIs below $10k, 0.4% for AGIs $10k-25k, 0.2% for AGIs $25k-50k, 0.3% for AGIs $50k-75k, 0.7% for AGIs $75k-100k, 3.7% for AGIs over 100k)
Profit/loss from business: +$10,122 (reported on 15.6% of returns)
Here:
+$10,122
State:
+$12,221
(% of AGI for various income ranges: 13.2% for AGIs below $10k, 7.1% for AGIs $10k-25k, 2.2% for AGIs $25k-50k, 1.7% for AGIs $50k-75k, 1.7% for AGIs $75k-100k, 3.6% for AGIs over 100k)
IRA payment deduction: $2,771 (reported on 3.0% of returns)
20886:
$2,771
Maryland:
$2,968
(% of AGI for various income ranges: 0.3% for AGIs below $10k, 0.2% for AGIs $10k-25k, 0.3% for AGIs $25k-50k, 0.1% for AGIs $50k-75k, 0.1% for AGIs $75k-100k, 0.1% for AGIs over 100k)
Self-employed pension: $12,006 (reported on 1.1% of returns)
Here:
$12,006
Maryland:
$17,155
(% of AGI for various income ranges: 0.1% for AGIs $25k-50k, 0.1% for AGIs $50k-75k, 0.1% for AGIs $75k-100k, 0.5% for AGIs over 100k)
Total itemized deductions: $19,277 (26% of AGI, reported on 56.8% of returns)
Here:
$19,277
State:
$22,960
Here:
25.7% of AGI
State:
23.3% of AGI
(% of AGI for various income ranges: 18.0% for AGIs below $10k, 19.5% for AGIs $10k-25k, 24.4% for AGIs $25k-50k, 23.2% for AGIs $50k-75k, 21.9% for AGIs $75k-100k, 17.7% for AGIs over 100k)
Charity contributions deductions: $2,846 (4% of AGI, reported on 49.2% of returns)
Here:
$2,846
State:
$4,031
Here:
3.6% of AGI
State:
3.9% of AGI
(% of AGI for various income ranges: 1.2% for AGIs below $10k, 2.0% for AGIs $10k-25k, 3.0% for AGIs $25k-50k, 2.8% for AGIs $50k-75k, 2.6% for AGIs $75k-100k, 2.6% for AGIs over 100k)
Total tax: $7,573 (reported on 79.1% of returns)
20886:
$7,573
State:
$10,167
(% of AGI for various income ranges: 3.8% for AGIs below $10k, 4.0% for AGIs $10k-25k, 6.5% for AGIs $25k-50k, 9.3% for AGIs $50k-75k, 10.6% for AGIs $75k-100k, 16.4% for AGIs over 100k)
Earned income credit: $1,736 (reported on 11.9% of returns)
Here:
$1,736
State:
$1,700
Percentage of individuals using paid preparers for their 2004 taxes: 49.5%
Here:
50%
State:
55%
(% for various income ranges: 43.7% for AGIs below $10k, 56.1% for AGIs $10k-25k, 52.1% for AGIs $25k-50k, 48.3% for AGIs $50k-75k, 47.0% for AGIs $75k-100k, 44.4% for AGIs over 100k)
Likely homosexual households (counted as self-reported same-sex unmarried-partner households)
Lesbian couples: 0.1% of all households
Gay men: 0.1% of all households
Household received Food Stamps/SNAP in the past 12 months: 1,448 Household did not receive Food Stamps/SNAP in the past 12 months: 11,045
Women who had a birth in the past 12 months: 507 (430 now married, 79 unmarried) Women who did not have a birth in the past 12 months: 6,971 (3,190 now married, 3,781 unmarried)
Housing units in zip code 20886 with a mortgage: 6,840 (717 second mortgage, 97 home equity loan, 416 both second mortgage and home equity loan) Houses without a mortgage: 126
Median monthly owner costs for units with a mortgage: $1,964 Median monthly owner costs for units without a mortgage: $626
Residents with income below the poverty level in 2022:
This zip code:
10.8%
Whole state:
9.6%
Residents with income below 50% of the poverty level in 2022:
This zip code:
4.8%
Whole state:
4.7%
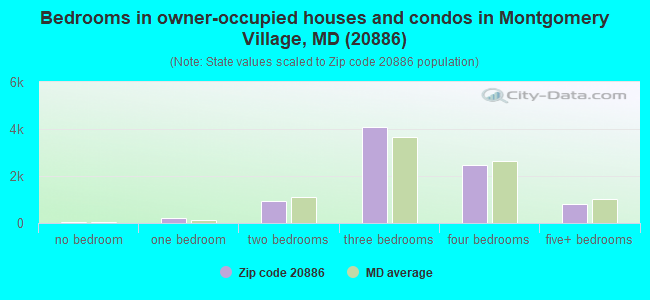
Median number of rooms in houses and condos:
Here:
6.8
State:
7.3
Median number of rooms in apartments:
Here:
4.2
State:
4.2
Notable locations in this zip code not listed on our city pages
Notable locations in zip code 20886: Montgomery Village Golf Course (A), YMCA (B), North Creek Community Center (C), Stedwick Community Center (D), Gaithersburg Regional Library (E), Gaithersburg Library (F), Montgomery Village Nursing Home (G). Display/hide their locations on the map
Streams, rivers, and creeks: Cabin Branch (A), North Creek (B), Honkers Rush (C), Foxkit Creek (D), Fawnwalk Run (E), Beaverbrook (F). Display/hide their locations on the map
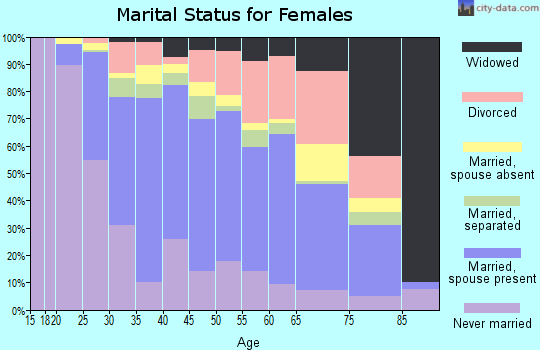
5,109 married couples with children.
1,586 single-parent households (606 men, 980 women).
47.1% of residents of 20886 zip code speak English at home.
31.3% of residents speak Spanish at home (49% very well, 24% well, 22% not well, 6% not at all).
10.7% of residents speak other Indo-European language at home (60% very well, 34% well, 5% not well, 1% not at all).
6.8% of residents speak Asian or Pacific Island language at home (54% very well, 20% well, 22% not well, 3% not at all).
5.1% of residents speak other language at home (66% very well, 25% well, 8% not well, 1% not at all).
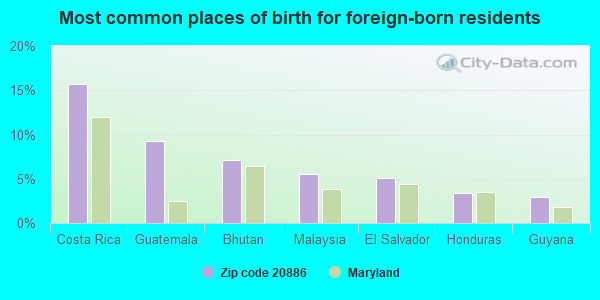
Foreign born population: 12,826 (37.0%) (56.3% of them are naturalized citizens)
This zip code:
37.0%
Whole state:
16.7%
16%Costa Rica
9%Guatemala
7%Bhutan
6%Malaysia
5%El Salvador
3%Honduras
3%Guyana
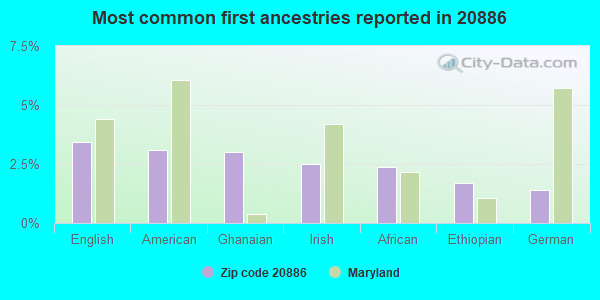
3%English
3%American
3%Ghanaian
3%Irish
2%African
2%Ethiopian
1%German
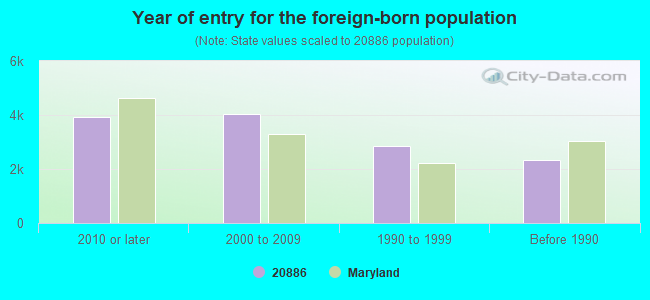
Year of entry for the foreign-born population
3,9362010 or later
4,0522000 to 2009
2,8521990 to 1999
2,344Before 1990
Facilities with environmental interests located in this zip code:
APPLE RIDGE (10101 APPLE RIDGE ROAD in MONTGOMERY VILLAGE, MD)
STATE MASTER (Maryland Permits tracking) - National Pollutant Discharge Elimination System Permit National Pollutant Discharge Elimination System NON-MAJOR (Tracking pollutant discharge elimination systems) - permit Business SIC classification: AMUSEMENT AND RECREATION SERVICES Alternative names: MONTGOMERY VILLAGE FOUNDATION, MONTGOMERY VILLAGE FOUNDATION - APPLE RIDGE
MONTGOMERY VILLAGE FOUNDATION - WHETSTONE (19140 BROOKS GROVE COURT in MONTGOMERY VILLAGE, MD)
STATE MASTER (Maryland Permits tracking) - National Pollutant Discharge Elimination System Permit National Pollutant Discharge Elimination System NON-MAJOR (Tracking pollutant discharge elimination systems) - permit Business SIC classification: AMUSEMENT AND RECREATION SERVICES
NORTH CREEK (20125 ARROWHEAD ROAD in MONTGOMERY VILLAGE, MD)
STATE MASTER (Maryland Permits tracking) - National Pollutant Discharge Elimination System Permit National Pollutant Discharge Elimination System NON-MAJOR (Tracking pollutant discharge elimination systems) - permit Business SIC classification: AMUSEMENT AND RECREATION SERVICES Alternative names: MONTGOMERY VILLAGE FOUNDATION, MONTGOMERY VILLAGE FOUNDATION - NORTH CREEK
LAKE MARION (8821 EAST VILLAGE AVENUE in MONTGOMERY VILLAGE, MD)
STATE MASTER (Maryland Permits tracking) - National Pollutant Discharge Elimination System Permit National Pollutant Discharge Elimination System NON-MAJOR (Tracking pollutant discharge elimination systems) - permit Business SIC classification: HOTELS AND MOTELS; AMUSEMENT AND RECREATION SERVICES Alternative names: MONTGOMERY VILLAGE FOUNDATION, MONTGOMERY VILLAGE FOUNDATION - LAKE MARION
NORMANDIE ON THE LAKE II (9930 WALKER HOUSE ROAD in MONTGOMERY VILLAGE, MD)
National Pollutant Discharge Elimination System NON-MAJOR (Tracking pollutant discharge elimination systems) - permit Business SIC classification: VOCATIONAL SCHOOLS
ETS CHAIYM (20300 PLEASANT RIDGE DRIVE in MONTGOMERY VILLAGE, MD)
COMPLIANCE ACTIVITY (Tracking inspections of insecticide, fungicide, and rodenticide, and toxic substances)
Housing units lacking complete plumbing facilities: 0.5% Housing units lacking complete kitchen facilities: 0.3%
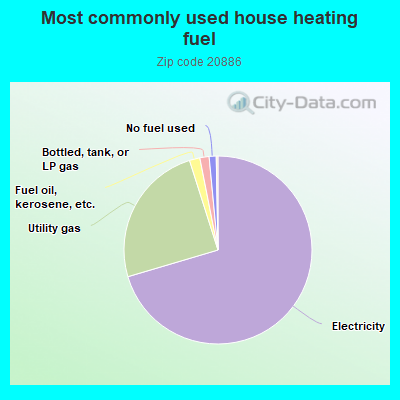
70.5%Electricity
24.7%Utility gas
1.8%Fuel oil, kerosene, etc.
1.6%Bottled, tank, or LP gas
1.2%No fuel used
Place of birth for U.S.-born residents:
This state: 10,850
Northeast: 4,837
Midwest: 1,176
South: 4,374
West: 488
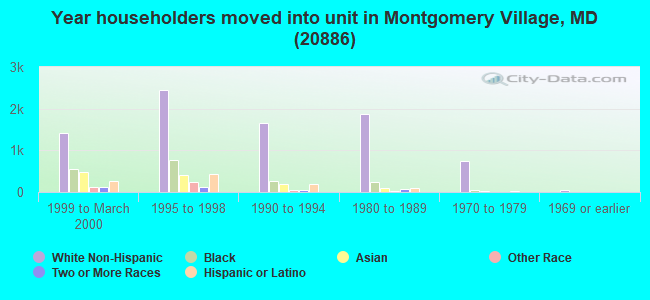
51% of the 20886 zip code residents lived in the same house 5 years ago. Out of people who lived in different houses, 62% lived in this county. Out of people who lived in different counties, 50% lived in Maryland.
91% of the 20886 zip code residents lived in the same house 1 year ago. Out of people who lived in different houses, 58% moved from this county. Out of people who lived in different houses, 14% moved from different county within same state. Out of people who lived in different houses, 19% moved from different state. Out of people who lived in different houses, 10% moved from abroad.
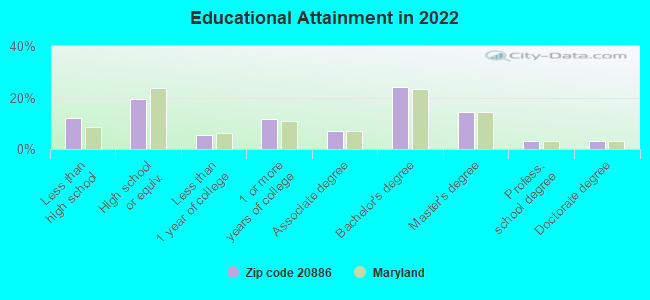
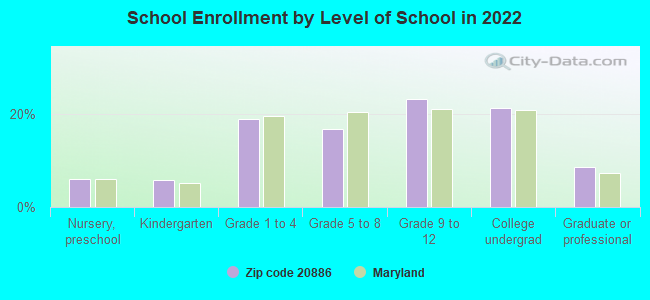
Private vs. public school enrollment:
Students in private schools in grades 1 to 8 (elementary and middle school): 300
Here:
10.5%
Maryland:
15.2%
Students in private schools in grades 9 to 12 (high school): 137
Here:
7.4%
Maryland:
14.4%
Students in private undergraduate colleges: 132
Here:
7.7%
Maryland:
20.2%
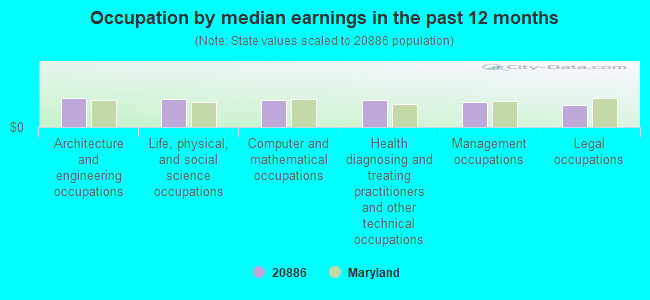
Occupation by median earnings in the past 12 months ($)
109,052Architecture and engineering occupations
103,990Life, physical, and social science occupations
102,076Computer and mathematical occupations
99,250Health diagnosing and treating practitioners and other technical occupations
91,790Management occupations
81,266Legal occupations
Companies with biggest federal contracts located in this zip code:
NTI CORPORATION (2 MEADOWCROFT CT in MONTGOMERY VIL, MD) : $10,169,511 in 277 contractsfrom 1999 to 2006
Contracts for Defense Ships -- Basic Research (R&D), Defense Ships -- Advanced Development (R&D), Services -- Advanced Development (R&D), Defense Ships -- Applied Research and Exploratory Development (R&D), and moreby Navy Signed by year:2000: $582,014; 2001: $944,978; 2002: $1,420,246; 2003: $1,573,840; 2004: $2,170,512; 2005: $1,889,125; 2006: $1,513,796.
Biggest contracts:
$1,044,576 with Navy for Defense Ships -- Basic Research (R&D). Signed on 2006-06-29. Completion date: 2011-06-30.
$257,000 with Navy for Defense Ships -- Advanced Development (R&D). Signed on 2004-11-22. Completion date: 2005-06-30.
$200,000, same as above.Signed on 2004-09-01. Completion date: 2006-07-30.
$184,241 with Navy for Services -- Advanced Development (R&D). Signed on 2003-12-05. Completion date: 2004-03-17.
CSI ENGINEERING, P C (9426 STEWARTOWN ROAD in MONTGOMERY VIL, MD; small business) : $4,858,690 in 35 contractsfrom 2001 to 2006
Contracts for Other Architect and Engineering Services, Other Professional Services, Other Administrative Support Services, Pipe, Tube and Rigid Tubing by Army, ENERGY, Department of, SOCIAL SECURITY ADMINISTRATION Signed by year:2000: $0; 2001: $41,000; 2002: $291,070; 2003: $669,110; 2004: $1,234,825; 2005: $2,083,163; 2006: $539,522.
Biggest contracts:
$454,599 with Army for Other Architect and Engineering Services. Signed on 2005-08-24. Completion date: 2006-02-24.
$442,120 with ENERGY, Department of for Other Professional Services. Signed on 2005-02-01. Completion date: 2006-07-03.
$383,110, same as above.Signed on 2003-07-15. Completion date: 2006-07-15.
$291,070 with Army for Other Administrative Support Services. Signed on 2002-11-15. Completion date: 2003-09-30.
SPITFIRE TECHNOLOGIES, INC (19572 CLUB HOUSE RD in MONTGOMERY VIL, MD; small business) : $2,829,263 in 23 contractsfrom 2000 to 2006
Contracts for Defense Tank - Automotive -- Advanced Development (R&D), Defense Ships -- Basic Research (R&D), Technical Assistance by Navy Signed by year:2000: $178,753; 2001: $0; 2002: $484,500; 2003: $622,675; 2004: $480,000; 2005: $823,335; 2006: $240,000.
Biggest contracts:
$255,164 with Navy for Defense Tank - Automotive -- Advanced Development (R&D). Signed on 2005-09-15. Completion date: 2006-09-30.
$249,000 with Navy for Defense Ships -- Basic Research (R&D). Signed on 2005-03-24. Completion date: 2006-09-30.
$240,000, same as above.Signed on 2006-03-06. Completion date: 2006-12-31.
$240,000, same as above.Signed on 2004-07-28. Completion date: 2005-02-28.
MELISA SHARP (8839 THOMAS LEA TER in MONTGOMERY VIL, MD; small business) : $453,407 in 7 contractsfrom 2002 to 2006
Contracts for Nursing Services, Other Medical Services by Navy Signed by year:2000: $0; 2001: $0; 2002: $178,621; 2003: $85,978; 2004: $89,930; 2005: $70,278; 2006: $28,600.
Biggest contracts:
$89,930 with Navy for Nursing Services. Signed on 2004-10-01. Completion date: 2005-09-30.
$85,978, same as above.Signed on 2003-10-01. Completion date: 2004-09-30.
$81,578, same as above.Signed on 2002-10-01. Completion date: 2001-09-30.
$77,694, same as above.Signed on 2002-10-01. Completion date: 2001-09-30.
THE DESKTOP DESIGNER (9422 AMBOY ROAD in GAITHERSBURG, MD; small business) : $151,890 in 6 contractsfrom 2001 to 2003
Contracts for Other Defense -- Basic Research (R&D), Other Defense -- Applied Research and Exploratory Development (R&D), Other Management Support Services by Navy Signed by year:2000: $0; 2001: $41,765; 2002: $62,875; 2003: $47,250; 2004: $0; 2005: $0; 2006: $0.
Biggest contracts:
$41,765 with Navy for Other Defense -- Basic Research (R&D). Signed on 2001-09-25. Completion date: 2001-09-30.
$32,875 with Navy for Other Defense -- Applied Research and Exploratory Development (R&D). Signed on 2002-06-14. Completion date: 2002-09-30.
$31,500 with Navy for Other Management Support Services. Signed on 2003-09-30. Completion date: 2004-09-30.
$30,000 with Navy for Other Defense -- Basic Research (R&D). Signed on 2002-03-02. Completion date: 2002-09-30.
NEXOR LTD (19310 MONTGOMERY VILLAGE in GAITHERSBURG, MD; small business)
$100,000 with Department of Defense for ADP Software. Signed on 2000-03-06. Completion date: 2001-03-06.
PETER M ZAWADSKY (9429 CHATTEROY PL in MONTGOMRY VILL, MD; small business) : $76,184 in 2 contractsfrom 1999 to 2004
$41,184 with Army for Education Services. Taking place in DC. Signed on 2004-11-17. Completion date: 2005-09-30.
$35,000 with Army for Pediatric Services. Taking place in DC. Signed on 1999-12-15. Completion date: 2000-09-30.
COOK, HANEY & MC KENNA, INC. (19105 BROOKE GROVE COURT in MONTGOMERY VIL, MD; small business) : $71,123 in 4 contractsfrom 1999 to 2000
$83,600 with Army for Expert Witness. Signed on 1999-12-14. Completion date: 1999-11-01.
$43,000, same as above.Signed on 1999-12-15. Completion date: 1999-12-08.
$0, same as above.Signed on 1999-12-15. Completion date: 1999-12-08.
-$55,477, same as above.Signed on 2000-05-17. Completion date: 1999-11-01.
HEALTH SERVICES GROUP INC (19271 MONTGOMERY VILLAGE in MONTGOMERY VIL, MD; small business) : $6,650 in 2 contractsfrom 2004 to 2005
$4,638 with Army for Replenishable Field Medical Sets, Kits, and Outfits. Signed on 2005-09-14. Completion date: 2005-09-30.
$2,012 with Army for Optical Sighting and Ranging Equipment. Signed on 2004-09-29. Completion date: 2004-10-22.
RICHARD N WRIGHT, PH D, PE (20081 DOOLITTLE STREET in MONTGOMERY VIL, MD; small business)
$4,885 with U.S. Army Corps of Engineers - civil program financing only for Program Evaluation Services. Signed on 2002-09-18. Completion date: 2002-11-15.
Top industries in this zip code by the number of employees in 2005:
Arts, Entertainment, and Recreation: Fitness and Recreational Sports Centers (250-499 employees: 1 establishment)
Health Care and Social Assistance: Offices of Physicians (except Mental Health Specialists) (20-49: 4, 10-19: 6, 5-9: 2, 1-4: 12)
Administrative and Support and Waste Management and Remediation Services: Janitorial Services (100-249: 1, 20-49: 1, 5-9: 1, 1-4: 9)
Administrative and Support and Waste Management and Remediation Services: Office Administrative Services (100-249: 1, 20-49: 1, 1-4: 1)
Professional, Scientific, and Technical Services: Administrative Management and General Management Consulting Services (100-249: 1, 1-4: 13)
Arts, Entertainment, and Recreation: Promoters of Performing Arts, Sports, and Similar Events without Facilities (50-99: 2, 20-49: 1)
Other Services (except Public Administration): Other Similar Organizations (except Business, Professional, Labor, and Political Organizations) (100-249: 1, 5-9: 1, 1-4: 2)
Health Care and Social Assistance: Offices of Dentists (10-19: 5, 5-9: 7, 1-4: 5)
Arts, Entertainment, and Recreation: Theater Companies and Dinner Theaters (50-99: 1, 20-49: 1, 1-4: 2)
People in group quarters in 2010:
90 people in nursing facilities/skilled-nursing facilities
30 people in group homes intended for adults
8 people in emergency and transitional shelters (with sleeping facilities) for people experiencing homelessness
3 people in residential treatment centers for adults
2 people in group homes for juveniles (non-correctional)
People in group quarters in 2000:
107 people in nursing homes
21 people in homes for the mentally ill
17 people in homes for the mentally retarded
12 people in other noninstitutional group quarters
8 people in job corps and vocational training facilities
2 people in other nonhousehold living situations
Fatal accident statistics in 2013:
Fatal accident count: 1
Vehicles involved in fatal accidents: 1
Fatal accidents caused by drunken drivers: 0
Fatalities: 1
Persons involved in fatal accidents: 1
Pedestrians involved in fatal accidents: 0
Fatal accident statistics in 2012:
Fatal accident count: 2
Vehicles involved in fatal accidents: 2
Fatal accidents caused by drunken drivers: 2
Fatalities: 2
Persons involved in fatal accidents: 2
Pedestrians involved in fatal accidents: 0
Home Mortgage Disclosure Act Aggregated Statistics For Year 2009 (Based on 2 full and 12 partial tracts)
A) FHA, FSA/RHS & VA Home Purchase Loans
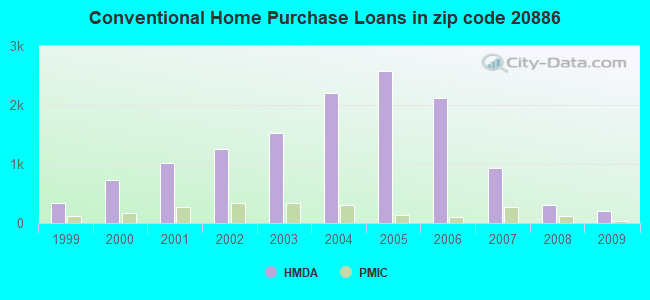
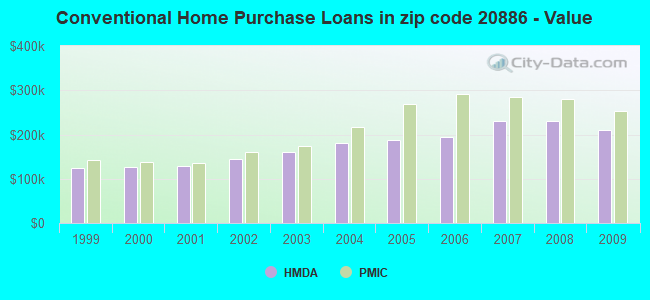
B) Conventional Home Purchase Loans
C) Refinancings
D) Home Improvement Loans
E) Loans on Dwellings For 5+ Families
F) Non-occupant Loans on < 5 Family Dwellings (A B C & D)
Number
Average Value
Number
Average Value
Number
Average Value
Number
Average Value
Number
Average Value
Number
Average Value
LOANS ORIGINATED
430
$219,729
197
$209,108
984
$231,077
33
$103,674
3
$22,373,477
65
$123,890
APPLICATIONS APPROVED, NOT ACCEPTED
26
$180,604
13
$193,721
111
$251,923
11
$18,084
0
$0
15
$167,812
APPLICATIONS DENIED
62
$191,911
29
$167,512
471
$240,779
39
$61,954
2
$39,930
55
$160,808
APPLICATIONS WITHDRAWN
59
$198,584
35
$193,641
293
$254,192
12
$138,382
0
$0
27
$142,264
FILES CLOSED FOR INCOMPLETENESS
17
$206,206
6
$178,752
79
$216,236
4
$107,782
0
$0
14
$198,254
Aggregated Statistics For Year 2008 (Based on 2 full and 12 partial tracts)
A) FHA, FSA/RHS & VA Home Purchase Loans
B) Conventional Home Purchase Loans
C) Refinancings
D) Home Improvement Loans
E) Loans on Dwellings For 5+ Families
F) Non-occupant Loans on < 5 Family Dwellings (A B C & D)
G) Loans On Manufactured Home Dwelling (A B C & D)
Number
Average Value
Number
Average Value
Number
Average Value
Number
Average Value
Number
Average Value
Number
Average Value
Number
Average Value
LOANS ORIGINATED
299
$239,674
310
$230,122
673
$230,477
74
$60,718
1
$12,377,250
85
$169,345
0
$0
APPLICATIONS APPROVED, NOT ACCEPTED
23
$205,740
24
$210,250
122
$224,823
24
$91,257
0
$0
9
$170,073
0
$0
APPLICATIONS DENIED
48
$216,166
63
$229,290
670
$262,930
110
$103,290
0
$0
42
$192,550
2
$51,910
APPLICATIONS WITHDRAWN
56
$220,772
77
$248,831
251
$273,635
13
$164,698
0
$0
25
$196,310
0
$0
FILES CLOSED FOR INCOMPLETENESS
5
$253,462
20
$231,668
48
$263,812
5
$99,074
0
$0
19
$222,183
0
$0
Aggregated Statistics For Year 2007 (Based on 2 full and 12 partial tracts)
A) FHA, FSA/RHS & VA Home Purchase Loans
B) Conventional Home Purchase Loans
C) Refinancings
D) Home Improvement Loans
E) Loans on Dwellings For 5+ Families
F) Non-occupant Loans on < 5 Family Dwellings (A B C & D)
G) Loans On Manufactured Home Dwelling (A B C & D)
Number
Average Value
Number
Average Value
Number
Average Value
Number
Average Value
Number
Average Value
Number
Average Value
Number
Average Value
LOANS ORIGINATED
57
$286,349
928
$229,469
1,374
$221,414
175
$103,132
1
$9,397,800
173
$205,064
0
$0
APPLICATIONS APPROVED, NOT ACCEPTED
0
$0
135
$209,323
286
$213,002
42
$81,451
0
$0
44
$195,734
1
$21,930
APPLICATIONS DENIED
13
$263,601
238
$214,657
1,059
$257,809
128
$125,998
0
$0
46
$231,038
0
$0
APPLICATIONS WITHDRAWN
6
$271,045
132
$234,192
476
$242,215
28
$131,679
0
$0
32
$207,962
0
$0
FILES CLOSED FOR INCOMPLETENESS
0
$0
42
$222,007
195
$259,353
9
$127,111
0
$0
18
$252,106
0
$0
Aggregated Statistics For Year 2006 (Based on 2 full and 12 partial tracts)
A) FHA, FSA/RHS & VA Home Purchase Loans
B) Conventional Home Purchase Loans
C) Refinancings
D) Home Improvement Loans
F) Non-occupant Loans on < 5 Family Dwellings (A B C & D)
G) Loans On Manufactured Home Dwelling (A B C & D)
Number
Average Value
Number
Average Value
Number
Average Value
Number
Average Value
Number
Average Value
Number
Average Value
LOANS ORIGINATED
24
$248,615
2,119
$194,302
2,275
$219,531
224
$113,359
244
$189,785
4
$88,258
APPLICATIONS APPROVED, NOT ACCEPTED
0
$0
155
$175,773
383
$203,145
72
$67,950
31
$215,204
1
$73,560
APPLICATIONS DENIED
7
$284,610
467
$195,292
1,032
$224,579
140
$102,894
102
$182,626
2
$132,315
APPLICATIONS WITHDRAWN
2
$256,005
190
$214,604
714
$217,046
36
$220,653
80
$203,002
0
$0
FILES CLOSED FOR INCOMPLETENESS
2
$257,430
60
$204,286
256
$229,210
11
$95,491
12
$189,552
1
$359,560
Aggregated Statistics For Year 2005 (Based on 2 full and 12 partial tracts)
A) FHA, FSA/RHS & VA Home Purchase Loans
B) Conventional Home Purchase Loans
C) Refinancings
D) Home Improvement Loans
E) Loans on Dwellings For 5+ Families
F) Non-occupant Loans on < 5 Family Dwellings (A B C & D)
G) Loans On Manufactured Home Dwelling (A B C & D)
Number
Average Value
Number
Average Value
Number
Average Value
Number
Average Value
Number
Average Value
Number
Average Value
Number
Average Value
LOANS ORIGINATED
22
$228,870
2,570
$187,571
2,934
$207,202
218
$122,704
0
$0
384
$172,269
1
$22,310
APPLICATIONS APPROVED, NOT ACCEPTED
7
$181,993
238
$172,331
350
$195,440
56
$74,787
0
$0
37
$166,275
5
$52,696
APPLICATIONS DENIED
5
$241,006
456
$180,470
960
$205,096
140
$66,860
0
$0
70
$158,294
1
$24,020
APPLICATIONS WITHDRAWN
5
$201,914
312
$184,535
1,064
$198,921
86
$145,755
1
$131,360
73
$192,693
0
$0
FILES CLOSED FOR INCOMPLETENESS
0
$0
63
$158,797
223
$230,017
22
$78,640
0
$0
8
$154,405
1
$200,750
Aggregated Statistics For Year 2004 (Based on 2 full and 12 partial tracts)
A) FHA, FSA/RHS & VA Home Purchase Loans
B) Conventional Home Purchase Loans
C) Refinancings
D) Home Improvement Loans
F) Non-occupant Loans on < 5 Family Dwellings (A B C & D)
G) Loans On Manufactured Home Dwelling (A B C & D)
Number
Average Value
Number
Average Value
Number
Average Value
Number
Average Value
Number
Average Value
Number
Average Value
LOANS ORIGINATED
149
$197,798
2,209
$180,365
2,961
$173,205
192
$105,613
350
$150,825
0
$0
APPLICATIONS APPROVED, NOT ACCEPTED
5
$163,518
147
$178,387
371
$175,181
53
$65,962
23
$141,835
1
$215,430
APPLICATIONS DENIED
8
$226,664
298
$160,378
1,013
$171,460
170
$68,930
62
$140,440
0
$0
APPLICATIONS WITHDRAWN
16
$173,052
181
$175,449
886
$172,476
46
$56,741
27
$169,000
1
$57,100
FILES CLOSED FOR INCOMPLETENESS
8
$171,242
40
$175,829
171
$191,430
14
$74,761
11
$145,605
0
$0
Aggregated Statistics For Year 2003 (Based on 2 full and 12 partial tracts)
A) FHA, FSA/RHS & VA Home Purchase Loans
B) Conventional Home Purchase Loans
C) Refinancings
D) Home Improvement Loans
E) Loans on Dwellings For 5+ Families
F) Non-occupant Loans on < 5 Family Dwellings (A B C & D)
Number
Average Value
Number
Average Value
Number
Average Value
Number
Average Value
Number
Average Value
Number
Average Value
LOANS ORIGINATED
237
$177,071
1,529
$161,311
5,419
$153,140
112
$24,321
1
$1,706,220
336
$119,817
APPLICATIONS APPROVED, NOT ACCEPTED
10
$177,855
120
$143,342
709
$142,071
56
$27,657
0
$0
73
$104,607
APPLICATIONS DENIED
17
$152,815
156
$153,912
1,131
$140,316
113
$29,376
0
$0
54
$115,899
APPLICATIONS WITHDRAWN
22
$167,740
161
$169,872
1,006
$152,568
14
$52,966
0
$0
47
$115,899
FILES CLOSED FOR INCOMPLETENESS
3
$139,680
25
$157,738
163
$139,654
6
$25,612
0
$0
12
$140,521
Aggregated Statistics For Year 2002 (Based on 2 full and 8 partial tracts)
A) FHA, FSA/RHS & VA Home Purchase Loans
B) Conventional Home Purchase Loans
C) Refinancings
D) Home Improvement Loans
E) Loans on Dwellings For 5+ Families
F) Non-occupant Loans on < 5 Family Dwellings (A B C & D)
Number
Average Value
Number
Average Value
Number
Average Value
Number
Average Value
Number
Average Value
Number
Average Value
LOANS ORIGINATED
448
$142,276
1,258
$144,910
2,927
$152,392
70
$25,641
0
$0
203
$105,245
APPLICATIONS APPROVED, NOT ACCEPTED
5
$176,382
49
$129,770
356
$132,033
31
$31,173
0
$0
14
$81,360
APPLICATIONS DENIED
23
$127,612
75
$124,591
637
$121,553
84
$26,252
0
$0
13
$115,130
APPLICATIONS WITHDRAWN
26
$130,564
95
$152,374
572
$137,221
35
$35,617
2
$110,810
32
$97,323
FILES CLOSED FOR INCOMPLETENESS
11
$165,061
23
$153,282
110
$130,901
1
$59,780
0
$0
8
$118,405
Aggregated Statistics For Year 2001 (Based on 2 full and 8 partial tracts)
A) FHA, FSA/RHS & VA Home Purchase Loans
B) Conventional Home Purchase Loans
C) Refinancings
D) Home Improvement Loans
F) Non-occupant Loans on < 5 Family Dwellings (A B C & D)
Number
Average Value
Number
Average Value
Number
Average Value
Number
Average Value
Number
Average Value
LOANS ORIGINATED
518
$127,845
1,013
$129,855
1,986
$141,253
94
$24,025
140
$101,510
APPLICATIONS APPROVED, NOT ACCEPTED
15
$124,148
56
$117,588
211
$130,266
33
$22,796
13
$78,404
APPLICATIONS DENIED
33
$117,894
85
$112,452
574
$100,191
90
$21,310
24
$88,889
APPLICATIONS WITHDRAWN
37
$114,852
89
$166,731
399
$114,484
31
$31,740
9
$139,776
FILES CLOSED FOR INCOMPLETENESS
7
$101,419
12
$141,415
85
$120,023
2
$61,590
0
$0
Aggregated Statistics For Year 2000 (Based on 2 full and 8 partial tracts)
A) FHA, FSA/RHS & VA Home Purchase Loans
B) Conventional Home Purchase Loans
C) Refinancings
D) Home Improvement Loans
F) Non-occupant Loans on < 5 Family Dwellings (A B C & D)
Number
Average Value
Number
Average Value
Number
Average Value
Number
Average Value
Number
Average Value
LOANS ORIGINATED
575
$118,904
736
$127,557
349
$105,804
84
$23,834
47
$71,078
APPLICATIONS APPROVED, NOT ACCEPTED
17
$129,718
40
$135,459
93
$88,719
49
$21,248
0
$0
APPLICATIONS DENIED
41
$112,757
81
$110,053
287
$74,642
145
$21,734
12
$52,015
APPLICATIONS WITHDRAWN
47
$117,365
61
$159,712
134
$84,707
27
$44,702
1
$95,890
FILES CLOSED FOR INCOMPLETENESS
3
$117,090
8
$150,961
23
$98,532
3
$16,627
0
$0
Aggregated Statistics For Year 1999 (Based on 2 full and 4 partial tracts)
A) FHA, FSA/RHS & VA Home Purchase Loans
B) Conventional Home Purchase Loans
C) Refinancings
D) Home Improvement Loans
E) Loans on Dwellings For 5+ Families
F) Non-occupant Loans on < 5 Family Dwellings (A B C & D)
2004 - 2018 National Fire Incident Reporting System (NFIRS) incidents
According to the data from the years 2004 - 2018 the average number of fires per year is 28. The highest number of reported fire incidents - 43 took place in 2005, and the least - 14 in 2004. The data has an increasing trend.
When looking into fire subcategories, the most reports belonged to: Structure Fires (47.2%), and Outside Fires (36.0%).
Fire incident types reported to NFIRS in Zip Code 20886


 Nearest zip codes: 20876, 20879, 20899, 20877, 20880, 20882.


 According to the data from the years 2004 - 2018 the average number of fires per year is 28. The highest number of reported fire incidents - 43 took place in 2005, and the least - 14 in 2004. The data has an increasing trend.
 When looking into fire subcategories, the most reports belonged to: Structure Fires (47.2%), and Outside Fires (36.0%).