Estimated zip code population in 2022: 32,085 Zip code population in 2010: 29,998 Zip code population in 2000: 28,526
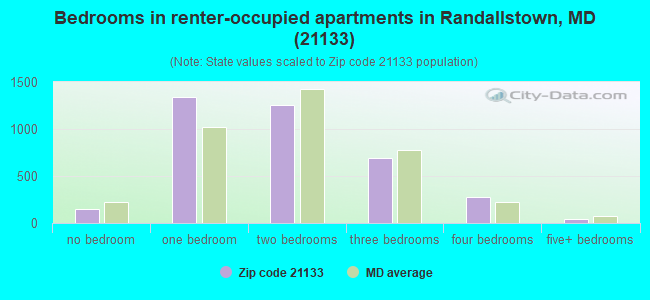
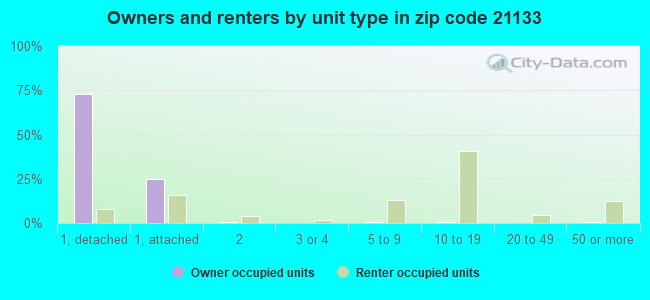
Houses and condos: 12,482 Renter-occupied apartments: 3,762
% of renters here:
30%
State:
32%
March 2022 cost of living index in zip code 21133: 106.0 (more than average, U.S. average is 100)
Land area: 10.1 sq. mi. Water area: 0.0 sq. mi.
Population density: 3,166 people per square mile
(average).
OSM Map
General Map
Google Map
MSN Map
OSM Map
General Map
Google Map
MSN Map
OSM Map
General Map
Google Map
MSN Map
OSM Map
General Map
Google Map
MSN Map
Please wait while loading the map...
Real estate property taxes paid for housing units in 2022:
This zip code:
1.1% ($3,202)
Maryland:
0.9% ($3,777)
Median real estate property taxes paid for housing units with mortgages in 2022: $3,187 (1.1%) Median real estate property taxes paid for housing units with no mortgage in 2022: $3,250 (1.1%)
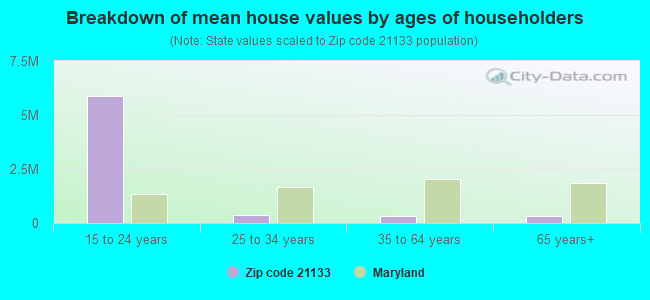
Estimated median house/condo value in 2022: $298,078
21133:
$298,078
Maryland:
$398,100
According to our research of Maryland and other state lists, there were 35 registered sex offenders living in 21133 zip code as of April 27, 2024. The ratio of all residents to sex offenders in zip code 21133 is 970 to 1. The ratio of registered sex offenders to all residents in this zip code is near the state average.
Median resident age:
This zip code:
45.8 years
Maryland median age:
39.7 years
Average household size:
This zip code:
2.5 people
Maryland:
2.5 people
Averages for the 2020 tax year for zip code 21133, filed in 2021:
Average Adjusted Gross Income (AGI) in 2020: $56,648 (Individual Income Tax Returns)
Here:
$56,648
State:
$86,905
Salary/wage: $54,362 (reported on 82.3% of returns)
Here:
$54,362
State:
$73,953
(% of AGI for various income ranges: 1179.2% for AGIs below $25k, 3900.7% for AGIs $25k-50k, 7378.9% for AGIs $50k-75k, 10698.8% for AGIs $75k-100k, 20034.5% for AGIs $100k-200k, 67076.0% for AGIs over 200k)
Taxable interest for individuals: $466 (reported on 23.6% of returns)
This zip code:
$466
Maryland:
$1,528
(% of AGI for various income ranges: 4.3% for AGIs below $25k, 5.6% for AGIs $25k-50k, 15.4% for AGIs $50k-75k, 28.0% for AGIs $75k-100k, 49.3% for AGIs $100k-200k, 267.0% for AGIs over 200k)
Ordinary dividends: $2,493 (reported on 8.2% of returns)
Here:
$2,493
State:
$8,028
(% of AGI for various income ranges: 6.9% for AGIs below $25k, 11.1% for AGIs $25k-50k, 24.1% for AGIs $50k-75k, 43.5% for AGIs $75k-100k, 88.1% for AGIs $100k-200k, 710.0% for AGIs over 200k)
Net capital gain/loss in AGI: +$5,045 (reported on 7.3% of returns)
Here:
+$5,045
State:
+$25,238
(% of AGI for various income ranges: 2.9% for AGIs below $25k, 7.5% for AGIs $25k-50k, 13.9% for AGIs $50k-75k, 43.9% for AGIs $75k-100k, 211.4% for AGIs $100k-200k, 2296.0% for AGIs over 200k)
Profit/loss from business: +$1,302 (reported on 23.1% of returns)
Here:
+$1,302
State:
+$11,398
(% of AGI for various income ranges: 64.1% for AGIs below $25k, 11.5% for AGIs $25k-50k, 6.1% for AGIs $50k-75k, 56.8% for AGIs $75k-100k, 33.9% for AGIs $100k-200k, 1001.0% for AGIs over 200k)
Taxable individual retirement arrangement distribution: $12,663 (reported on 5.0% of returns)
21133:
$12,663
Maryland:
$20,944
(% of AGI for various income ranges: 24.7% for AGIs below $25k, 42.6% for AGIs $25k-50k, 84.5% for AGIs $50k-75k, 159.7% for AGIs $75k-100k, 347.3% for AGIs $100k-200k, 469.0% for AGIs over 200k)
Total itemized deductions: $27,132 (reported on 22.1% of returns)
Here:
$27,132
State:
$30,672
(% of AGI for various income ranges: 78.5% for AGIs below $25k, 309.5% for AGIs $25k-50k, 1029.7% for AGIs $50k-75k, 1877.4% for AGIs $75k-100k, 2918.7% for AGIs $100k-200k, 10382.0% for AGIs over 200k)
Charity contributions: $8,875 (reported on 19.7% of returns)
Here:
$8,875
State:
$9,065
(% of AGI for various income ranges: 12.6% for AGIs below $25k, 77.9% for AGIs $25k-50k, 264.6% for AGIs $50k-75k, 530.6% for AGIs $75k-100k, 934.2% for AGIs $100k-200k, 3552.0% for AGIs over 200k)
Taxes paid: $7,844 (reported on 22.1% of returns)
21133:
$7,844
State:
$8,475
(% of AGI for various income ranges: 18.2% for AGIs below $25k, 68.6% for AGIs $25k-50k, 304.3% for AGIs $50k-75k, 593.9% for AGIs $75k-100k, 929.2% for AGIs $100k-200k, 2057.0% for AGIs over 200k)
Earned income credit: $2,165 (reported on 17.1% of returns)
Here:
$2,165
State:
$2,151
(% of AGI for various income ranges: 98.8% for AGIs below $25k, 74.3% for AGIs $25k-50k)
Percentage of individuals using paid preparers for their 2020 taxes: 89.8%
Here:
90%
State:
90%
(% for various income ranges: 90.1% for AGIs below $25k, 90.6% for AGIs $25k-50k, 89.4% for AGIs $50k-75k, 88.8% for AGIs $75k-100k, 89.7% for AGIs $100k-200k, 87.5% for AGIs over 200k)
Averages for the 2012 tax year for zip code 21133, filed in 2013:
Average Adjusted Gross Income (AGI) in 2012: $50,699 (Individual Income Tax Returns)
Here:
$50,699
State:
$72,703
Salary/wage: $47,949 (reported on 86.3% of returns)
Here:
$47,949
State:
$62,228
(% of AGI for various income ranges: 76.5% for AGIs below $25k, 84.3% for AGIs $25k-50k, 81.9% for AGIs $50k-75k, 82.1% for AGIs $75k-100k, 81.8% for AGIs $100k-200k, 75.0% for AGIs over 200k)
Taxable interest for individuals: $512 (reported on 29.5% of returns)
This zip code:
$512
Maryland:
$1,413
(% of AGI for various income ranges: 0.4% for AGIs below $25k, 0.2% for AGIs $25k-50k, 0.3% for AGIs $50k-75k, 0.3% for AGIs $75k-100k, 0.3% for AGIs $100k-200k, 0.5% for AGIs over 200k)
Ordinary dividends: $1,991 (reported on 9.4% of returns)
Here:
$1,991
State:
$6,933
(% of AGI for various income ranges: 0.4% for AGIs below $25k, 0.3% for AGIs $25k-50k, 0.3% for AGIs $50k-75k, 0.3% for AGIs $75k-100k, 0.4% for AGIs $100k-200k, 0.7% for AGIs over 200k)
Net capital gain/loss in AGI: +$952 (reported on 6.0% of returns)
Here:
+$952
State:
+$14,830
(% of AGI for various income ranges: 0.2% for AGIs $100k-200k, 0.8% for AGIs over 200k)
Profit/loss from business: +$2,142 (reported on 18.4% of returns)
Here:
+$2,142
State:
+$12,606
(% of AGI for various income ranges: 5.5% for AGIs below $25k, 0.2% for AGIs $50k-75k, 0.2% for AGIs $75k-100k, 0.4% for AGIs $100k-200k, 3.0% for AGIs over 200k)
Taxable individual retirement arrangement distribution: $11,067 (reported on 6.5% of returns)
21133:
$11,067
Maryland:
$17,065
(% of AGI for various income ranges: 1.6% for AGIs below $25k, 1.2% for AGIs $25k-50k, 1.5% for AGIs $50k-75k, 1.4% for AGIs $75k-100k, 1.7% for AGIs $100k-200k)
Total itemized deductions: $22,602 (30% of AGI, reported on 49.3% of returns)
Here:
$22,602
State:
$27,886
Here:
29.7% of AGI
State:
22.8% of AGI
(% of AGI for various income ranges: 13.9% for AGIs below $25k, 18.9% for AGIs $25k-50k, 24.8% for AGIs $50k-75k, 24.9% for AGIs $75k-100k, 23.2% for AGIs $100k-200k, 18.4% for AGIs over 200k)
Charity contributions: $4,902 (reported on 43.6% of returns)
Here:
$4,902
State:
$4,452
(% of AGI for various income ranges: 2.0% for AGIs below $25k, 3.4% for AGIs $25k-50k, 4.6% for AGIs $50k-75k, 4.9% for AGIs $75k-100k, 4.9% for AGIs $100k-200k, 3.4% for AGIs over 200k)
Taxes paid: $7,144 (reported on 49.2% of returns)
21133:
$7,144
State:
$11,690
(% of AGI for various income ranges: 2.6% for AGIs below $25k, 4.6% for AGIs $25k-50k, 7.3% for AGIs $50k-75k, 8.1% for AGIs $75k-100k, 8.5% for AGIs $100k-200k, 8.4% for AGIs over 200k)
Earned income credit: $2,286 (reported on 19.7% of returns)
Here:
$2,286
State:
$2,199
(% of AGI for various income ranges: 7.9% for AGIs below $25k, 1.1% for AGIs $25k-50k)
Percentage of individuals using paid preparers for their 2012 taxes: 52.3%
Here:
52%
State:
52%
(% for various income ranges: 49.9% for AGIs below $25k, 49.9% for AGIs $25k-50k, 54.5% for AGIs $50k-75k, 56.6% for AGIs $75k-100k, 56.1% for AGIs $100k-200k, 71.4% for AGIs over 200k)
Averages for the 2004 tax year for zip code 21133, filed in 2005:
Average Adjusted Gross Income (AGI) in 2004: $44,825 (Individual Income Tax Returns)
Here:
$44,825
State:
$60,339
Salary/wage: $43,290 (reported on 88.8% of returns)
Here:
$43,290
State:
$52,211
(% of AGI for various income ranges: 100.7% for AGIs below $10k, 80.6% for AGIs $10k-25k, 87.8% for AGIs $25k-50k, 87.5% for AGIs $50k-75k, 87.7% for AGIs $75k-100k, 81.3% for AGIs over 100k)
Taxable interest for individuals: $815 (reported on 36.5% of returns)
This zip code:
$815
Maryland:
$1,701
(% of AGI for various income ranges: 2.1% for AGIs below $10k, 1.0% for AGIs $10k-25k, 0.7% for AGIs $25k-50k, 0.5% for AGIs $50k-75k, 0.7% for AGIs $75k-100k, 0.5% for AGIs over 100k)
Taxable dividends: $1,756 (reported on 13.0% of returns)
Here:
$1,756
State:
$4,235
(% of AGI for various income ranges: 1.2% for AGIs below $10k, 0.7% for AGIs $10k-25k, 0.4% for AGIs $25k-50k, 0.4% for AGIs $50k-75k, 0.4% for AGIs $75k-100k, 0.7% for AGIs over 100k)
Net capital gain/loss: +$4,071 (reported on 9.3% of returns)
Here:
+$4,071
State:
+$15,888
(% of AGI for various income ranges: -0.4% for AGIs below $10k, -0.0% for AGIs $10k-25k, 0.1% for AGIs $25k-50k, 0.2% for AGIs $50k-75k, 0.3% for AGIs $75k-100k, 3.1% for AGIs over 100k)
Profit/loss from business: +$2,720 (reported on 15.5% of returns)
Here:
+$2,720
State:
+$12,221
(% of AGI for various income ranges: 3.2% for AGIs below $10k, 2.8% for AGIs $10k-25k, 1.0% for AGIs $25k-50k, 0.5% for AGIs $50k-75k, 0.3% for AGIs $75k-100k, 1.1% for AGIs over 100k)
IRA payment deduction: $2,719 (reported on 2.2% of returns)
21133:
$2,719
Maryland:
$2,968
(% of AGI for various income ranges: 0.2% for AGIs below $10k, 0.3% for AGIs $10k-25k, 0.2% for AGIs $25k-50k, 0.1% for AGIs $50k-75k, 0.1% for AGIs $75k-100k, 0.1% for AGIs over 100k)
Self-employed pension: $7,409 (reported on 0.2% of returns)
Here:
$7,409
Maryland:
$17,155
Total itemized deductions: $20,190 (31% of AGI, reported on 53.8% of returns)
Here:
$20,190
State:
$22,960
Here:
31.4% of AGI
State:
23.3% of AGI
(% of AGI for various income ranges: 13.2% for AGIs below $10k, 15.4% for AGIs $10k-25k, 24.0% for AGIs $25k-50k, 28.4% for AGIs $50k-75k, 26.7% for AGIs $75k-100k, 22.0% for AGIs over 100k)
Charity contributions deductions: $4,584 (7% of AGI, reported on 50.5% of returns)
Here:
$4,584
State:
$4,031
Here:
7.0% of AGI
State:
3.9% of AGI
(% of AGI for various income ranges: 1.5% for AGIs below $10k, 2.5% for AGIs $10k-25k, 5.0% for AGIs $25k-50k, 5.8% for AGIs $50k-75k, 5.8% for AGIs $75k-100k, 5.3% for AGIs over 100k)
Total tax: $5,014 (reported on 75.1% of returns)
21133:
$5,014
State:
$10,167
(% of AGI for various income ranges: 2.8% for AGIs below $10k, 3.6% for AGIs $10k-25k, 5.6% for AGIs $25k-50k, 7.9% for AGIs $50k-75k, 9.1% for AGIs $75k-100k, 13.2% for AGIs over 100k)
Earned income credit: $1,730 (reported on 16.7% of returns)
Here:
$1,730
State:
$1,700
Percentage of individuals using paid preparers for their 2004 taxes: 55.2%
Here:
55%
State:
55%
(% for various income ranges: 47.4% for AGIs below $10k, 56.9% for AGIs $10k-25k, 55.5% for AGIs $25k-50k, 57.5% for AGIs $50k-75k, 56.4% for AGIs $75k-100k, 57.9% for AGIs over 100k)
Likely homosexual households (counted as self-reported same-sex unmarried-partner households)
Lesbian couples: 0.0% of all households
Gay men: 0.1% of all households
Household received Food Stamps/SNAP in the past 12 months: 1,894 Household did not receive Food Stamps/SNAP in the past 12 months: 10,504
Women who had a birth in the past 12 months: 313 (211 now married, 102 unmarried) Women who did not have a birth in the past 12 months: 6,665 (2,119 now married, 4,545 unmarried)
Housing units in zip code 21133 with a mortgage: 6,798 (766 second mortgage, 12 home equity loan, 611 both second mortgage and home equity loan) Houses without a mortgage: 115
Median monthly owner costs for units with a mortgage: $1,792 Median monthly owner costs for units without a mortgage: $599
Residents with income below the poverty level in 2022:
This zip code:
11.1%
Whole state:
9.6%
Residents with income below 50% of the poverty level in 2022:
This zip code:
6.5%
Whole state:
4.7%
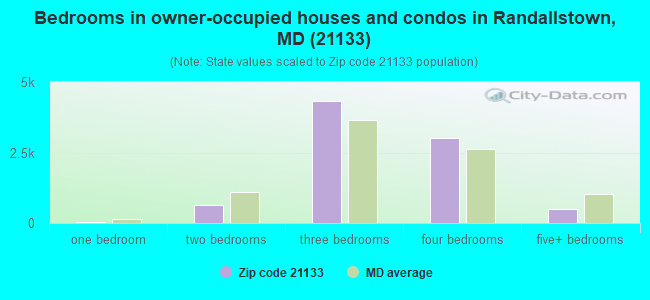
Median number of rooms in houses and condos:
Here:
7.6
State:
7.3
Median number of rooms in apartments:
Here:
4.3
State:
4.2
Notable locations in this zip code not listed on our city pages
Notable locations in zip code 21133: Laurel Hill Country Club (A), Baltimore County Fire Department Station 18 Randallstown (B), Liberty Road Volunteer Fire Company Station 46 (C), Randallstown Center Nursing Home (D), Chapel Hill Nursing Center (E), Randallstown Area Branch Baltimore County Public Library (F). Display/hide their locations on the map
Shopping Centers: Deer Park Plaza Shopping Center (1), Marriott Plaza Shopping Center (2), Brenbrook Plaza Shopping Center (3), Liberty Court Shopping Center (4), Liberty Plaza Shopping Center (5), Randallstown Plaza Shopping Center (6), Kings Point Square Shopping Center (7). Display/hide their locations on the map
Churches in zip code 21133 include: Congregation Beth Israel (A), Mount Olive Church (B), Mount Paran Church (C), Union Bethel African Methodist Episcopal Church (D). Display/hide their locations on the map
In group quarters: 617 (-1 institutionalized population)
Size of family households: 3,280 2-persons, 2,151 3-persons, 1,313 4-persons, 633 5-persons, 320 6-persons, 197 7-or-more-persons
Size of nonfamily households: 3,914 1-person, 522 2-persons, 23 3-persons
3,648 married couples with children.
1,590 single-parent households (183 men, 1,407 women).
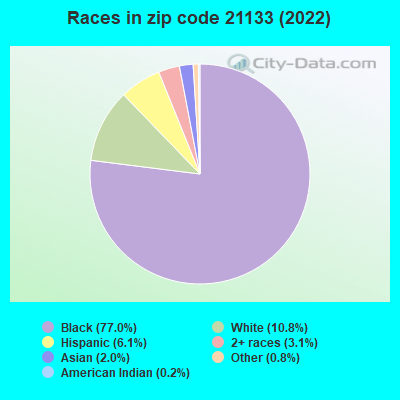
84.2% of residents of 21133 zip code speak English at home.
5.0% of residents speak Spanish at home (48% very well, 28% well, 22% not well, 1% not at all).
2.2% of residents speak other Indo-European language at home (61% very well, 26% well, 9% not well, 4% not at all).
1.0% of residents speak Asian or Pacific Island language at home (65% very well, 7% well, 29% not well).
8.3% of residents speak other language at home (78% very well, 17% well, 3% not well, 2% not at all).
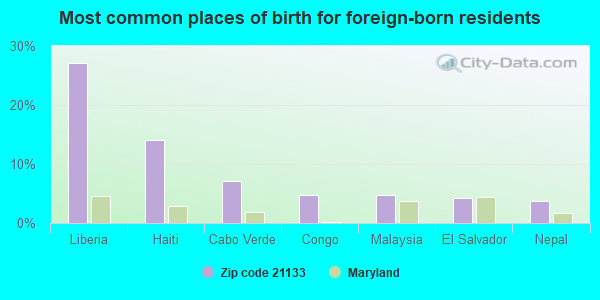
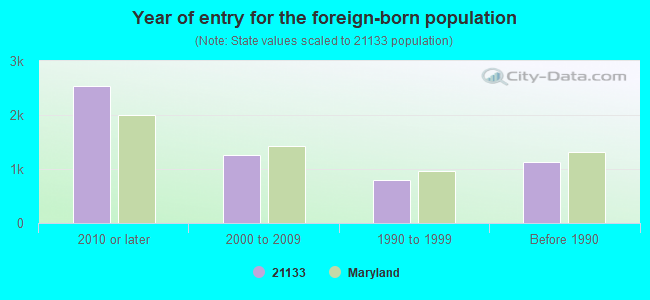
Foreign born population: 4,887 (15.2%) (59.7% of them are naturalized citizens)
Major facilities with environmental interests located in this zip code:
BALTIMORE COUNTY GENERAL HOSPITAL (5401 OLD COURT ROAD in RANDALLSTOWN, MD)
AIR MAJOR (AIRS/AFS) STATE MASTER (Maryland Permits tracking) - OIL CONTROL STATE MASTER (Maryland Air Emissions Database) - AIR MAJOR CRITERIA AND HAZARDOUS AIR POLLUTANT INVENTORY (Inventory of air pollution sources) (Resource Conservation and Recovery Act (tracking hazardous waste)) Business SIC and NAICS classification: GENERAL MEDICAL AND SURGICAL HOSPITALS Organizations: OPERNAME (CONTACT/OPERATOR)
, OWNERNAME (CONTACT/OWNER)
Alternative names: NORTHWEST HOSPITAL CENTER
BP SERVICE STATION #1171 (8710 LIBERTY ROAD in RANDALLSTOWN, MD)
AIR MINOR (AIRS/AFS) STATE MASTER (Maryland Permits tracking) - OIL CONTROL STATE MASTER (Maryland Air Emissions Database) - AIR MINOR Small Quantity Generators, between 100 kg and 1000 kg of hazardous waste/month (Resource Conservation and Recovery Act (tracking hazardous waste)) - notification Business SIC classification: GASOLINE SERVICE STATIONS Organizations: OPERNAME (CONTACT/OPERATOR)
, AMOCO OIL COMPANY (CONTACT/OWNER)
Alternative names: AMOCO #1171-TANKS, AMOCO OIL COMPANY, BP - 8710 LIBERTY ROAD, BP AMOCO S.S. # 1171
RANDALLSTOWN ELEMENTARY SCHOOL (9013 LIBERTY ROAD in RANDALLSTOWN, MD)
AIR MINOR (AIRS/AFS) STATE MASTER (Maryland Air Emissions Database) - AIR MINOR (National Center for Education Statistics) - STATE ID-030202 Small Quantity Generators, between 100 kg and 1000 kg of hazardous waste/month (Resource Conservation and Recovery Act (tracking hazardous waste)) - notification Business SIC classification: ELEMENTARY AND SECONDARY SCHOOLS Organizations: BALTIMORE COUNTY PUBLIC SCHOOLS (CONTACT/OWNER)
BETH ISRAEL MIKRE KODESH CONGREG (9411 LIBERTY ROAD in RANDALLSTOWN, MD)
AIR MINOR (AIRS/AFS) (Integrated Compliance Information System) - ICIS-03-1989-0598, FORMAL ENFORCEMENT ACTION STATE MASTER (Maryland Air Emissions Database) - AIR MINOR COMPLIANCE ACTIVITY (Tracking inspections of insecticide, fungicide, and rodenticide, and toxic substances) Business SIC classification: CHILD DAY CARE SERVICES; RELIGIOUS ORGANIZATIONS Alternative names: BETH ISRAEL MIKRE KODESH CONGREGATN, BETH ISRAEL NURSERY SCHOOL
BETTY BRITE - 8630 LIBERTY ROAD (8630 LIBERTY ROAD in RANDALLSTOWN, MD)
AIR MINOR (AIRS/AFS) STATE MASTER (Maryland Air Emissions Database) - AIR MINOR Conditionally Exempt Small Quantity Generators, less than 100 kg/month of hazardous waste (Resource Conservation and Recovery Act (tracking hazardous waste)) - notification Business SIC classification: DRYCLEANING PLANTS, EXCEPT RUG CLEANING Organizations: OPERNAME (CONTACT/OPERATOR)
, OLGA & JAMIE FLAKS (CONTACT/OWNER)
Alternative names: BETTY BRITE CLEANERS, BETTY BRITE CLEANERS - RANDALLSTOWN
ANTWERPEN CHEVROLET GEO (9400 LIBERTY ROAD in RANDALLSTOWN, MD)
AIR MINOR (AIRS/AFS) STATE MASTER (Maryland Air Emissions Database) - AIR MINOR Small Quantity Generators, between 100 kg and 1000 kg of hazardous waste/month (Resource Conservation and Recovery Act (tracking hazardous waste)) - notification Business SIC classification: MOTOR VEHICLE DEALERS (NEW AND USED) Organizations: OPERNAME (CONTACT/OPERATOR)
, ANTWERPEN JACOB (CONTACT/OWNER)
KINGS VALET CLEANERS (9972 LIBERTY ROAD in RANDALLSTOWN, MD)
AIR MINOR (AIRS/AFS) STATE MASTER (Maryland Air Emissions Database) - AIR MINOR Small Quantity Generators, between 100 kg and 1000 kg of hazardous waste/month (Resource Conservation and Recovery Act (tracking hazardous waste)) - notification Business SIC classification: DRYCLEANING PLANTS, EXCEPT RUG CLEANING Organizations: OPERNAME (CONTACT/OPERATOR)
, ROSENBERG LYNN (CONTACT/OWNER)
Alternative names: DRY CLEAN USA
OLD CAR JOHN (10206 LIBERTY ROAD in RANDALLSTOWN, MD)
AIR MINOR (AIRS/AFS) STATE MASTER (Maryland Air Emissions Database) - AIR MINOR Conditionally Exempt Small Quantity Generators, less than 100 kg/month of hazardous waste (Resource Conservation and Recovery Act (tracking hazardous waste)) - notification Business SIC classification: TOP, BODY, AND UPHOLSTERY REPAIR SHOPS AND PAINT SHOPS Organizations: OPERNAME (CONTACT/OPERATOR)
, LASCVOLA JAMES T (CONTACT/OWNER)
Alternative names: LASCVOLA MOTOR WORKS
AMOCO #538-TANKS (9802 LIBERTY ROAD in RANDALLSTOWN, MD)
AIR MINOR (AIRS/AFS) STATE MASTER (Maryland Air Emissions Database) - AIR MINOR Small Quantity Generators, between 100 kg and 1000 kg of hazardous waste/month (Resource Conservation and Recovery Act (tracking hazardous waste)) - notification Business SIC classification: GASOLINE SERVICE STATIONS Organizations: OPERNAME (CONTACT/OPERATOR)
, AMOCO OIL COMPANY (CONTACT/OWNER)
Alternative names: AMOCO - 9802 LIBERTY ROAD, CITGO - 9802 LIBERTY ROAD
RANDALLSTOWN CLEANER (3629 OFFUTT ROAD in RANDALLSTOWN, MD)
AIR MINOR (AIRS/AFS) STATE MASTER (Maryland Air Emissions Database) - AIR MINOR Conditionally Exempt Small Quantity Generators, less than 100 kg/month of hazardous waste (Resource Conservation and Recovery Act (tracking hazardous waste)) - notification Business SIC classification: DRYCLEANING PLANTS, EXCEPT RUG CLEANING Organizations: OPERNAME (CONTACT/OPERATOR)
, LEE, BENJAMIN S (CONTACT/OWNER)
Alternative names: RANDALLSTOWN ONE HOUR CLEANERS-BEN LEE
EXXON 9835 LIBERTY ROAD (9835 LIBERTY ROAD in RANDALLSTOWN, MD)
AIR MINOR (AIRS/AFS) STATE MASTER (Maryland Air Emissions Database) - AIR MINOR Conditionally Exempt Small Quantity Generators, less than 100 kg/month of hazardous waste (Resource Conservation and Recovery Act (tracking hazardous waste)) - notification Business SIC classification: GASOLINE SERVICE STATIONS Organizations: OPERNAME (CONTACT/OPERATOR)
, EXXONMOBIL CORP (CONTACT/OWNER)
Alternative names: EXXON CO USA #25582, EXXON RAS 25582
CHURCH LANE ELEMENTARY SCHOOL (3820 FERNSIDE ROAD in RANDALLSTOWN, MD)
AIR MINOR (AIRS/AFS) STATE MASTER (Maryland Air Emissions Database) - AIR MINOR Small Quantity Generators, between 100 kg and 1000 kg of hazardous waste/month (Resource Conservation and Recovery Act (tracking hazardous waste)) - notification Business SIC classification: ELEMENTARY AND SECONDARY SCHOOLS Organizations: BALTO COUNTY BOARD OF ED (CONTACT/OWNER)
Alternative names: CHURCH LANE ELEMENTARY TECHNOLOGY
PAULS BODY SHOP (3508 OFFUTT ROAD in RANDALLSTOWN, MD)
AIR MINOR (AIRS/AFS) STATE MASTER (Maryland Air Emissions Database) - AIR MINOR Conditionally Exempt Small Quantity Generators, less than 100 kg/month of hazardous waste (Resource Conservation and Recovery Act (tracking hazardous waste)) - notification Business SIC classification: TOP, BODY, AND UPHOLSTERY REPAIR SHOPS AND PAINT SHOPS Organizations: DREISCH KIMBERLY (CONTACT/OWNER)
Alternative names: AUTOMOTIVE COLLISION TECHNOLOGIES INC, PAUL S BODY SHOP
Housing units lacking complete plumbing facilities: 0.7% Housing units lacking complete kitchen facilities: 1.3%
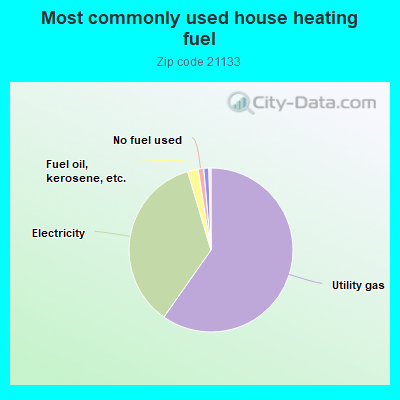
59.7%Utility gas
35.6%Electricity
2.1%Fuel oil, kerosene, etc.
1.1%No fuel used
1.0%Bottled, tank, or LP gas
Population in 1990: 23,994. Population change in the 1990s: +4,532 (+18.9%).
Place of birth for U.S.-born residents:
This state: 20,271
Northeast: 2,110
Midwest: 574
South: 3,296
West: 328
59% of the 21133 zip code residents lived in the same house 5 years ago. Out of people who lived in different houses, 42% lived in this county. Out of people who lived in different counties, 50% lived in Maryland.
93% of the 21133 zip code residents lived in the same house 1 year ago. Out of people who lived in different houses, 48% moved from this county. Out of people who lived in different houses, 41% moved from different county within same state. Out of people who lived in different houses, 8% moved from different state. Out of people who lived in different houses, 10% moved from abroad.
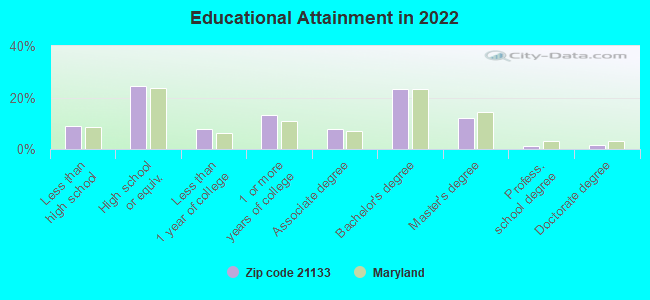
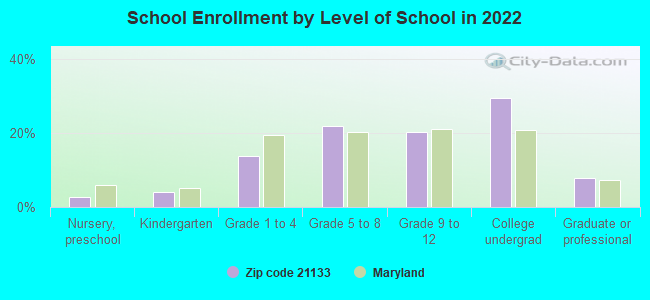
Private vs. public school enrollment:
Students in private schools in grades 1 to 8 (elementary and middle school): 287
Here:
10.4%
Maryland:
15.2%
Students in private schools in grades 9 to 12 (high school): 153
Here:
9.7%
Maryland:
14.4%
Students in private undergraduate colleges: 496
Here:
21.7%
Maryland:
20.2%
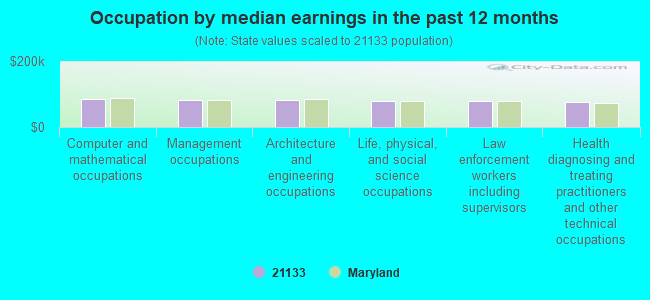
Occupation by median earnings in the past 12 months ($)
85,825Computer and mathematical occupations
83,254Management occupations
81,811Architecture and engineering occupations
80,111Life, physical, and social science occupations
78,229Law enforcement workers including supervisors
76,959Health diagnosing and treating practitioners and other technical occupations
Companies with federal contracts located in this zip code (RANDALLSTOWN, MD):
THE WHITTINGTON SERVICE GROUP (3999 WHISPERING MEADOW DR; small business) : $4,601,657 in 24 contractsfrom 1999 to 2004
Contracts for Custodial Janitorial Services by Army, Defense Logistics Agency Signed by year:2000: $1,066,198; 2001: $969,431; 2002: $1,277,824; 2003: $897,101; 2004: $154,292; 2005: $0; 2006: $0.
Biggest contracts:
$584,198 with Army for Custodial Janitorial Services. Taking place in VA. Signed on 2002-04-24. Completion date: 2002-02-28.
$531,363, same as above.Signed on 2000-03-14. Completion date: 2002-02-28.
$451,793, same as above.Signed on 2003-04-04. Completion date: 2002-02-28.
$433,320, same as above.Signed on 2001-03-09. Completion date: 2002-02-28.
DIGITEST CORPORATION (9633 LIBERTY ROAD; small business) : $657,050 in 2 contractsfrom 2002 to 2004
$656,150 with Air Force for Systems Engineering Services. Taking place in GA. Signed on 2002-08-13. Completion date: 2004-03-31.
$900 with Army for Technical Representation Services -- Automatic Data Processing Equipment (Including Firmware), Software, Supplies and Support Equipment. Signed on 2004-04-01. Completion date: 2005-04-04.
SHOATS ELECTRIC CORPORATION (10012 MARRIOTTSVILLE RD; small business) : $588,038 in 32 contractsfrom 2000 to 2005
Contracts for Maintenance, Repair or Alteration of Real Property -- Schools, Maintenance, Repair or Alteration of Real Property -- Office Buildings, Installation of Equipment -- Household and Commercial Furnishings and Appliances, Maintenance, Repair or Alteration of Real Property -- Other Administrative Facilities and Service Buildings, and moreby U.S. Army Corps of Engineers - civil program financing only, Army Signed by year:2000: $200,000; 2001: $200,000; 2002: -$25,080; 2003: $32,032; 2004: $3,600; 2005: $177,486; 2006: $0.
Biggest contracts:
$100,000 with U.S. Army Corps of Engineers - civil program financing only for Maintenance, Repair or Alteration of Real Property -- Schools. Taking place in DC. Signed on 2001-01-10. Completion date: 2001-09-30.
$100,000, same as above.Signed on 2001-09-17. Completion date: 2002-08-29.
$100,000, same as above.Signed on 2000-09-15. Completion date: 2001-02-13.
$100,000 with U.S. Army Corps of Engineers - civil program financing only for Maintenance, Repair or Alteration of Real Property -- Schools. Signed on 2000-03-07. Completion date: 2000-09-30.
SYNECTICS TRAINERS, INC (9846 BRANCHLEIGH ROAD; small business) : $445,708 in 35 contractsfrom 2001 to 2005
Contracts for Education Services, Lectures For Training, Educational Services, Training/Curriculum Development, and moreby Army Signed by year:2000: $0; 2001: $136,500; 2002: $117,977; 2003: $85,825; 2004: $160,764; 2005: -$55,358; 2006: $0.
Biggest contracts:
$843,518 with Army for Education Services. Signed on 2004-09-09. Completion date: 2005-09-30.
$103,000 with Army for Lectures For Training. Taking place in SC. Signed on 2001-11-08. Completion date: 2002-10-19.
$50,985 with Army for Education Services. Taking place in SC. Signed on 2004-10-12. Completion date: 2005-09-26.
$50,250 with Army for Education Services. Taking place in PA. Signed on 2002-10-31. Completion date: 2002-11-23.
AMNET COMPUTERS, LLC (3618 ANNE HATHAWAY DR; small business)
$66,160 with Army for ADPE System Configuration. Taking place in AZ. Signed on 2000-08-02. Completion date: 2000-09-28.
C L M SALES CO, INC (3618 BRIARSTONE RD; small business) : $33,199 in 25 contractsfrom 2003 to 2006
Contracts for Other Defense -- Applied Research and Exploratory Development (R&D), Cable, Cord, and Wire Assemblies: Communications Equipment, Miscellaneous Electrical and Electronic Components, Hand Tools, Nonedged, Nonpowered by Navy, Federal Supply Service Signed by year:2000: $0; 2001: $0; 2002: $0; 2003: $60; 2004: $725; 2005: $27,817; 2006: $4,597.
Biggest contracts:
$9,380 with Navy for Other Defense -- Applied Research and Exploratory Development (R&D). Signed on 2005-09-19. Completion date: 2005-11-30.
$4,887, same as above.Signed on 2005-05-05. Completion date: 2005-05-12.
$4,522 with Navy for Cable, Cord, and Wire Assemblies: Communications Equipment. Signed on 2006-04-11. Completion date: 2006-04-24.
$4,080 with Navy for Other Defense -- Applied Research and Exploratory Development (R&D). Signed on 2005-06-14. Completion date: 2005-06-24.
Top industries in this zip code by the number of employees in 2005:
Health Care and Social Assistance: General Medical and Surgical Hospitals (over 1000 employees: 1 establishment)
Health Care and Social Assistance: Nursing Care Facilities (100-249: 2, 50-99: 1, 5-9: 1, 1-4: 3)
Health Care and Social Assistance: Services for the Elderly and Persons with Disabilities (50-99: 2, 20-49: 1, 10-19: 1, 5-9: 2, 1-4: 1)
Health Care and Social Assistance: Offices of Physicians (except Mental Health Specialists) (50-99: 1, 20-49: 1, 10-19: 1, 5-9: 3, 1-4: 13)
2002 - 2018 National Fire Incident Reporting System (NFIRS) incidents
According to the data from the years 2002 - 2018 the average number of fire incidents per year is 75. The highest number of reported fires - 138 took place in 2005, and the least - 0 in 2003. The data has a declining trend.
When looking into fire subcategories, the most reports belonged to: Outside Fires (44.3%), and Structure Fires (29.2%).
Fire incident types reported to NFIRS in Zip Code 21133

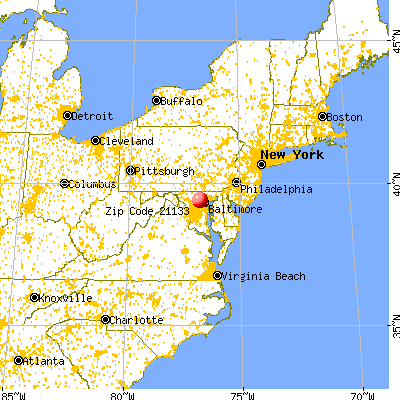


 Nearest zip codes: 21163, 21244, 21117, 21208, 21104, 21207.


 According to the data from the years 2002 - 2018 the average number of fire incidents per year is 75. The highest number of reported fires - 138 took place in 2005, and the least - 0 in 2003. The data has a declining trend.
 When looking into fire subcategories, the most reports belonged to: Outside Fires (44.3%), and Structure Fires (29.2%).