Randallstown, Maryland Submit your own pictures of this place and show them to the world
OSM Map
General Map
Google Map
MSN Map
OSM Map
General Map
Google Map
MSN Map
OSM Map
General Map
Google Map
MSN Map
OSM Map
General Map
Google Map
MSN Map
Please wait while loading the map...
Population in 2010: 32,430. Population change since 2000: +5.1%Males: 14,510 Females: 17,920
March 2022 cost of living index in Randallstown: 105.6 (more than average, U.S. average is 100) Percentage of residents living in poverty in 2022: 9.9%for White Non-Hispanic residents , 10.5% for Black residents , 29.3% for Hispanic or Latino residents , 22.6% for American Indian residents , 27.1% for other race residents , 4.9% for two or more races residents )
Profiles of local businesses
Business Search - 14 Million verified businesses
Data:
Median household income ($)
Median household income (% change since 2000)
Household income diversity
Ratio of average income to average house value (%)
Ratio of average income to average rent
Median household income ($) - White
Median household income ($) - Black or African American
Median household income ($) - Asian
Median household income ($) - Hispanic or Latino
Median household income ($) - American Indian and Alaska Native
Median household income ($) - Multirace
Median household income ($) - Other Race
Median household income for houses/condos with a mortgage ($)
Median household income for apartments without a mortgage ($)
Races - White alone (%)
Races - White alone (% change since 2000)
Races - Black alone (%)
Races - Black alone (% change since 2000)
Races - American Indian alone (%)
Races - American Indian alone (% change since 2000)
Races - Asian alone (%)
Races - Asian alone (% change since 2000)
Races - Hispanic (%)
Races - Hispanic (% change since 2000)
Races - Native Hawaiian and Other Pacific Islander alone (%)
Races - Native Hawaiian and Other Pacific Islander alone (% change since 2000)
Races - Two or more races (%)
Races - Two or more races (% change since 2000)
Races - Other race alone (%)
Races - Other race alone (% change since 2000)
Racial diversity
Unemployment (%)
Unemployment (% change since 2000)
Unemployment (%) - White
Unemployment (%) - Black or African American
Unemployment (%) - Asian
Unemployment (%) - Hispanic or Latino
Unemployment (%) - American Indian and Alaska Native
Unemployment (%) - Multirace
Unemployment (%) - Other Race
Population density (people per square mile)
Population - Males (%)
Population - Females (%)
Population - Males (%) - White
Population - Males (%) - Black or African American
Population - Males (%) - Asian
Population - Males (%) - Hispanic or Latino
Population - Males (%) - American Indian and Alaska Native
Population - Males (%) - Multirace
Population - Males (%) - Other Race
Population - Females (%) - White
Population - Females (%) - Black or African American
Population - Females (%) - Asian
Population - Females (%) - Hispanic or Latino
Population - Females (%) - American Indian and Alaska Native
Population - Females (%) - Multirace
Population - Females (%) - Other Race
Coronavirus confirmed cases (Apr 27, 2024)
Deaths caused by coronavirus (Apr 27, 2024)
Coronavirus confirmed cases (per 100k population) (Apr 27, 2024)
Deaths caused by coronavirus (per 100k population) (Apr 27, 2024)
Daily increase in number of cases (Apr 27, 2024)
Weekly increase in number of cases (Apr 27, 2024)
Cases doubled (in days) (Apr 27, 2024)
Hospitalized patients (Apr 18, 2022)
Negative test results (Apr 18, 2022)
Total test results (Apr 18, 2022)
COVID Vaccine doses distributed (per 100k population) (Sep 19, 2023)
COVID Vaccine doses administered (per 100k population) (Sep 19, 2023)
COVID Vaccine doses distributed (Sep 19, 2023)
COVID Vaccine doses administered (Sep 19, 2023)
Likely homosexual households (%)
Likely homosexual households (% change since 2000)
Likely homosexual households - Lesbian couples (%)
Likely homosexual households - Lesbian couples (% change since 2000)
Likely homosexual households - Gay men (%)
Likely homosexual households - Gay men (% change since 2000)
Cost of living index
Median gross rent ($)
Median contract rent ($)
Median monthly housing costs ($)
Median house or condo value ($)
Median house or condo value ($ change since 2000)
Mean house or condo value by units in structure - 1, detached ($)
Mean house or condo value by units in structure - 1, attached ($)
Mean house or condo value by units in structure - 2 ($)
Mean house or condo value by units in structure by units in structure - 3 or 4 ($)
Mean house or condo value by units in structure - 5 or more ($)
Mean house or condo value by units in structure - Boat, RV, van, etc. ($)
Mean house or condo value by units in structure - Mobile home ($)
Median house or condo value ($) - White
Median house or condo value ($) - Black or African American
Median house or condo value ($) - Asian
Median house or condo value ($) - Hispanic or Latino
Median house or condo value ($) - American Indian and Alaska Native
Median house or condo value ($) - Multirace
Median house or condo value ($) - Other Race
Median resident age
Resident age diversity
Median resident age - Males
Median resident age - Females
Median resident age - White
Median resident age - Black or African American
Median resident age - Asian
Median resident age - Hispanic or Latino
Median resident age - American Indian and Alaska Native
Median resident age - Multirace
Median resident age - Other Race
Median resident age - Males - White
Median resident age - Males - Black or African American
Median resident age - Males - Asian
Median resident age - Males - Hispanic or Latino
Median resident age - Males - American Indian and Alaska Native
Median resident age - Males - Multirace
Median resident age - Males - Other Race
Median resident age - Females - White
Median resident age - Females - Black or African American
Median resident age - Females - Asian
Median resident age - Females - Hispanic or Latino
Median resident age - Females - American Indian and Alaska Native
Median resident age - Females - Multirace
Median resident age - Females - Other Race
Commute - mean travel time to work (minutes)
Travel time to work - Less than 5 minutes (%)
Travel time to work - Less than 5 minutes (% change since 2000)
Travel time to work - 5 to 9 minutes (%)
Travel time to work - 5 to 9 minutes (% change since 2000)
Travel time to work - 10 to 19 minutes (%)
Travel time to work - 10 to 19 minutes (% change since 2000)
Travel time to work - 20 to 29 minutes (%)
Travel time to work - 20 to 29 minutes (% change since 2000)
Travel time to work - 30 to 39 minutes (%)
Travel time to work - 30 to 39 minutes (% change since 2000)
Travel time to work - 40 to 59 minutes (%)
Travel time to work - 40 to 59 minutes (% change since 2000)
Travel time to work - 60 to 89 minutes (%)
Travel time to work - 60 to 89 minutes (% change since 2000)
Travel time to work - 90 or more minutes (%)
Travel time to work - 90 or more minutes (% change since 2000)
Marital status - Never married (%)
Marital status - Now married (%)
Marital status - Separated (%)
Marital status - Widowed (%)
Marital status - Divorced (%)
Median family income ($)
Median family income (% change since 2000)
Median non-family income ($)
Median non-family income (% change since 2000)
Median per capita income ($)
Median per capita income (% change since 2000)
Median family income ($) - White
Median family income ($) - Black or African American
Median family income ($) - Asian
Median family income ($) - Hispanic or Latino
Median family income ($) - American Indian and Alaska Native
Median family income ($) - Multirace
Median family income ($) - Other Race
Median year house/condo built
Median year apartment built
Year house built - Built 2005 or later (%)
Year house built - Built 2000 to 2004 (%)
Year house built - Built 1990 to 1999 (%)
Year house built - Built 1980 to 1989 (%)
Year house built - Built 1970 to 1979 (%)
Year house built - Built 1960 to 1969 (%)
Year house built - Built 1950 to 1959 (%)
Year house built - Built 1940 to 1949 (%)
Year house built - Built 1939 or earlier (%)
Average household size
Household density (households per square mile)
Average household size - White
Average household size - Black or African American
Average household size - Asian
Average household size - Hispanic or Latino
Average household size - American Indian and Alaska Native
Average household size - Multirace
Average household size - Other Race
Occupied housing units (%)
Vacant housing units (%)
Owner occupied housing units (%)
Renter occupied housing units (%)
Vacancy status - For rent (%)
Vacancy status - For sale only (%)
Vacancy status - Rented or sold, not occupied (%)
Vacancy status - For seasonal, recreational, or occasional use (%)
Vacancy status - For migrant workers (%)
Vacancy status - Other vacant (%)
Residents with income below the poverty level (%)
Residents with income below 50% of the poverty level (%)
Children below poverty level (%)
Poor families by family type - Married-couple family (%)
Poor families by family type - Male, no wife present (%)
Poor families by family type - Female, no husband present (%)
Poverty status for native-born residents (%)
Poverty status for foreign-born residents (%)
Poverty among high school graduates not in families (%)
Poverty among people who did not graduate high school not in families (%)
Residents with income below the poverty level (%) - White
Residents with income below the poverty level (%) - Black or African American
Residents with income below the poverty level (%) - Asian
Residents with income below the poverty level (%) - Hispanic or Latino
Residents with income below the poverty level (%) - American Indian and Alaska Native
Residents with income below the poverty level (%) - Multirace
Residents with income below the poverty level (%) - Other Race
Air pollution - Air Quality Index (AQI)
Air pollution - CO
Air pollution - NO2
Air pollution - SO2
Air pollution - Ozone
Air pollution - PM10
Air pollution - PM25
Air pollution - Pb
Crime - Murders per 100,000 population
Crime - Rapes per 100,000 population
Crime - Robberies per 100,000 population
Crime - Assaults per 100,000 population
Crime - Burglaries per 100,000 population
Crime - Thefts per 100,000 population
Crime - Auto thefts per 100,000 population
Crime - Arson per 100,000 population
Crime - City-data.com crime index
Crime - Violent crime index
Crime - Property crime index
Crime - Murders per 100,000 population (5 year average)
Crime - Rapes per 100,000 population (5 year average)
Crime - Robberies per 100,000 population (5 year average)
Crime - Assaults per 100,000 population (5 year average)
Crime - Burglaries per 100,000 population (5 year average)
Crime - Thefts per 100,000 population (5 year average)
Crime - Auto thefts per 100,000 population (5 year average)
Crime - Arson per 100,000 population (5 year average)
Crime - City-data.com crime index (5 year average)
Crime - Violent crime index (5 year average)
Crime - Property crime index (5 year average)
1996 Presidential Elections Results (%) - Democratic Party (Clinton)
1996 Presidential Elections Results (%) - Republican Party (Dole)
1996 Presidential Elections Results (%) - Other
2000 Presidential Elections Results (%) - Democratic Party (Gore)
2000 Presidential Elections Results (%) - Republican Party (Bush)
2000 Presidential Elections Results (%) - Other
2004 Presidential Elections Results (%) - Democratic Party (Kerry)
2004 Presidential Elections Results (%) - Republican Party (Bush)
2004 Presidential Elections Results (%) - Other
2008 Presidential Elections Results (%) - Democratic Party (Obama)
2008 Presidential Elections Results (%) - Republican Party (McCain)
2008 Presidential Elections Results (%) - Other
2012 Presidential Elections Results (%) - Democratic Party (Obama)
2012 Presidential Elections Results (%) - Republican Party (Romney)
2012 Presidential Elections Results (%) - Other
2016 Presidential Elections Results (%) - Democratic Party (Clinton)
2016 Presidential Elections Results (%) - Republican Party (Trump)
2016 Presidential Elections Results (%) - Other
2020 Presidential Elections Results (%) - Democratic Party (Biden)
2020 Presidential Elections Results (%) - Republican Party (Trump)
2020 Presidential Elections Results (%) - Other
Ancestries Reported - Arab (%)
Ancestries Reported - Czech (%)
Ancestries Reported - Danish (%)
Ancestries Reported - Dutch (%)
Ancestries Reported - English (%)
Ancestries Reported - French (%)
Ancestries Reported - French Canadian (%)
Ancestries Reported - German (%)
Ancestries Reported - Greek (%)
Ancestries Reported - Hungarian (%)
Ancestries Reported - Irish (%)
Ancestries Reported - Italian (%)
Ancestries Reported - Lithuanian (%)
Ancestries Reported - Norwegian (%)
Ancestries Reported - Polish (%)
Ancestries Reported - Portuguese (%)
Ancestries Reported - Russian (%)
Ancestries Reported - Scotch-Irish (%)
Ancestries Reported - Scottish (%)
Ancestries Reported - Slovak (%)
Ancestries Reported - Subsaharan African (%)
Ancestries Reported - Swedish (%)
Ancestries Reported - Swiss (%)
Ancestries Reported - Ukrainian (%)
Ancestries Reported - United States (%)
Ancestries Reported - Welsh (%)
Ancestries Reported - West Indian (%)
Ancestries Reported - Other (%)
Educational Attainment - No schooling completed (%)
Educational Attainment - Less than high school (%)
Educational Attainment - High school or equivalent (%)
Educational Attainment - Less than 1 year of college (%)
Educational Attainment - 1 or more years of college (%)
Educational Attainment - Associate degree (%)
Educational Attainment - Bachelor's degree (%)
Educational Attainment - Master's degree (%)
Educational Attainment - Professional school degree (%)
Educational Attainment - Doctorate degree (%)
School Enrollment - Nursery, preschool (%)
School Enrollment - Kindergarten (%)
School Enrollment - Grade 1 to 4 (%)
School Enrollment - Grade 5 to 8 (%)
School Enrollment - Grade 9 to 12 (%)
School Enrollment - College undergrad (%)
School Enrollment - Graduate or professional (%)
School Enrollment - Not enrolled in school (%)
School enrollment - Public schools (%)
School enrollment - Private schools (%)
School enrollment - Not enrolled (%)
Median number of rooms in houses and condos
Median number of rooms in apartments
Housing units lacking complete plumbing facilities (%)
Housing units lacking complete kitchen facilities (%)
Density of houses
Urban houses (%)
Rural houses (%)
Households with people 60 years and over (%)
Households with people 65 years and over (%)
Households with people 75 years and over (%)
Households with one or more nonrelatives (%)
Households with no nonrelatives (%)
Population in households (%)
Family households (%)
Nonfamily households (%)
Population in families (%)
Family households with own children (%)
Median number of bedrooms in owner occupied houses
Mean number of bedrooms in owner occupied houses
Median number of bedrooms in renter occupied houses
Mean number of bedrooms in renter occupied houses
Median number of vehichles in owner occupied houses
Mean number of vehichles in owner occupied houses
Median number of vehichles in renter occupied houses
Mean number of vehichles in renter occupied houses
Mortgage status - with mortgage (%)
Mortgage status - with second mortgage (%)
Mortgage status - with home equity loan (%)
Mortgage status - with both second mortgage and home equity loan (%)
Mortgage status - without a mortgage (%)
Average family size
Average family size - White
Average family size - Black or African American
Average family size - Asian
Average family size - Hispanic or Latino
Average family size - American Indian and Alaska Native
Average family size - Multirace
Average family size - Other Race
Geographical mobility - Same house 1 year ago (%)
Geographical mobility - Moved within same county (%)
Geographical mobility - Moved from different county within same state (%)
Geographical mobility - Moved from different state (%)
Geographical mobility - Moved from abroad (%)
Place of birth - Born in state of residence (%)
Place of birth - Born in other state (%)
Place of birth - Native, outside of US (%)
Place of birth - Foreign born (%)
Housing units in structures - 1, detached (%)
Housing units in structures - 1, attached (%)
Housing units in structures - 2 (%)
Housing units in structures - 3 or 4 (%)
Housing units in structures - 5 to 9 (%)
Housing units in structures - 10 to 19 (%)
Housing units in structures - 20 to 49 (%)
Housing units in structures - 50 or more (%)
Housing units in structures - Mobile home (%)
Housing units in structures - Boat, RV, van, etc. (%)
House/condo owner moved in on average (years ago)
Renter moved in on average (years ago)
Year householder moved into unit - Moved in 1999 to March 2000 (%)
Year householder moved into unit - Moved in 1995 to 1998 (%)
Year householder moved into unit - Moved in 1990 to 1994 (%)
Year householder moved into unit - Moved in 1980 to 1989 (%)
Year householder moved into unit - Moved in 1970 to 1979 (%)
Year householder moved into unit - Moved in 1969 or earlier (%)
Means of transportation to work - Drove car alone (%)
Means of transportation to work - Carpooled (%)
Means of transportation to work - Public transportation (%)
Means of transportation to work - Bus or trolley bus (%)
Means of transportation to work - Streetcar or trolley car (%)
Means of transportation to work - Subway or elevated (%)
Means of transportation to work - Railroad (%)
Means of transportation to work - Ferryboat (%)
Means of transportation to work - Taxicab (%)
Means of transportation to work - Motorcycle (%)
Means of transportation to work - Bicycle (%)
Means of transportation to work - Walked (%)
Means of transportation to work - Other means (%)
Working at home (%)
Industry diversity
Most Common Industries - Agriculture, forestry, fishing and hunting, and mining (%)
Most Common Industries - Agriculture, forestry, fishing and hunting (%)
Most Common Industries - Mining, quarrying, and oil and gas extraction (%)
Most Common Industries - Construction (%)
Most Common Industries - Manufacturing (%)
Most Common Industries - Wholesale trade (%)
Most Common Industries - Retail trade (%)
Most Common Industries - Transportation and warehousing, and utilities (%)
Most Common Industries - Transportation and warehousing (%)
Most Common Industries - Utilities (%)
Most Common Industries - Information (%)
Most Common Industries - Finance and insurance, and real estate and rental and leasing (%)
Most Common Industries - Finance and insurance (%)
Most Common Industries - Real estate and rental and leasing (%)
Most Common Industries - Professional, scientific, and management, and administrative and waste management services (%)
Most Common Industries - Professional, scientific, and technical services (%)
Most Common Industries - Management of companies and enterprises (%)
Most Common Industries - Administrative and support and waste management services (%)
Most Common Industries - Educational services, and health care and social assistance (%)
Most Common Industries - Educational services (%)
Most Common Industries - Health care and social assistance (%)
Most Common Industries - Arts, entertainment, and recreation, and accommodation and food services (%)
Most Common Industries - Arts, entertainment, and recreation (%)
Most Common Industries - Accommodation and food services (%)
Most Common Industries - Other services, except public administration (%)
Most Common Industries - Public administration (%)
Occupation diversity
Most Common Occupations - Management, business, science, and arts occupations (%)
Most Common Occupations - Management, business, and financial occupations (%)
Most Common Occupations - Management occupations (%)
Most Common Occupations - Business and financial operations occupations (%)
Most Common Occupations - Computer, engineering, and science occupations (%)
Most Common Occupations - Computer and mathematical occupations (%)
Most Common Occupations - Architecture and engineering occupations (%)
Most Common Occupations - Life, physical, and social science occupations (%)
Most Common Occupations - Education, legal, community service, arts, and media occupations (%)
Most Common Occupations - Community and social service occupations (%)
Most Common Occupations - Legal occupations (%)
Most Common Occupations - Education, training, and library occupations (%)
Most Common Occupations - Arts, design, entertainment, sports, and media occupations (%)
Most Common Occupations - Healthcare practitioners and technical occupations (%)
Most Common Occupations - Health diagnosing and treating practitioners and other technical occupations (%)
Most Common Occupations - Health technologists and technicians (%)
Most Common Occupations - Service occupations (%)
Most Common Occupations - Healthcare support occupations (%)
Most Common Occupations - Protective service occupations (%)
Most Common Occupations - Fire fighting and prevention, and other protective service workers including supervisors (%)
Most Common Occupations - Law enforcement workers including supervisors (%)
Most Common Occupations - Food preparation and serving related occupations (%)
Most Common Occupations - Building and grounds cleaning and maintenance occupations (%)
Most Common Occupations - Personal care and service occupations (%)
Most Common Occupations - Sales and office occupations (%)
Most Common Occupations - Sales and related occupations (%)
Most Common Occupations - Office and administrative support occupations (%)
Most Common Occupations - Natural resources, construction, and maintenance occupations (%)
Most Common Occupations - Farming, fishing, and forestry occupations (%)
Most Common Occupations - Construction and extraction occupations (%)
Most Common Occupations - Installation, maintenance, and repair occupations (%)
Most Common Occupations - Production, transportation, and material moving occupations (%)
Most Common Occupations - Production occupations (%)
Most Common Occupations - Transportation occupations (%)
Most Common Occupations - Material moving occupations (%)
People in Group quarters - Institutionalized population (%)
People in Group quarters - Correctional institutions (%)
People in Group quarters - Federal prisons and detention centers (%)
People in Group quarters - Halfway houses (%)
People in Group quarters - Local jails and other confinement facilities (including police lockups) (%)
People in Group quarters - Military disciplinary barracks (%)
People in Group quarters - State prisons (%)
People in Group quarters - Other types of correctional institutions (%)
People in Group quarters - Nursing homes (%)
People in Group quarters - Hospitals/wards, hospices, and schools for the handicapped (%)
People in Group quarters - Hospitals/wards and hospices for chronically ill (%)
People in Group quarters - Hospices or homes for chronically ill (%)
People in Group quarters - Military hospitals or wards for chronically ill (%)
People in Group quarters - Other hospitals or wards for chronically ill (%)
People in Group quarters - Hospitals or wards for drug/alcohol abuse (%)
People in Group quarters - Mental (Psychiatric) hospitals or wards (%)
People in Group quarters - Schools, hospitals, or wards for the mentally retarded (%)
People in Group quarters - Schools, hospitals, or wards for the physically handicapped (%)
People in Group quarters - Institutions for the deaf (%)
People in Group quarters - Institutions for the blind (%)
People in Group quarters - Orthopedic wards and institutions for the physically handicapped (%)
People in Group quarters - Wards in general hospitals for patients who have no usual home elsewhere (%)
People in Group quarters - Wards in military hospitals for patients who have no usual home elsewhere (%)
People in Group quarters - Juvenile institutions (%)
People in Group quarters - Long-term care (%)
People in Group quarters - Homes for abused, dependent, and neglected children (%)
People in Group quarters - Residential treatment centers for emotionally disturbed children (%)
People in Group quarters - Training schools for juvenile delinquents (%)
People in Group quarters - Short-term care, detention or diagnostic centers for delinquent children (%)
People in Group quarters - Type of juvenile institution unknown (%)
People in Group quarters - Noninstitutionalized population (%)
People in Group quarters - College dormitories (includes college quarters off campus) (%)
People in Group quarters - Military quarters (%)
People in Group quarters - On base (%)
People in Group quarters - Barracks, unaccompanied personnel housing (UPH), (Enlisted/Officer), ;and similar group living quarters for military personnel (%)
People in Group quarters - Transient quarters for temporary residents (%)
People in Group quarters - Military ships (%)
People in Group quarters - Group homes (%)
People in Group quarters - Homes or halfway houses for drug/alcohol abuse (%)
People in Group quarters - Homes for the mentally ill (%)
People in Group quarters - Homes for the mentally retarded (%)
People in Group quarters - Homes for the physically handicapped (%)
People in Group quarters - Other group homes (%)
People in Group quarters - Religious group quarters (%)
People in Group quarters - Dormitories (%)
People in Group quarters - Agriculture workers' dormitories on farms (%)
People in Group quarters - Job Corps and vocational training facilities (%)
People in Group quarters - Other workers' dormitories (%)
People in Group quarters - Crews of maritime vessels (%)
People in Group quarters - Other nonhousehold living situations (%)
People in Group quarters - Other noninstitutional group quarters (%)
Residents speaking English at home (%)
Residents speaking English at home - Born in the United States (%)
Residents speaking English at home - Native, born elsewhere (%)
Residents speaking English at home - Foreign born (%)
Residents speaking Spanish at home (%)
Residents speaking Spanish at home - Born in the United States (%)
Residents speaking Spanish at home - Native, born elsewhere (%)
Residents speaking Spanish at home - Foreign born (%)
Residents speaking other language at home (%)
Residents speaking other language at home - Born in the United States (%)
Residents speaking other language at home - Native, born elsewhere (%)
Residents speaking other language at home - Foreign born (%)
Class of Workers - Employee of private company (%)
Class of Workers - Self-employed in own incorporated business (%)
Class of Workers - Private not-for-profit wage and salary workers (%)
Class of Workers - Local government workers (%)
Class of Workers - State government workers (%)
Class of Workers - Federal government workers (%)
Class of Workers - Self-employed workers in own not incorporated business and Unpaid family workers (%)
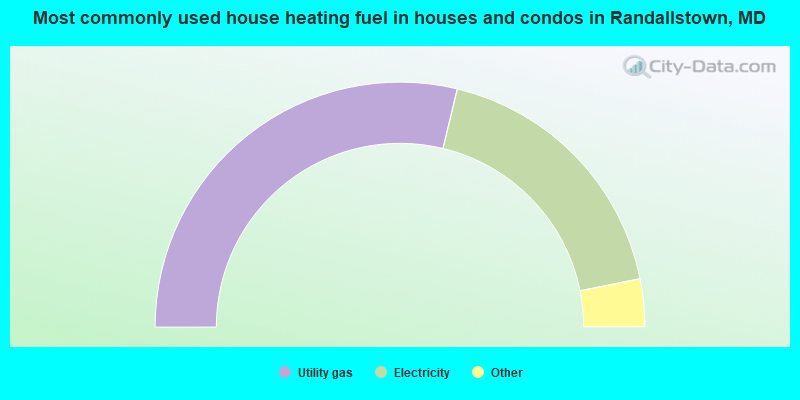
House heating fuel used in houses and condos - Utility gas (%)
House heating fuel used in houses and condos - Bottled, tank, or LP gas (%)
House heating fuel used in houses and condos - Electricity (%)
House heating fuel used in houses and condos - Fuel oil, kerosene, etc. (%)
House heating fuel used in houses and condos - Coal or coke (%)
House heating fuel used in houses and condos - Wood (%)
House heating fuel used in houses and condos - Solar energy (%)
House heating fuel used in houses and condos - Other fuel (%)
House heating fuel used in houses and condos - No fuel used (%)
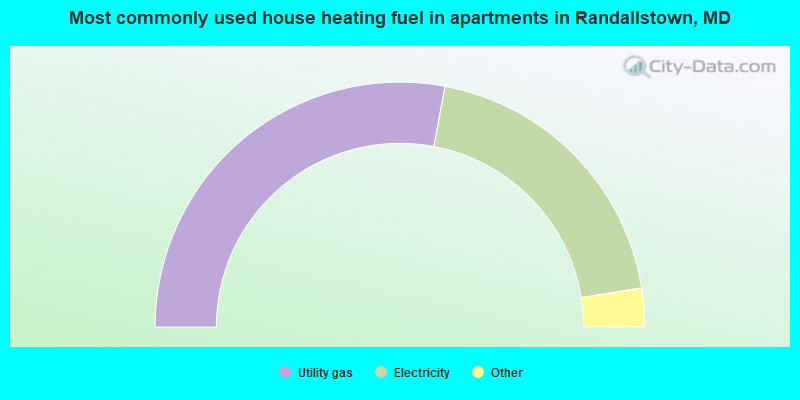
House heating fuel used in apartments - Utility gas (%)
House heating fuel used in apartments - Bottled, tank, or LP gas (%)
House heating fuel used in apartments - Electricity (%)
House heating fuel used in apartments - Fuel oil, kerosene, etc. (%)
House heating fuel used in apartments - Coal or coke (%)
House heating fuel used in apartments - Wood (%)
House heating fuel used in apartments - Solar energy (%)
House heating fuel used in apartments - Other fuel (%)
House heating fuel used in apartments - No fuel used (%)
Armed forces status - In Armed Forces (%)
Armed forces status - Civilian (%)
Armed forces status - Civilian - Veteran (%)
Armed forces status - Civilian - Nonveteran (%)
Fatal accidents locations in years 2005-2021
Fatal accidents locations in 2005
Fatal accidents locations in 2006
Fatal accidents locations in 2007
Fatal accidents locations in 2008
Fatal accidents locations in 2009
Fatal accidents locations in 2010
Fatal accidents locations in 2011
Fatal accidents locations in 2012
Fatal accidents locations in 2013
Fatal accidents locations in 2014
Fatal accidents locations in 2015
Fatal accidents locations in 2016
Fatal accidents locations in 2017
Fatal accidents locations in 2018
Fatal accidents locations in 2019
Fatal accidents locations in 2020
Fatal accidents locations in 2021
Alcohol use - People drinking some alcohol every month (%)
Alcohol use - People not drinking at all (%)
Alcohol use - Average days/month drinking alcohol
Alcohol use - Average drinks/week
Alcohol use - Average days/year people drink much
Audiometry - Average condition of hearing (%)
Audiometry - People that can hear a whisper from across a quiet room (%)
Audiometry - People that can hear normal voice from across a quiet room (%)
Audiometry - Ears ringing, roaring, buzzing (%)
Audiometry - Had a job exposure to loud noise (%)
Audiometry - Had off-work exposure to loud noise (%)
Blood Pressure & Cholesterol - Has high blood pressure (%)
Blood Pressure & Cholesterol - Checking blood pressure at home (%)
Blood Pressure & Cholesterol - Frequently checking blood cholesterol (%)
Blood Pressure & Cholesterol - Has high cholesterol level (%)
Consumer Behavior - Money monthly spent on food at supermarket/grocery store
Consumer Behavior - Money monthly spent on food at other stores
Consumer Behavior - Money monthly spent on eating out
Consumer Behavior - Money monthly spent on carryout/delivered foods
Consumer Behavior - Income spent on food at supermarket/grocery store (%)
Consumer Behavior - Income spent on food at other stores (%)
Consumer Behavior - Income spent on eating out (%)
Consumer Behavior - Income spent on carryout/delivered foods (%)
Current Health Status - General health condition (%)
Current Health Status - Blood donors (%)
Current Health Status - Has blood ever tested for HIV virus (%)
Current Health Status - Left-handed people (%)
Dermatology - People using sunscreen (%)
Diabetes - Diabetics (%)
Diabetes - Had a blood test for high blood sugar (%)
Diabetes - People taking insulin (%)
Diet Behavior & Nutrition - Diet health (%)
Diet Behavior & Nutrition - Milk product consumption (# of products/month)
Diet Behavior & Nutrition - Meals not home prepared (#/week)
Diet Behavior & Nutrition - Meals from fast food or pizza place (#/week)
Diet Behavior & Nutrition - Ready-to-eat foods (#/month)
Diet Behavior & Nutrition - Frozen meals/pizza (#/month)
Drug Use - People that ever used marijuana or hashish (%)
Drug Use - Ever used hard drugs (%)
Drug Use - Ever used any form of cocaine (%)
Drug Use - Ever used heroin (%)
Drug Use - Ever used methamphetamine (%)
Health Insurance - People covered by health insurance (%)
Kidney Conditions-Urology - Avg. # of times urinating at night
Medical Conditions - People with asthma (%)
Medical Conditions - People with anemia (%)
Medical Conditions - People with psoriasis (%)
Medical Conditions - People with overweight (%)
Medical Conditions - Elderly people having difficulties in thinking or remembering (%)
Medical Conditions - People who ever received blood transfusion (%)
Medical Conditions - People having trouble seeing even with glass/contacts (%)
Medical Conditions - People with arthritis (%)
Medical Conditions - People with gout (%)
Medical Conditions - People with congestive heart failure (%)
Medical Conditions - People with coronary heart disease (%)
Medical Conditions - People with angina pectoris (%)
Medical Conditions - People who ever had heart attack (%)
Medical Conditions - People who ever had stroke (%)
Medical Conditions - People with emphysema (%)
Medical Conditions - People with thyroid problem (%)
Medical Conditions - People with chronic bronchitis (%)
Medical Conditions - People with any liver condition (%)
Medical Conditions - People who ever had cancer or malignancy (%)
Mental Health - People who have little interest in doing things (%)
Mental Health - People feeling down, depressed, or hopeless (%)
Mental Health - People who have trouble sleeping or sleeping too much (%)
Mental Health - People feeling tired or having little energy (%)
Mental Health - People with poor appetite or overeating (%)
Mental Health - People feeling bad about themself (%)
Mental Health - People who have trouble concentrating on things (%)
Mental Health - People moving or speaking slowly or too fast (%)
Mental Health - People having thoughts they would be better off dead (%)
Oral Health - Average years since last visit a dentist
Oral Health - People embarrassed because of mouth (%)
Oral Health - People with gum disease (%)
Oral Health - General health of teeth and gums (%)
Oral Health - Average days a week using dental floss/device
Oral Health - Average days a week using mouthwash for dental problem
Oral Health - Average number of teeth
Pesticide Use - Households using pesticides to control insects (%)
Pesticide Use - Households using pesticides to kill weeds (%)
Physical Activity - People doing vigorous-intensity work activities (%)
Physical Activity - People doing moderate-intensity work activities (%)
Physical Activity - People walking or bicycling (%)
Physical Activity - People doing vigorous-intensity recreational activities (%)
Physical Activity - People doing moderate-intensity recreational activities (%)
Physical Activity - Average hours a day doing sedentary activities
Physical Activity - Average hours a day watching TV or videos
Physical Activity - Average hours a day using computer
Physical Functioning - People having limitations keeping them from working (%)
Physical Functioning - People limited in amount of work they can do (%)
Physical Functioning - People that need special equipment to walk (%)
Physical Functioning - People experiencing confusion/memory problems (%)
Physical Functioning - People requiring special healthcare equipment (%)
Prescription Medications - Average number of prescription medicines taking
Preventive Aspirin Use - Adults 40+ taking low-dose aspirin (%)
Reproductive Health - Vaginal deliveries (%)
Reproductive Health - Cesarean deliveries (%)
Reproductive Health - Deliveries resulted in a live birth (%)
Reproductive Health - Pregnancies resulted in a delivery (%)
Reproductive Health - Women breastfeeding newborns (%)
Reproductive Health - Women that had a hysterectomy (%)
Reproductive Health - Women that had both ovaries removed (%)
Reproductive Health - Women that have ever taken birth control pills (%)
Reproductive Health - Women taking birth control pills (%)
Reproductive Health - Women that have ever used Depo-Provera or injectables (%)
Reproductive Health - Women that have ever used female hormones (%)
Sexual Behavior - People 18+ that ever had sex (vaginal, anal, or oral) (%)
Sexual Behavior - Males 18+ that ever had vaginal sex with a woman (%)
Sexual Behavior - Males 18+ that ever performed oral sex on a woman (%)
Sexual Behavior - Males 18+ that ever had anal sex with a woman (%)
Sexual Behavior - Males 18+ that ever had any sex with a man (%)
Sexual Behavior - Females 18+ that ever had vaginal sex with a man (%)
Sexual Behavior - Females 18+ that ever performed oral sex on a man (%)
Sexual Behavior - Females 18+ that ever had anal sex with a man (%)
Sexual Behavior - Females 18+ that ever had any kind of sex with a woman (%)
Sexual Behavior - Average age people first had sex
Sexual Behavior - Average number of female sex partners in lifetime (males 18+)
Sexual Behavior - Average number of female vaginal sex partners in lifetime (males 18+)
Sexual Behavior - Average age people first performed oral sex on a woman (18+)
Sexual Behavior - Average number of woman performed oral sex on in lifetime (18+)
Sexual Behavior - Average number of male sex partners in lifetime (males 18+)
Sexual Behavior - Average number of male anal sex partners in lifetime (males 18+)
Sexual Behavior - Average age people first performed oral sex on a man (18+)
Sexual Behavior - Average number of male oral sex partners in lifetime (18+)
Sexual Behavior - People using protection when performing oral sex (%)
Sexual Behavior - Average number of times people have vaginal or anal sex a year
Sexual Behavior - People having sex without condom (%)
Sexual Behavior - Average number of male sex partners in lifetime (females 18+)
Sexual Behavior - Average number of male vaginal sex partners in lifetime (females 18+)
Sexual Behavior - Average number of female sex partners in lifetime (females 18+)
Sexual Behavior - Circumcised males 18+ (%)
Sleep Disorders - Average hours sleeping at night
Sleep Disorders - People that has trouble sleeping (%)
Smoking-Cigarette Use - People smoking cigarettes (%)
Taste & Smell - People 40+ having problems with smell (%)
Taste & Smell - People 40+ having problems with taste (%)
Taste & Smell - People 40+ that ever had wisdom teeth removed (%)
Taste & Smell - People 40+ that ever had tonsils teeth removed (%)
Taste & Smell - People 40+ that ever had a loss of consciousness because of a head injury (%)
Taste & Smell - People 40+ that ever had a broken nose or other serious injury to face or skull (%)
Taste & Smell - People 40+ that ever had two or more sinus infections (%)
Weight - Average height (inches)
Weight - Average weight (pounds)
Weight - Average BMI
Weight - People that are obese (%)
Weight - People that ever were obese (%)
Weight - People trying to lose weight (%)
According to our research of Maryland and other state lists, there were 35 registered sex offenders living in Randallstown, Maryland as of April 27, 2024 . The ratio of all residents to sex offenders in Randallstown is 1,027 to 1.The ratio of registered sex offenders to all residents in this city is lower than the state average.
Latest news from Randallstown, MD collected exclusively by city-data.com from local newspapers, TV, and radio stations
Randallstown, MD City Guides: Ancestries: Nigerian (5.9%), African (4.7%), American (2.9%), Jamaican (2.4%), English (2.0%), German (1.0%).
Current Local Time:
Land area: 10.3 square miles.
Population density: 3,148 people per square mile (average).
5,588 residents are foreign born (8.2% Africa , 3.6% Latin America , 2.3% Asia ).
This place:
15.5%Maryland:
15.7%
Median real estate property taxes paid for housing units with mortgages in 2022: $3,286 (1.1%)Median real estate property taxes paid for housing units with no mortgage in 2022: $3,193 (1.1%)
Nearest city with pop. 50,000+: Ellicott City, MD
Nearest city with pop. 200,000+: Baltimore, MD
Nearest city with pop. 1,000,000+: Philadelphia, PA
Nearest cities:
Latitude: 39.38 N, Longitude: 76.80 W
Daytime population change due to commuting: -11,921 (-33.1%)Workers who live and work in this place: 3,306 (17.9%)
Property values in Randallstown, MD
Unemployment in December 2023:
Most common occupations in Randallstown, MD (%)
Both Males Females
Other office and administrative support workers, including supervisors (5.6%)
Other management occupations, except farmers and farm managers (5.3%)
Secretaries and administrative assistants (3.6%)
Registered nurses (3.6%)
Retail sales workers, except cashiers (3.5%)
Computer specialists (3.4%)
Other sales and related occupations, including supervisors (3.3%)
Other management occupations, except farmers and farm managers (5.2%)
Other sales and related occupations, including supervisors (5.0%)
Law enforcement workers, including supervisors (4.9%)
Driver/sales workers and truck drivers (4.5%)
Retail sales workers, except cashiers (4.1%)
Electrical equipment mechanics and other installation, maintenance, and repair workers, including supervisors (3.8%)
Material recording, scheduling, dispatching, and distributing workers (3.5%)
Other office and administrative support workers, including supervisors (7.5%)
Secretaries and administrative assistants (6.6%)
Registered nurses (6.1%)
Other management occupations, except farmers and farm managers (5.4%)
Preschool, kindergarten, elementary, and middle school teachers (5.4%)
Computer specialists (3.5%)
Customer service representatives (3.1%)
Tornado activity:
Randallstown-area historical tornado activity is slightly above Maryland state average. It is 19% greater than the overall U.S. average.
On 9/24/2001, a category F3 (max. wind speeds 158-206 mph) tornado 10.2 miles away from the Randallstown place center killed 2 people and injured 55 people and caused $101 million in damages.
On 7/19/1996, a category F3 tornado 10.9 miles away from the place center injured 3 people and caused $5 million in damages.
Earthquake activity:
Randallstown-area historical earthquake activity is significantly above Maryland state average. It is 59% smaller than the overall U.S. average. On 8/23/2011 at 17:51:04, a magnitude 5.8 (5.8 MW, Depth: 3.7 mi, Class: Moderate, Intensity: VI - VII) earthquake occurred 118.6 miles away from the city center On 1/16/1994 at 01:49:16, a magnitude 4.6 (4.6 MB, 4.6 LG, Depth: 3.1 mi, Class: Light, Intensity: IV - V) earthquake occurred 77.4 miles away from the city center On 9/25/1998 at 19:52:52, a magnitude 5.2 (4.8 MB, 4.3 MS, 5.2 LG, 4.5 MW, Depth: 3.1 mi) earthquake occurred 239.4 miles away from the city center On 8/25/2011 at 05:07:52, a magnitude 4.5 (4.5 ML, Depth: 4.2 mi) earthquake occurred 117.3 miles away from the city center On 12/9/2003 at 20:59:18, a magnitude 4.5 (4.5 ML, Depth: 6.2 mi) earthquake occurred 131.3 miles away from Randallstown center On 12/9/2003 at 20:59:14, a magnitude 4.5 (4.5 MB, 4.5 LG) earthquake occurred 137.4 miles away from Randallstown center Magnitude types: regional Lg-wave magnitude (LG), body-wave magnitude (MB), local magnitude (ML), surface-wave magnitude (MS), moment magnitude (MW) Natural disasters: The number of natural disasters in Baltimore County (21) is greater than the US average (15).Major Disasters (Presidential) Declared: 15Emergencies Declared: 5Hurricanes: 6, Winter Storms: 5, Floods: 4, Snowstorms: 4, Storms: 4, Tropical Storms: 2, Blizzard: 1, Heavy Rain: 1, Snow: 1, Snowfall: 1, Tornado: 1, Other: 1 (Note: some incidents may be assigned to more than one category). Hospitals and medical centers in Randallstown: NORTHWEST HOSPITAL CENTER (Voluntary non-profit - Private, 5401 OLD COURT RD) CHAPEL HILL CONV HOME (4511 ROBOSSON RD)
FUTURE CARE OLD COURT (5412 OLD COURT ROAD)
MID-ATLANTIC OF CHAPEL HILL, LLC (4511 ROBOSSON ROAD)
NORTHWEST HOSP. CTR. SUB. UNIT (5401 OLD COURT ROAD)
RANDALLSTOWN CENTER (9109 LIBERTY ROAD)
ADVANCED DIALYSIS CENTER - RANDALLSTOWN (9109 LIBERTY RD)
BALTIMORE COUNTY DIALYSIS FACILITY (9635 LIBERTY RD STE A)
Amtrak stations near Randallstown: 11 miles: BALTIMORE (1500 N. CHARLES ST.) Services: ticket office, fully wheelchair accessible, enclosed waiting area, public restrooms, public payphones, full-service food facilities, snack bar, vending machines, ATM, paid short-term parking, paid long-term parking, call for car rental service, taxi stand, public transit connection.
14 miles: BWI AIRPORT RAIL STATION (BALTIMORE, AMTRAK WAY) Services: ticket office, fully wheelchair accessible, enclosed waiting area, public restrooms, public payphones, snack bar, ATM, paid short-term parking, paid long-term parking, call for car rental service, call for taxi service, public transit connection.
Colleges/universities with over 2000 students nearest to Randallstown:
Stevenson University (about 7 miles; Stevenson, MD ; Full-time enrollment: 3,862)
Baltimore City Community College (about 9 miles; Baltimore, MD ; FT enrollment: 3,560)
Coppin State University (about 9 miles; Baltimore, MD ; FT enrollment: 2,900)
University of Maryland-Baltimore County (about 10 miles; Baltimore, MD ; FT enrollment: 11,160)
Loyola University Maryland (about 10 miles; Baltimore, MD ; FT enrollment: 5,215)
Towson University (about 10 miles; Towson, MD ; FT enrollment: 19,618)
Johns Hopkins University (about 10 miles; Baltimore, MD ; FT enrollment: 20,568)
Public high school in Randallstown:
Public elementary/middle schools in Randallstown:
See full list of schools located in Randallstown User-submitted facts and corrections:
randallstown is saturated with group homes - ck statistics for the county and state - you will be amazed
Notable locations in Randallstown: (A) , Liberty Road Volunteer Fire Company Station 46 (B) , Randallstown Center Nursing Home (C) . Display/hide their locations on the map
Shopping Centers: (1) , Marriott Plaza Shopping Center (2) , Brenbrook Plaza Shopping Center (3) , Liberty Court Shopping Center (4) , Liberty Plaza Shopping Center (5) , Randallstown Plaza Shopping Center (6) , Kings Point Square Shopping Center (7) . Display/hide their locations on the map
Churches in Randallstown include: (A) , Mount Paran Church (B) . Display/hide their locations on the map
Cemeteries: (1) , Chevra Ahavas Chesed Cemetery (2) . Display/hide their locations on the map
Streams, rivers, and creeks: (A) . Display/hide its location on the map
Parks in Randallstown include: (1) , Carriage Hills Park (2) , Scotts Level Park (3) , Willow Glen North Park (4) . Display/hide their locations on the map
Tourist attractions:
Courts:
Birthplace of: Domonique Foxworth - 2005 NFL player (Denver Broncos, born : Mar 27, 1983), Michele S. Jones - First woman Command Sergeant Major in the Army Reserve, Aaron Cook - College basketball player (Hartford Hawks), Antonio McMillion - College basketball player (MD Eastern Shore Hawks), Jason Osborne - College basketball player (St. Francis (PA) Red Flash), Jordan Young - Musician, Levi Stukes - College basketball player (Georgia Bulldogs).
Baltimore County has a predicted average indoor radon screening level greater than 4 pCi/L (pico curies per liter) - Highest Potential Drinking water stations with addresses in Randallstown and their reported violations in the past:
CHAPEL HILL NURSING CENTER (Population served: 125, Groundwater):
Past health violations:
MCL, Monthly (TCR) - In MAR-2010, Contaminant: Coliform. Follow-up actions: St Violation/Reminder Notice (MAR-08-2010), St Public Notif requested (MAR-15-2010), St Compliance achieved (APR-13-2010), St Public Notif received (APR-13-2010)
MCL, Monthly (TCR) - In FEB-2010, Contaminant: Coliform. Follow-up actions: St Violation/Reminder Notice (FEB-19-2010), St Public Notif requested (MAR-15-2010), St Compliance achieved (APR-13-2010), St Public Notif received (APR-13-2010)
MCL, Monthly (TCR) - In JAN-2010, Contaminant: Coliform. Follow-up actions: St Violation/Reminder Notice (JAN-20-2010), St Public Notif requested (JAN-27-2010), St Public Notif received (FEB-23-2010), St Compliance achieved (APR-13-2010)
Past monitoring violations:
Follow-up Or Routine LCR Tap M/R - In OCT-01-2013, Contaminant: Lead and Copper Rule. Follow-up actions: St Violation/Reminder Notice (2 times from MAR-19-2013 to JUL-03-2014)
Follow-up Or Routine LCR Tap M/R - In JAN-01-1999, Contaminant: Lead and Copper Rule
4 routine major monitoring violations
Drinking water stations with addresses in Randallstown that have no violations reported:
NORTH POINT SUBDIVISION (Address: 3333 OFFUTT ROAD Serves WV, Population served: 141, Primary Water Source Type: Groundwater)
WARDS CHAPEL UMC AND PRESCHOOL (Address: 11023 LIBERTY ROAD Population served: 25, Primary Water Source Type: Groundwater)
Average household size: This place:
2.7 peopleMaryland:
2.6 people
Percentage of family households: This place:
70.9%Whole state:
67.1%
Percentage of households with unmarried partners: This place:
5.1%Whole state:
6.4%
Likely homosexual households (counted as self-reported same-sex unmarried-partner households)
Lesbian couples: 0.3% of all households Gay men: 0.2% of all households
People in group quarters in Randallstown in 2010:
324 people in nursing facilities/skilled-nursing facilities
69 people in group homes intended for adults
48 people in workers' group living quarters and job corps centers
3 people in residential treatment centers for adults
People in group quarters in Randallstown in 2000:
363 people in nursing homes
208 people in other noninstitutional group quarters
34 people in homes for the physically handicapped
32 people in homes for the mentally retarded
30 people in other group homes
4 people in religious group quarters
3 people in mental (psychiatric) hospitals or wards
Banks with branches in Randallstown (2011 data):
Manufacturers and Traders Trust Company: Randallstown Branch at 8638 Liberty Road, branch established on 1990/10/31. Info updated 2011/08/08: Bank assets: $76,887.1 mil, Deposits: $60,064.2 mil, headquarters in Buffalo, NY, positive income , Commercial Lending Specialization, 808 total offices , Holding Company: M&T Bank Corporation
Wells Fargo Bank, National Association: Liberty Road Branch at 8522 Liberty Road, branch established on 1969/05/07. Info updated 2011/04/05: Bank assets: $1,161,490.0 mil, Deposits: $905,653.0 mil, headquarters in Sioux Falls, SD, positive income , 6395 total offices , Holding Company: Wells Fargo & Company
Susquehanna Bank: Randallstown Branch at 9900 Liberty Road, branch established on 1985/09/19. Info updated 2012/02/28: Bank assets: $14,849.0 mil, Deposits: $10,294.4 mil, headquarters in Lititz, PA, positive income , Commercial Lending Specialization, 308 total offices , Holding Company: Susquehanna Bancshares, Inc.
The Harbor Bank of Maryland: Liberty Plaza Branch at 8530 Liberty Road, branch established on 1974/11/15. Info updated 2006/11/03: Bank assets: $240.4 mil, Deposits: $206.2 mil, headquarters in Baltimore, MD, positive income , Commercial Lending Specialization, 7 total offices , Holding Company: Harbor Bankshares Corporation
Bank of America, National Association: Randallstown Branch at 9060 Liberty Road, branch established on 1957/12/09. Info updated 2009/11/18: Bank assets: $1,451,969.3 mil, Deposits: $1,077,176.8 mil, headquarters in Charlotte, NC, positive income , 5782 total offices , Holding Company: Bank Of America Corporation
For population 15 years and over in Randallstown:
Never married: 36.3%Now married: 44.4%Separated: 3.4%Widowed: 6.2%Divorced: 9.7% For population 25 years and over in Randallstown:
High school or higher: 91.7%Bachelor's degree or higher: 38.2%Graduate or professional degree: 15.5%Unemployed: 4.7%Mean travel time to work (commute): 27.0 minutes
Education Gini index (Inequality in education) Here:
12.2Maryland average:
12.7
Religion statistics for Randallstown, MD (based on Baltimore County data)
Religion Adherents Congregations Catholic 153,243 34 Evangelical Protestant 62,367 232 Mainline Protestant 50,484 167 Other 32,628 54 Black Protestant 32,442 37 Orthodox 1,663 3 None 472,202 -
Source: Clifford Grammich, Kirk Hadaway, Richard Houseal, Dale E.Jones, Alexei Krindatch, Richie Stanley and Richard H.Taylor. 2012. 2010 U.S.Religion Census: Religious Congregations & Membership Study. Association of Statisticians of American Religious Bodies. Jones, Dale E., et al. 2002. Congregations and Membership in the United States 2000. Nashville, TN: Glenmary Research Center. Graphs represent county-level data
Food Environment Statistics: Number of grocery stores : 137This county :
1.74 / 10,000 pop.Maryland :
1.96 / 10,000 pop.
Number of supercenters and club stores : 7Baltimore County :
0.09 / 10,000 pop.Maryland :
0.07 / 10,000 pop.
Number of convenience stores (no gas) : 88Here :
1.12 / 10,000 pop.Maryland :
1.22 / 10,000 pop.
Number of convenience stores (with gas) : 150This county :
1.91 / 10,000 pop.State :
2.05 / 10,000 pop.
Number of full-service restaurants : 367Here :
4.67 / 10,000 pop.State :
5.40 / 10,000 pop.
Adult diabetes rate : This county :
9.1%State :
9.1%
Adult obesity rate : This county :
26.4%Maryland :
26.7%
Low-income preschool obesity rate : Baltimore County :
12.7%Maryland :
15.5%
Health and Nutrition: Healthy diet rate : Randallstown:
50.6%Maryland:
50.1%
Average overall health of teeth and gums : This city:
48.9%Maryland:
47.6%
Average BMI : Randallstown:
29.7Maryland:
28.8
People feeling badly about themselves : Randallstown:
18.0%Maryland:
20.0%
People not drinking alcohol at all : This city:
13.0%State:
11.3%
Average hours sleeping at night : Randallstown:
6.6Maryland:
6.8
Overweight people : Randallstown:
37.2%Maryland:
34.1%
General health condition : Randallstown:
56.3%Maryland:
56.5%
Average condition of hearing : Randallstown:
82.9%State:
80.5%
More about Health and Nutrition of Randallstown, MD Residents
6.77% of this county's 2021 resident taxpayers lived in other counties in 2020 ($67,217 average adjusted gross income )
Here:
6.77%Maryland average:
7.42%
0.01% of residents moved from foreign countries ($84 average AGI )Baltimore County:
0.01%Maryland average:
0.05%
Top counties from which taxpayers relocated into this county between 2020 and 2021:
7.32% of this county's 2020 resident taxpayers moved to other counties in 2021 ($75,485 average adjusted gross income )
Here:
7.32%Maryland average:
7.91%
0.01% of residents moved to foreign countries ($168 average AGI )Baltimore County:
0.01%Maryland average:
0.04%
Top counties to which taxpayers relocated from this county between 2020 and 2021:
Businesses in Randallstown, MD
Name Count Name Count
7-Eleven 2 MasterBrand Cabinets 3 AMF Bowling 1 McDonald's 1 AutoZone 1 Payless 1 Cricket Wireless 1 Penske 1 Domino's Pizza 1 Pizza Hut 1 FedEx 1 Popeyes 1 Ford 1 Quiznos 1 GNC 1 RadioShack 1 GameStop 1 Rite Aid 1 H&R Block 1 T-Mobile 1 Home Depot 1 U-Haul 2 IHOP 1 Walgreens 1 KFC 1 Wendy's 1 Marshalls 1
Strongest AM radio stations in Randallstown:
WBAL (1090 AM; 50 kW; BALTIMORE, MD; Owner: HEARST RADIO, INC.)
WCBM (680 AM; 50 kW; BALTIMORE, MD; Owner: WCBM MARYLAND, INC.)
WGOP (700 AM; daytime; 25 kW; WALKERSVILLE, MD; Owner: BIRACH BROADCASTING CORPORATION)
WCAO (600 AM; 5 kW; BALTIMORE, MD; Owner: CITICASTERS LICENSES, L.P.)
WJFK (1300 AM; 5 kW; BALTIMORE, MD; Owner: INFINITY WLIF-AM, INC.)
WWLG (1370 AM; 50 kW; BALTIMORE, MD; Owner: M-10 BROADCASTING, INC.)
WMET (1150 AM; 50 kW; GAITHERSBURG, MD; Owner: BELTWAY ACQUISITION CORPORATION)
WTEM (980 AM; 50 kW; WASHINGTON, DC; Owner: AMFM RADIO LICENSES, L.L.C.)
WTOP (1500 AM; 50 kW; WASHINGTON, DC; Owner: BONNEVILLE HOLDING COMPANY)
WBIS (1190 AM; 50 kW; ANNAPOLIS, MD; Owner: NATIONS RADIO, LLC)
WPGC (1580 AM; 50 kW; MORNINGSIDE, MD; Owner: INFINITY WPGC(AM), INC.)
WNST (1570 AM; 5 kW; TOWSON, MD)
WWGB (1030 AM; daytime; 50 kW; INDIAN HEAD, MD; Owner: GOOD BODY MEDIA, LLC)
Strongest FM radio stations in Randallstown:
WZBA (100.7 FM; WESTMINSTER, MD; Owner: SHAMROCK COMMUNICATIONS, INC.)
WBJC (91.5 FM; BALTIMORE, MD; Owner: BALTIMORE CITY COMMUNITY COLLEGE)
WQSR (102.7 FM; BALTIMORE, MD; Owner: INFINITY OF CHESAPEAKE LICENSEE CORP.)
WWMX (106.5 FM; BALTIMORE, MD; Owner: INFINITY RADIO OPERATIONS INC.)
WPOC (93.1 FM; BALTIMORE, MD; Owner: CITICASTERS LICENSES, L.P.)
WIYY (97.9 FM; BALTIMORE, MD; Owner: HEARST RADIO, INC.)
WERQ-FM (92.3 FM; BALTIMORE, MD; Owner: RADIO ONE LICENSES, LLC)
WLIF (101.9 FM; BALTIMORE, MD; Owner: INFINITY WLIF, INC.)
WYPR (88.1 FM; BALTIMORE, MD; Owner: WYPR LICENSE HOLDING LLC)
WRBS (95.1 FM; BALTIMORE, MD; Owner: PETER & JOHN RADIO FELLOWSHIP, INC.)
WXYV (105.7 FM; CATONSVILLE, MD; Owner: INFINITY RADIO OPERATIONS INC.)
WTMD (89.7 FM; TOWSON, MD; Owner: TOWSON UNIVERSITY)
WSMJ (104.3 FM; BALTIMORE, MD; Owner: CITICASTERS LICENSES, L.P.)
WFRE (99.9 FM; FREDERICK, MD; Owner: CAPSTAR TX LIMITED PARTNERSHIP)
WAYZ-FM (104.7 FM; HAGERSTOWN, MD; Owner: HJV LIMITED PARTNERSHIP)
W219BX (91.7 FM; FREDERICK, MD; Owner: CEDAR RIDGE CHILDREN'S HOME & SCHOOL, INC)
WETH (89.1 FM; HAGERSTOWN, MD; Owner: GREATER WASHINGTON EDUCATIONAL TELECOMMUNICATIONS ASSN.)
WEAA (88.9 FM; BALTIMORE, MD; Owner: MORGAN STATE COLLEGE)
WWDC-FM (101.1 FM; WASHINGTON, DC; Owner: AMFM RADIO LICENSES, L.L.C.)
WYCR (98.5 FM; YORK-HANOVER, PA; Owner: RADIO HANOVER, INC.)
TV broadcast stations around Randallstown:
WMPB (Channel 67; BALTIMORE, MD; Owner: MARYLAND PUBLIC BROADCASTING COMMISSION)
WBAL-TV (Channel 11; BALTIMORE, MD; Owner: WBAL HEARST-ARGYLE TV, INC. (CA CORP.))
WMAR-TV (Channel 2; BALTIMORE, MD; Owner: SCRIPPS HOWARD BROADCASTING COMPANY)
WUTB (Channel 24; BALTIMORE, MD; Owner: FOX TELEVISION STATIONS, INC.)
WBFF (Channel 45; BALTIMORE, MD; Owner: CHESAPEAKE TELEVISION LICENSEE, LLC)
WNUV (Channel 54; BALTIMORE, MD; Owner: BALTIMORE (WNUV-TV) LICENSEE, INC.)
WJZ-TV (Channel 13; BALTIMORE, MD; Owner: VIACOM INC.)
WMPT (Channel 22; ANNAPOLIS, MD; Owner: MARYLAND PUBLIC BROADCASTING COMMISSION)
WTTG (Channel 5; WASHINGTON, DC; Owner: FOX TELEVISION STATIONS, INC.)
WJLA-TV (Channel 7; WASHINGTON, DC; Owner: ACC LICENSEE, INC.)
WUSA (Channel 9; WASHINGTON, DC; Owner: THE DETROIT NEWS, INC.)
WBDC-TV (Channel 50; WASHINGTON, DC; Owner: WBDC BROADCASTING, INC.)
WETA-TV (Channel 26; WASHINGTON, DC; Owner: THE GREATER WASHINGTON ED TELECOMM. ASSOC)
WMJF-LP (Channel 16; TOWSON, MD; Owner: TOWSON UNIVERSITY)
WDCA (Channel 20; WASHINGTON, DC; Owner: FOX TELEVISION STATIONS, INC.)
WHUT-TV (Channel 32; WASHINGTON, DC; Owner: HOWARD UNIVERSITY)
WRC-TV (Channel 4; WASHINGTON, DC; Owner: NBC SUBSIDIARY (WRC-TV), INC.)
WFPT (Channel 62; FREDERICK, MD; Owner: MARYLAND PUBLIC BROADCASTING COMMISSION)
National Bridge Inventory (NBI) Statistics 10 Number of bridges75ft / 23.4m Total length $319,000 Total costs371,559 Total average daily traffic4,970 Total average daily truck traffic
New bridges - historical statistics
1 1920-1929 1 1930-1939 1 1940-1949 2 1960-1969 4 1980-1989 1 1990-1999
See full National Bridge Inventory statistics for Randallstown, MD
FCC Registered Antenna Towers: 71 (
See the full list of FCC Registered Antenna Towers in Randallstown )
FCC Registered Commercial Land Mobile Towers: 1 (
See the full list of FCC Registered Commercial Land Mobile Towers in Randallstown, MD )
FCC Registered Broadcast Land Mobile Towers: 9 (
See the full list of FCC Registered Broadcast Land Mobile Towers )
FCC Registered Microwave Towers: 4
RANDALLSTOWN, Old Court Road (088051) (Lat: 39.351250 Lon: -76.798361), Type: Tower, Structure height: 67.9 m, Overall height: 74.9 m, Call Sign: WQIE798, Assigned Frequencies: 10835.0 MHz, Grant Date: 01/18/2008, Expiration Date: 01/18/2018, Cancellation Date: 07/18/2009, Certifier: William Chastain, Registrant: Radio Dynamics Corporation, 774 Mays Blvd., #10-465, Silver Spring, MD 20914, Phone: (301) 493-5171, Fax: (301) 576-4553, Email:
Randallstown MD, 9635 Liberty Road (Lat: 39.376333 Lon: -76.818194), Type: Pole, Structure height: 46 m, Overall height: 46.9 m, Call Sign: WQIE799, Assigned Frequencies: 11325.0 MHz, Grant Date: 01/18/2008, Expiration Date: 01/18/2018, Cancellation Date: 07/18/2009, Certifier: William Chastain, Registrant: Radio Dynamics Corporation, Silver Spring, MD 20914, Phone: (301) 493-5171, Fax: (301) 576-4553, Email:
HARRISONVILL, 4008 Falls Run Road (Lat: 39.386000 Lon: -76.843389), Type: Upole, Structure height: 48.4 m, Overall height: 54.8 m, Call Sign: WQOG302, Licensee ID: L00007636, Assigned Frequencies: 11055.0 MHz, Grant Date: 08/18/2021, Expiration Date: 09/15/2031, Certifier: James L Snyder, Registrant: Baltimore Gas & Electric Company, 2900 Lord Baltimore Drive, Room 104, Baltimore, MD 21244, Phone: (410) 470-8565, Fax: (410) 470-8599, Email:
DC03XC370, 725 Mount Wilson Ln (Lat: 39.381444 Lon: -76.764389), Type: Bant, Structure height: 37.8 m, Overall height: 40.8 m, Call Sign: WQPU902, Assigned Frequencies: 11505.0 MHz, 11585.0 MHz, 21925.0 MHz, 11505.0 MHz, 11585.0 MHz, 21925.0 MHz, 11505.0 MHz, 11585.0 MHz, 21925.0 MHz, 21925.0 MHz, Grant Date: 08/21/2012, Expiration Date: 08/21/2022, Cancellation Date: 10/06/2015, Certifier: Kyle B Entz, Registrant: Sprint Corporation, 12502 Sunrise Valley Drive, M/S: Varesa0209, Reston, VA 20196, Phone: (703) 433-4000, Fax: (703) 433-4483 FCC Registered Paging Towers: 2
5305 Old Court Road (Lat: 39.360361 Lon: -76.778861), Overall height: 23.9 m, Call Sign: KGC602, Assigned Frequencies: 152.630 MHz, Grant Date: 08/14/2018, Expiration Date: 07/01/2028, Certifier: J. Roy Pottle, Registrant: Wilkinson Barker Knauer, LLP, 1800 M Street, N.W., Suite 800n, Washington, DC 20036, Phone: (202) 783-4141, Fax: (202) 783-5851, Email:
5305 Old Court Road (Lat: 39.360361 Lon: -76.778861), Overall height: 23.9 m, Call Sign: KWH310, Assigned Frequencies: 152.840 MHz, Grant Date: 04/23/2019, Expiration Date: 04/01/2029, Certifier: J. Roy Pottle, Registrant: Wilkinson Barker Knauer, LLP, 1800 M Street, N.W., Suite 800n, Washington, DC 20036, Phone: (202) 783-4141, Fax: (202) 783-5851, Email:
FCC Registered Maritime Coast & Aviation Ground Towers: 1
3705 Offutt Rd (Lat: 39.372889 Lon: -76.797472), Type: Building, Overall height: 8 m, Call Sign: KBA337, Assigned Frequencies: 156.450 MHz, 156.575 MHz, 156.600 MHz, 156.800 MHz, 156.975 MHz, Grant Date: 09/15/1993, Expiration Date: 09/15/1998, Cancellation Date: 05/06/2001, Registrant: Baltimore Marine Recovery Inc, 3705 Offutt Rd, Randallstown, MD 21133 FCC Registered Amateur Radio Licenses: 44 (
See the full list of FCC Registered Amateur Radio Licenses in Randallstown )
Home Mortgage Disclosure Act Aggregated Statistics For Year 2009(Based on 5 full and 3 partial tracts) A) FHA, FSA/RHS & VA B) Conventional C) Refinancings D) Home Improvement Loans E) Loans on Dwellings For 5+ Families F) Non-occupant Loans on G) Loans On Manufactured Number Average Value Number Average Value Number Average Value Number Average Value Number Average Value Number Average Value Number Average Value
LOANS ORIGINATED 141 $220,176 32 $174,517 660 $221,112 27 $86,903 0 $0 26 $177,492 0 $0 APPLICATIONS APPROVED, NOT ACCEPTED 3 $245,210 1 $100,380 93 $236,339 13 $48,498 0 $0 1 $143,130 0 $0 APPLICATIONS DENIED 25 $240,542 9 $150,557 356 $230,651 42 $73,275 0 $0 9 $167,327 0 $0 APPLICATIONS WITHDRAWN 24 $217,737 11 $138,855 245 $231,812 8 $88,588 1 $7,346,400 8 $117,856 1 $9,810 FILES CLOSED FOR INCOMPLETENESS 3 $272,213 4 $176,165 63 $249,879 1 $165,410 0 $0 3 $229,277 0 $0
Aggregated Statistics For Year 2008(Based on 5 full and 3 partial tracts) A) FHA, FSA/RHS & VA B) Conventional C) Refinancings D) Home Improvement Loans F) Non-occupant Loans on Number Average Value Number Average Value Number Average Value Number Average Value Number Average Value
LOANS ORIGINATED 128 $243,590 74 $235,296 664 $220,482 72 $81,794 39 $194,514 APPLICATIONS APPROVED, NOT ACCEPTED 7 $257,710 16 $243,740 144 $206,406 34 $89,622 9 $133,328 APPLICATIONS DENIED 22 $247,055 24 $223,312 613 $247,439 130 $80,067 23 $165,965 APPLICATIONS WITHDRAWN 22 $258,128 14 $257,655 254 $248,389 22 $169,465 9 $150,114 FILES CLOSED FOR INCOMPLETENESS 3 $215,997 9 $210,689 74 $252,227 5 $65,854 14 $251,887
Aggregated Statistics For Year 2007(Based on 5 full and 3 partial tracts) A) FHA, FSA/RHS & VA B) Conventional C) Refinancings D) Home Improvement Loans E) Loans on Dwellings For 5+ Families F) Non-occupant Loans on Number Average Value Number Average Value Number Average Value Number Average Value Number Average Value Number Average Value
LOANS ORIGINATED 44 $264,881 330 $214,328 1,164 $215,138 168 $102,125 1 $12,800,000 63 $187,417 APPLICATIONS APPROVED, NOT ACCEPTED 4 $236,495 47 $225,438 215 $208,809 39 $84,790 0 $0 4 $381,118 APPLICATIONS DENIED 13 $254,868 129 $222,987 1,029 $235,009 151 $99,844 0 $0 39 $222,809 APPLICATIONS WITHDRAWN 10 $260,637 70 $206,121 479 $231,389 32 $137,383 0 $0 12 $171,592 FILES CLOSED FOR INCOMPLETENESS 1 $140,790 20 $246,734 169 $243,114 8 $159,086 0 $0 6 $178,117
Aggregated Statistics For Year 2006(Based on 5 full and 3 partial tracts) A) FHA, FSA/RHS & VA B) Conventional C) Refinancings D) Home Improvement Loans E) Loans on Dwellings For 5+ Families F) Non-occupant Loans on G) Loans On Manufactured Number Average Value Number Average Value Number Average Value Number Average Value Number Average Value Number Average Value Number Average Value
LOANS ORIGINATED 28 $247,116 651 $187,985 1,662 $204,802 234 $113,781 2 $2,414,340 78 $174,518 0 $0 APPLICATIONS APPROVED, NOT ACCEPTED 0 $0 92 $189,662 315 $185,330 43 $61,499 0 $0 20 $148,269 1 $49,000 APPLICATIONS DENIED 10 $248,498 215 $186,813 1,000 $210,903 177 $111,466 1 $120,500 42 $203,347 0 $0 APPLICATIONS WITHDRAWN 5 $261,326 94 $179,205 692 $207,735 47 $133,284 0 $0 25 $176,268 0 $0 FILES CLOSED FOR INCOMPLETENESS 1 $111,460 33 $202,680 233 $221,967 11 $128,929 0 $0 10 $197,150 0 $0
Aggregated Statistics For Year 2005(Based on 5 full and 3 partial tracts) A) FHA, FSA/RHS & VA B) Conventional C) Refinancings D) Home Improvement Loans F) Non-occupant Loans on G) Loans On Manufactured Number Average Value Number Average Value Number Average Value Number Average Value Number Average Value Number Average Value
LOANS ORIGINATED 37 $220,913 785 $166,966 1,862 $181,949 205 $94,820 93 $157,474 2 $30,050 APPLICATIONS APPROVED, NOT ACCEPTED 4 $119,540 80 $165,145 313 $167,434 35 $37,639 15 $170,349 0 $0 APPLICATIONS DENIED 4 $248,930 170 $167,757 970 $176,960 181 $73,252 32 $145,718 4 $20,630 APPLICATIONS WITHDRAWN 5 $234,190 129 $179,047 875 $182,117 68 $157,254 23 $146,303 1 $216,040 FILES CLOSED FOR INCOMPLETENESS 1 $106,660 30 $149,571 205 $194,350 14 $61,616 5 $159,362 0 $0
Aggregated Statistics For Year 2004(Based on 5 full and 3 partial tracts) A) FHA, FSA/RHS & VA B) Conventional C) Refinancings D) Home Improvement Loans E) Loans on Dwellings For 5+ Families F) Non-occupant Loans on G) Loans On Manufactured Number Average Value Number Average Value Number Average Value Number Average Value Number Average Value Number Average Value Number Average Value
LOANS ORIGINATED 75 $175,431 550 $156,605 1,412 $150,945 121 $68,281 2 $6,951,500 67 $124,325 2 $56,780 APPLICATIONS APPROVED, NOT ACCEPTED 11 $167,768 77 $156,523 311 $145,098 24 $56,445 0 $0 11 $139,133 0 $0 APPLICATIONS DENIED 12 $159,648 117 $157,322 827 $147,837 162 $39,695 1 $250,000 17 $116,436 5 $72,912 APPLICATIONS WITHDRAWN 8 $198,966 73 $149,756 716 $153,535 38 $87,698 0 $0 12 $135,152 1 $220,000 FILES CLOSED FOR INCOMPLETENESS 1 $123,140 34 $157,879 120 $151,070 10 $51,214 0 $0 2 $161,365 0 $0
Aggregated Statistics For Year 2003(Based on 5 full and 3 partial tracts) A) FHA, FSA/RHS & VA B) Conventional C) Refinancings D) Home Improvement Loans E) Loans on Dwellings For 5+ Families F) Non-occupant Loans on Number Average Value Number Average Value Number Average Value Number Average Value Number Average Value Number Average Value
LOANS ORIGINATED 176 $166,141 352 $144,144 1,894 $133,448 70 $23,594 3 $12,833,877 61 $115,798 APPLICATIONS APPROVED, NOT ACCEPTED 19 $164,764 44 $126,280 323 $127,524 35 $33,976 0 $0 7 $112,684 APPLICATIONS DENIED 29 $162,066 55 $142,473 743 $130,701 100 $19,329 0 $0 18 $84,307 APPLICATIONS WITHDRAWN 28 $161,952 53 $142,063 537 $142,530 9 $38,596 0 $0 5 $69,202 FILES CLOSED FOR INCOMPLETENESS 5 $188,318 12 $172,488 126 $131,597 2 $24,185 0 $0 1 $46,930
Aggregated Statistics For Year 2002(Based on 2 full and 1 partial tracts) A) FHA, FSA/RHS & VA B) Conventional C) Refinancings D) Home Improvement Loans F) Non-occupant Loans on Number Average Value Number Average Value Number Average Value Number Average Value Number Average Value
LOANS ORIGINATED 53 $134,719 90 $142,292 283 $142,787 21 $22,813 16 $91,767 APPLICATIONS APPROVED, NOT ACCEPTED 2 $80,775 11 $153,765 40 $134,512 12 $14,176 1 $50,990 APPLICATIONS DENIED 3 $180,563 17 $132,636 139 $126,075 18 $16,322 2 $190,500 APPLICATIONS WITHDRAWN 7 $130,546 15 $200,812 119 $135,606 4 $8,098 5 $115,776 FILES CLOSED FOR INCOMPLETENESS 1 $137,450 7 $111,849 15 $129,507 0 $0 2 $28,000
Aggregated Statistics For Year 2001(Based on 2 full and 1 partial tracts) A) FHA, FSA/RHS & VA B) Conventional C) Refinancings D) Home Improvement Loans F) Non-occupant Loans on Number Average Value Number Average Value Number Average Value Number Average Value Number Average Value
LOANS ORIGINATED 68 $121,136 62 $141,526 241 $128,442 26 $20,870 7 $87,520 APPLICATIONS APPROVED, NOT ACCEPTED 1 $184,010 7 $174,966 34 $108,373 6 $13,107 0 $0 APPLICATIONS DENIED 5 $113,850 17 $117,581 120 $104,448 25 $14,806 3 $157,967 APPLICATIONS WITHDRAWN 3 $75,100 5 $172,304 97 $105,723 4 $13,192 1 $125,000 FILES CLOSED FOR INCOMPLETENESS 0 $0 2 $110,690 23 $83,653 0 $0 1 $180,000
Aggregated Statistics For Year 2000(Based on 2 full and 1 partial tracts) A) FHA, FSA/RHS & VA B) Conventional C) Refinancings D) Home Improvement Loans E) Loans on Dwellings For 5+ Families F) Non-occupant Loans on Number Average Value Number Average Value Number Average Value Number Average Value Number Average Value Number Average Value
LOANS ORIGINATED 77 $115,170 37 $141,391 74 $115,302 23 $18,236 1 $112,330 2 $113,250 APPLICATIONS APPROVED, NOT ACCEPTED 5 $123,660 7 $144,393 27 $93,021 21 $21,375 0 $0 0 $0 APPLICATIONS DENIED 10 $97,850 12 $131,717 127 $83,667 59 $22,089 0 $0 3 $84,513 APPLICATIONS WITHDRAWN 9 $101,341 13 $100,917 52 $88,588 3 $67,270 0 $0 3 $66,667 FILES CLOSED FOR INCOMPLETENESS 0 $0 1 $137,450 7 $145,264 0 $0 0 $0 0 $0
Aggregated Statistics For Year 1999(Based on 2 full and 3 partial tracts) A) FHA, FSA/RHS & VA B) Conventional C) Refinancings D) Home Improvement Loans E) Loans on Dwellings For 5+ Families F) Non-occupant Loans on Number Average Value Number Average Value Number Average Value Number Average Value Number Average Value Number Average Value
LOANS ORIGINATED 294 $123,883 167 $122,371 504 $105,780 81 $22,431 0 $0 15 $90,066 APPLICATIONS APPROVED, NOT ACCEPTED 11 $127,025 35 $106,109 152 $98,810 34 $20,764 1 $1,154,700 8 $63,595 APPLICATIONS DENIED 23 $125,123 43 $113,420 400 $101,585 134 $16,972 0 $0 9 $72,837 APPLICATIONS WITHDRAWN 30 $133,111 32 $130,182 223 $94,293 21 $29,891 0 $0 2 $70,360 FILES CLOSED FOR INCOMPLETENESS 8 $108,478 5 $157,760 48 $98,514 1 $5,430 0 $0 1 $58,330
Detailed HMDA statistics for the following Tracts:
4025.03
, 4025.04 , 4025.05 , 4025.06 , 4025.07 , 4026.02 , 4026.03 , 4026.04
Private Mortgage Insurance Companies Aggregated Statistics For Year 2009(Based on 5 full and 3 partial tracts) A) Conventional B) Refinancings C) Non-occupant Loans on Number Average Value Number Average Value Number Average Value
LOANS ORIGINATED 4 $196,985 12 $243,943 0 $0 APPLICATIONS APPROVED, NOT ACCEPTED 2 $187,145 5 $309,300 1 $129,000 APPLICATIONS DENIED 0 $0 0 $0 0 $0 APPLICATIONS WITHDRAWN 0 $0 2 $223,415 0 $0 FILES CLOSED FOR INCOMPLETENESS 0 $0 0 $0 0 $0
Aggregated Statistics For Year 2008(Based on 5 full and 3 partial tracts) A) Conventional B) Refinancings C) Non-occupant Loans on Number Average Value Number Average Value Number Average Value
LOANS ORIGINATED 43 $255,112 53 $256,096 2 $177,250 APPLICATIONS APPROVED, NOT ACCEPTED 24 $264,885 42 $288,764 2 $200,430 APPLICATIONS DENIED 5 $297,378 11 $269,527 4 $242,722 APPLICATIONS WITHDRAWN 3 $334,080 2 $306,440 0 $0 FILES CLOSED FOR INCOMPLETENESS 2 $151,780 3 $294,870 1 $163,560
Aggregated Statistics For Year 2007(Based on 5 full and 3 partial tracts) A) Conventional B) Refinancings C) Non-occupant Loans on Number Average Value Number Average Value Number Average Value
LOANS ORIGINATED 127 $259,772 93 $274,155 7 $235,934 APPLICATIONS APPROVED, NOT ACCEPTED 15 $259,217 14 $318,923 2 $213,880 APPLICATIONS DENIED 1 $345,780 2 $481,235 0 $0 APPLICATIONS WITHDRAWN 9 $260,933 12 $273,749 1 $269,800 FILES CLOSED FOR INCOMPLETENESS 2 $331,020 2 $268,815 0 $0
Aggregated Statistics For Year 2006(Based on 5 full and 3 partial tracts) A) Conventional B) Refinancings C) Non-occupant Loans on Number Average Value Number Average Value Number Average Value
LOANS ORIGINATED 57 $241,803 69 $248,881 4 $157,045 APPLICATIONS APPROVED, NOT ACCEPTED 7 $269,833 20 $226,369 1 $144,000 APPLICATIONS DENIED 0 $0 3 $277,363 1 $318,130 APPLICATIONS WITHDRAWN 5 $284,566 7 $226,119 1 $256,000 FILES CLOSED FOR INCOMPLETENESS 0 $0 0 $0 0 $0
Aggregated Statistics For Year 2005(Based on 5 full and 3 partial tracts) A) Conventional B) Refinancings C) Non-occupant Loans on Number Average Value Number Average Value Number Average Value
LOANS ORIGINATED 92 $222,404 88 $213,721 5 $172,992 APPLICATIONS APPROVED, NOT ACCEPTED 16 $194,213 17 $175,868 2 $132,500 APPLICATIONS DENIED 1 $164,020 1 $171,000 1 $209,380 APPLICATIONS WITHDRAWN 2 $195,745 8 $217,376 0 $0 FILES CLOSED FOR INCOMPLETENESS 0 $0 3 $173,780 0 $0
Aggregated Statistics For Year 2004(Based on 5 full and 3 partial tracts) A) Conventional B) Refinancings C) Non-occupant Loans on Number Average Value Number Average Value Number Average Value
LOANS ORIGINATED 128 $180,343 95 $172,267 11 $123,422 APPLICATIONS APPROVED, NOT ACCEPTED 21 $201,818 34 $164,831 6 $120,172 APPLICATIONS DENIED 3 $220,897 3 $166,477 2 $138,625 APPLICATIONS WITHDRAWN 7 $160,100 8 $151,225 3 $134,043 FILES CLOSED FOR INCOMPLETENESS 0 $0 2 $126,930 0 $0
Aggregated Statistics For Year 2003(Based on 5 full and 3 partial tracts) A) Conventional B) Refinancings C) Non-occupant Loans on Number Average Value Number Average Value Number Average Value
LOANS ORIGINATED 104 $157,226 148 $156,708 13 $124,703 APPLICATIONS APPROVED, NOT ACCEPTED 11 $155,388 48 $164,264 3 $166,703 APPLICATIONS DENIED 3 $193,280 1 $221,250 0 $0 APPLICATIONS WITHDRAWN 5 $147,584 12 $159,948 2 $112,000 FILES CLOSED FOR INCOMPLETENESS 0 $0 2 $211,500 0 $0
Aggregated Statistics For Year 2002(Based on 2 full and 1 partial tracts) A) Conventional B) Refinancings C) Non-occupant Loans on Number Average Value Number Average Value Number Average Value
LOANS ORIGINATED 26 $152,495 30 $183,878 1 $47,300 APPLICATIONS APPROVED, NOT ACCEPTED 6 $124,667 4 $146,488 2 $97,000 APPLICATIONS DENIED 1 $121,000 4 $165,750 3 $134,000 APPLICATIONS WITHDRAWN 0 $0 2 $119,295 0 $0 FILES CLOSED FOR INCOMPLETENESS 0 $0 0 $0 0 $0
Aggregated Statistics For Year 2001(Based on 2 full and 1 partial tracts) A) Conventional B) Refinancings C) Non-occupant Loans on Number Average Value Number Average Value Number Average Value
LOANS ORIGINATED 28 $173,355 26 $182,165 2 $66,825 APPLICATIONS APPROVED, NOT ACCEPTED 1 $121,940 6 $158,385 0 $0 APPLICATIONS DENIED 1 $94,000 2 $139,485 0 $0 APPLICATIONS WITHDRAWN 0 $0 0 $0 0 $0 FILES CLOSED FOR INCOMPLETENESS 0 $0 0 $0 0 $0
Aggregated Statistics For Year 2000(Based on 2 full and 1 partial tracts) A) Conventional B) Refinancings Number Average Value Number Average Value
LOANS ORIGINATED 7 $145,491 12 $119,458 APPLICATIONS APPROVED, NOT ACCEPTED 4 $199,878 4 $159,195 APPLICATIONS DENIED 1 $313,340 0 $0 APPLICATIONS WITHDRAWN 0 $0 2 $113,860 FILES CLOSED FOR INCOMPLETENESS 0 $0 0 $0
Aggregated Statistics For Year 1999(Based on 2 full and 3 partial tracts) A) Conventional B) Refinancings C) Non-occupant Loans on Number Average Value Number Average Value Number Average Value
LOANS ORIGINATED 58 $149,690 69 $139,491 3 $64,633 APPLICATIONS APPROVED, NOT ACCEPTED 6 $153,083 9 $144,458 1 $90,560 APPLICATIONS DENIED 8 $168,528 4 $175,965 2 $56,390 APPLICATIONS WITHDRAWN 2 $116,710 3 $146,213 0 $0 FILES CLOSED FOR INCOMPLETENESS 1 $76,700 3 $119,730 0 $0
Detailed PMIC statistics for the following Tracts:
4025.03
, 4025.04 , 4025.05 , 4025.06 , 4025.07 , 4026.02 , 4026.03 , 4026.04
Most common first names in Randallstown, MD among deceased individuals Name Count Lived (average)
Mary 149 77.8 years William 144 73.3 years John 116 72.9 years James 103 69.0 years Charles 97 73.9 years George 94 73.9 years Robert 80 66.9 years Joseph 75 73.6 years Helen 75 78.8 years Harry 74 75.7 years
Most common last names in Randallstown, MD among deceased individuals Last name Count Lived (average)
Smith 71 74.5 years Brown 51 68.7 years Johnson 50 73.0 years Jones 41 74.5 years Williams 37 72.2 years Cohen 37 77.1 years Wilson 26 73.5 years Jackson 26 68.5 years Levin 26 73.3 years Davis 25 69.3 years
Randallstown compared to Maryland state average:
Unemployed percentage significantly below state average. Black race population percentage significantly above state average. Hispanic race population percentage below state average. Median age above state average. Length of stay since moving in significantly above state average. Randallstown on our top lists :
#12 on the list of "Top 101 cities with the most residents born in Nigeria (population 500+)"
#43 on the list of "Top 101 cities with the most residents born in Western Africa (population 500+)"
#60 on the list of "Top 101 cities with the most residents born in Middle Africa (population 500+)"
#75 on the list of "Top 101 cities with the most residents born in Africa (population 500+)"
#65 (21133) on the list of "Top 101 zip codes with the largest percentage of Subsaharan African first ancestries"
#76 (21133) on the list of "Top 101 zip codes with the lowest 2012 average reported profit/loss from business (pop 5,000+)"
#14 on the list of "Top 101 counties with the highest surface withdrawal of fresh water for public supply"
#15 on the list of "Top 101 counties with the largest increase in the number of births per 1000 residents 2000-2006 to 2007-2013 (pop 50,000+)"
#22 on the list of "Top 101 counties with the highest total withdrawal of fresh water for public supply"
#29 on the list of "Top 101 counties with the most Black Protestant adherents"
#35 on the list of "Top 101 counties with the lowest ground withdrawal of fresh water for public supply (pop. 50,000+)"
Top Patent Applicants
Sharon Kennedy (47)
Julie L. Rosales (4)
Sheena Young (3)
Jeffery H. Bruton (2)
Keren Espina (2)
Dawnielle Farrar (2)
Leon T. Gibson (2)
Douty Bamba (2)
Mitchell A. Friedman (1)
Nitu Harshendu Thakore (1)
Total of 72 patent applications in 2008-2024.
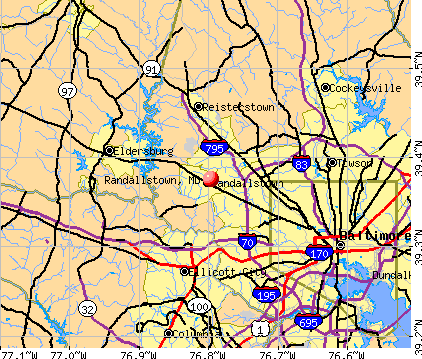


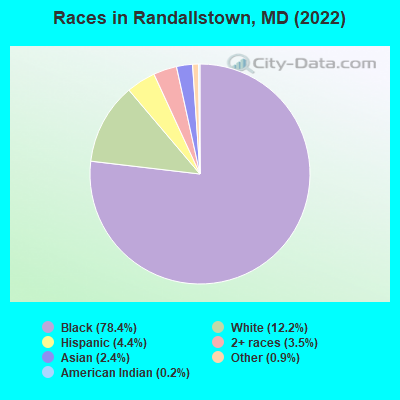
 Recent articles from our blog. Our writers, many of them Ph.D. graduates or candidates, create easy-to-read articles on a wide variety of topics.

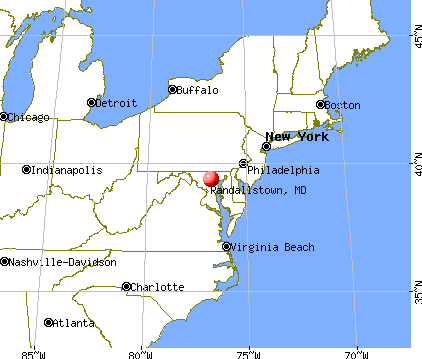
 (7.6 miles
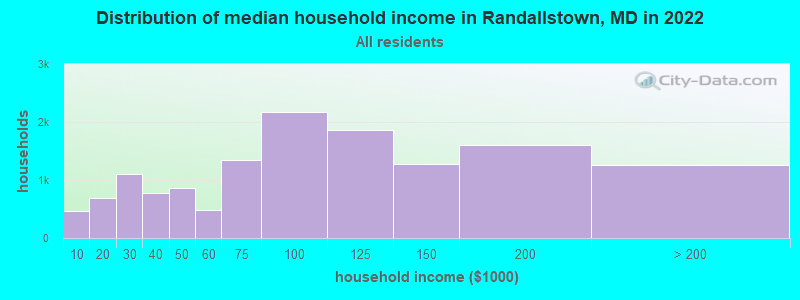
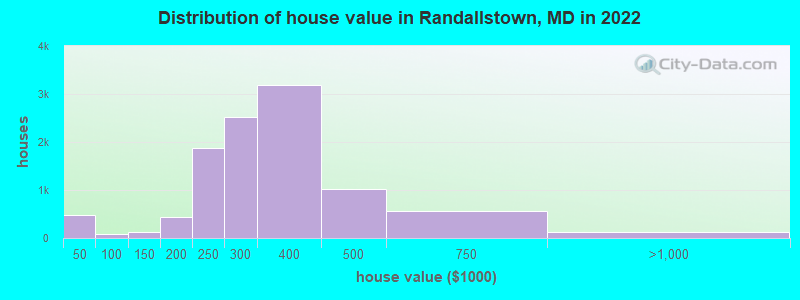
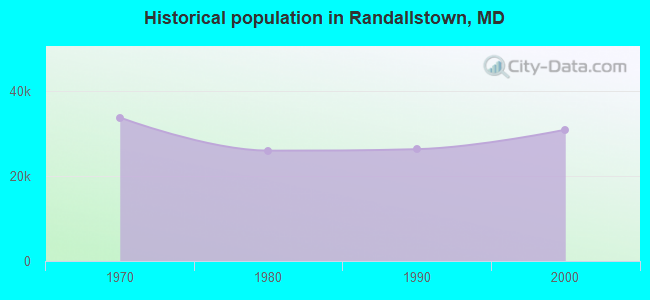
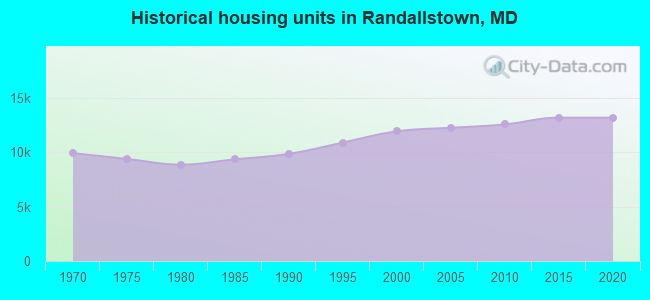
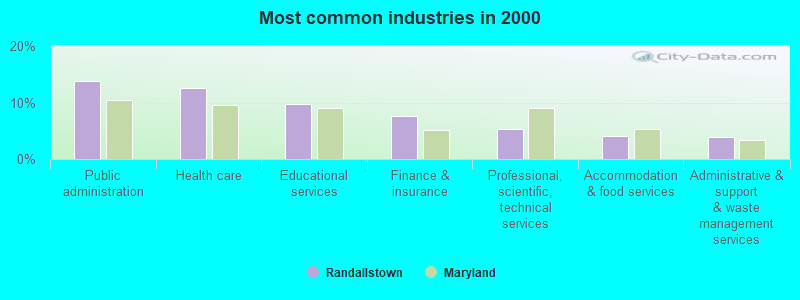
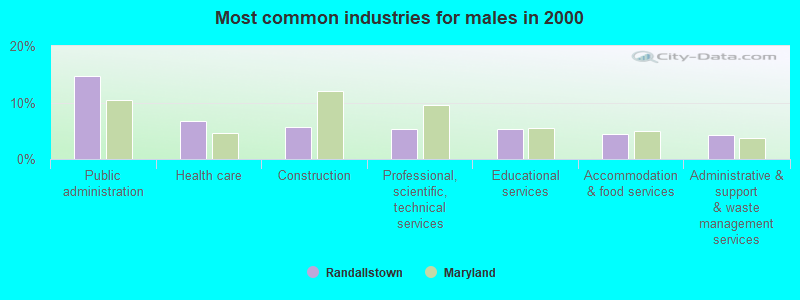
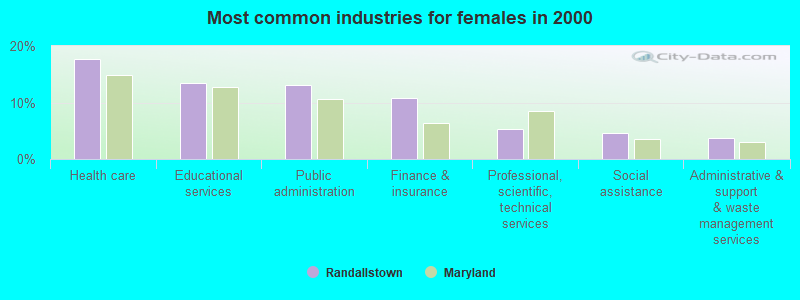
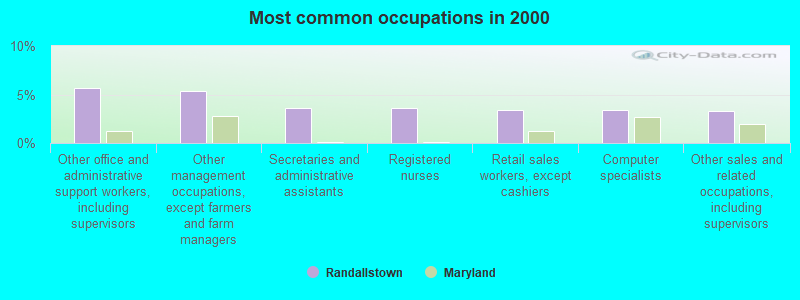
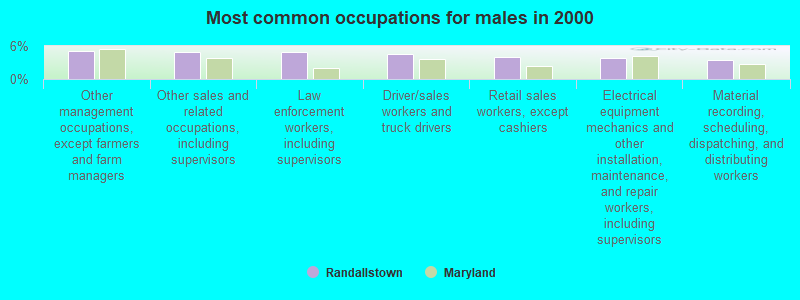
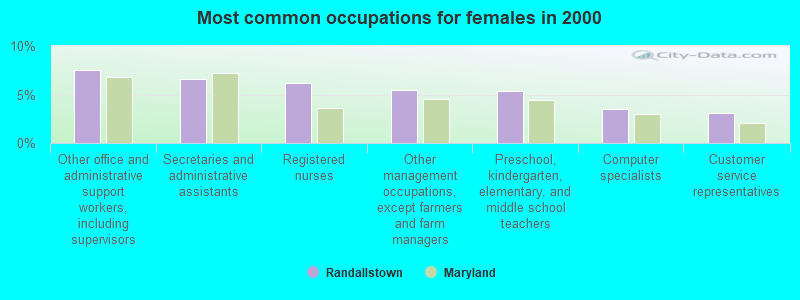
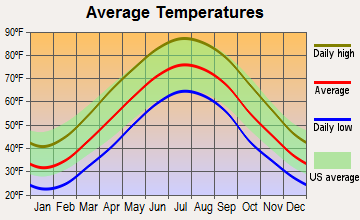
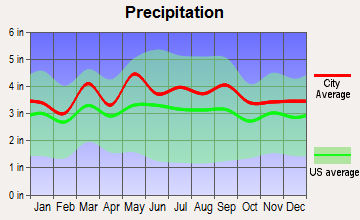
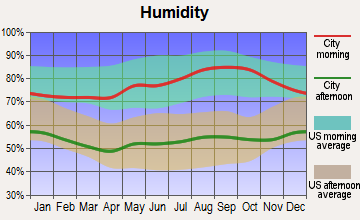
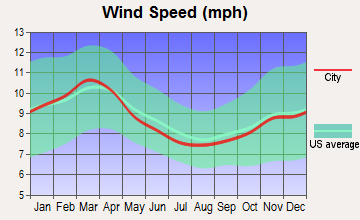
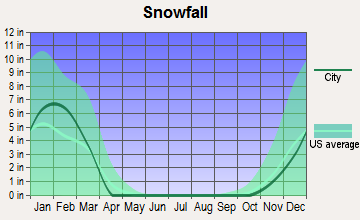
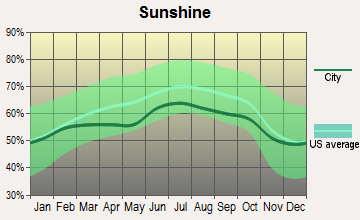
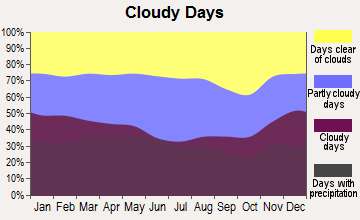


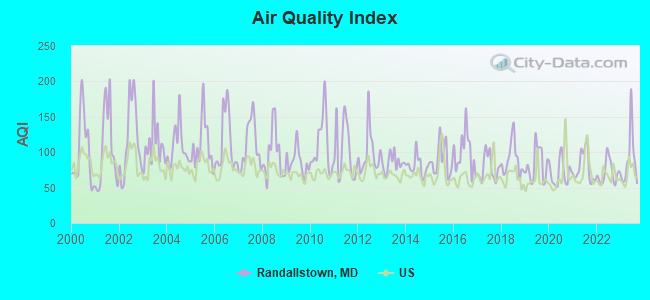
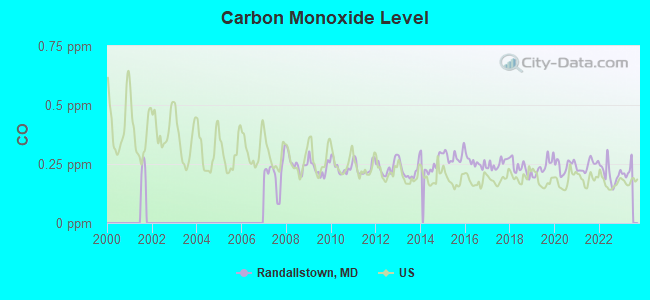
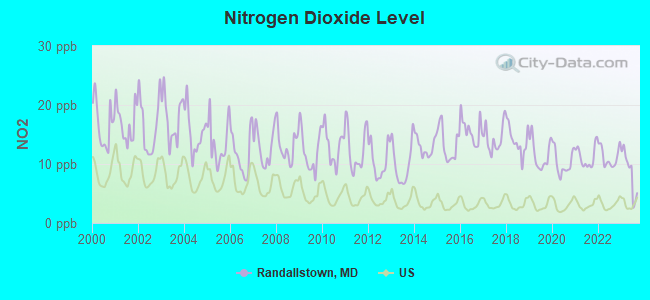
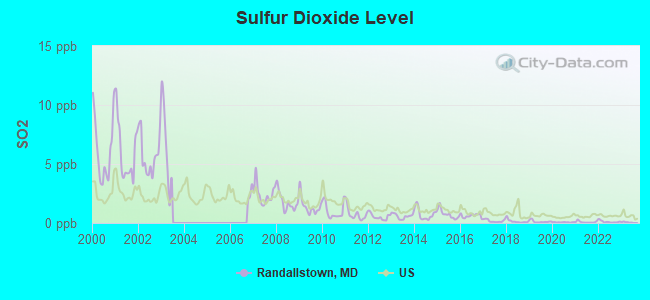
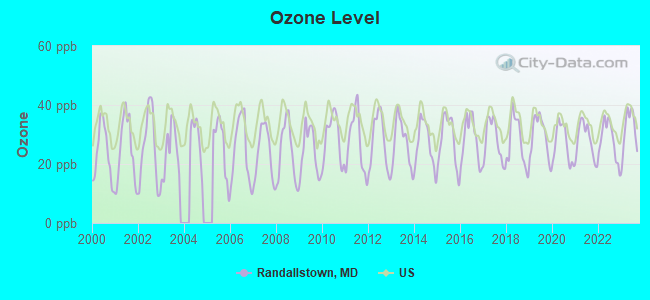
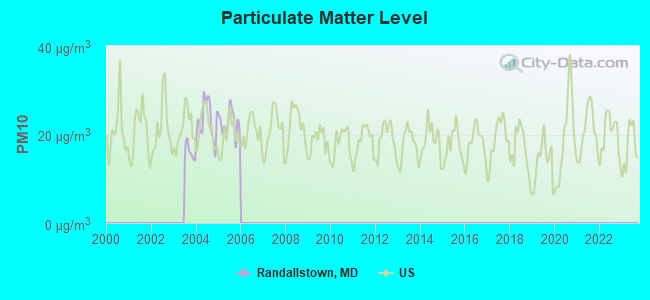
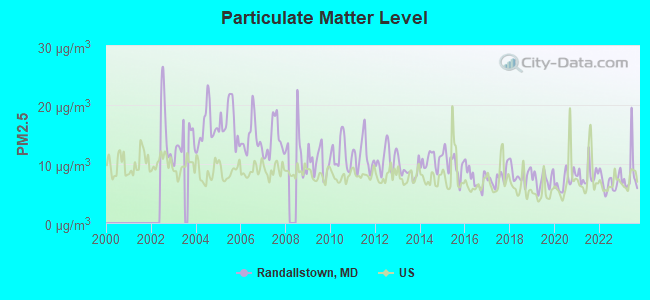

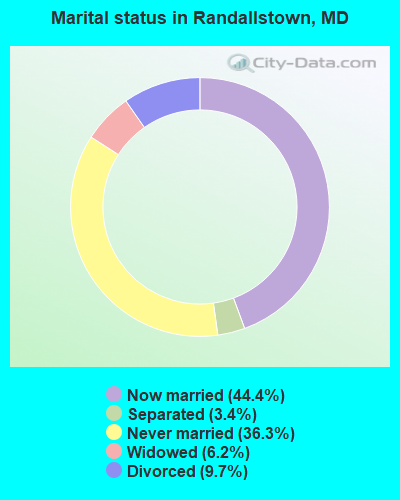
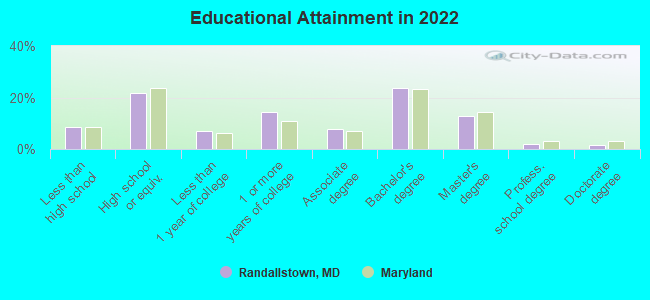
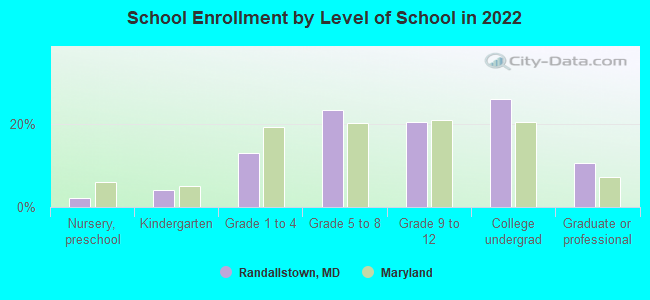
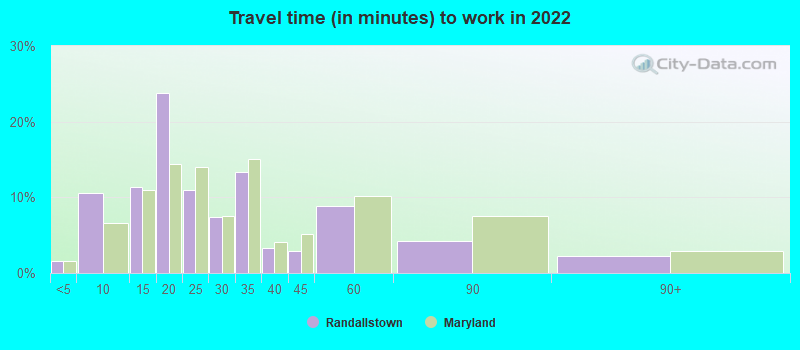
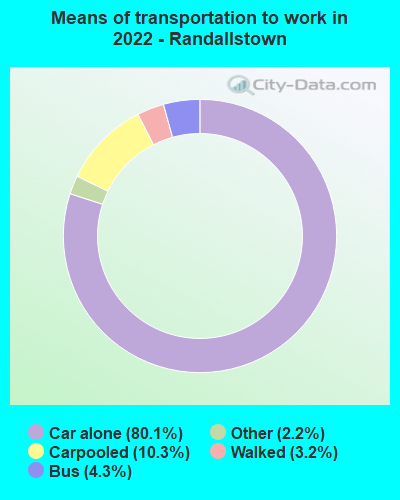
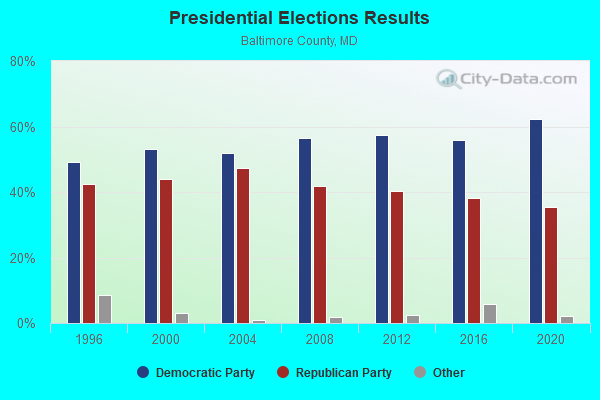
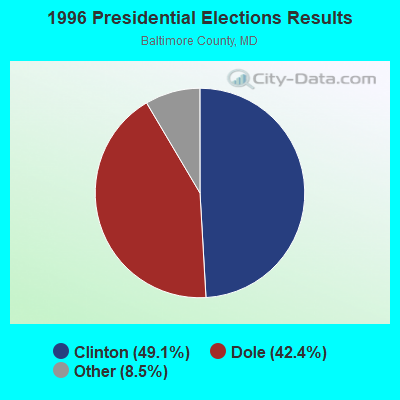
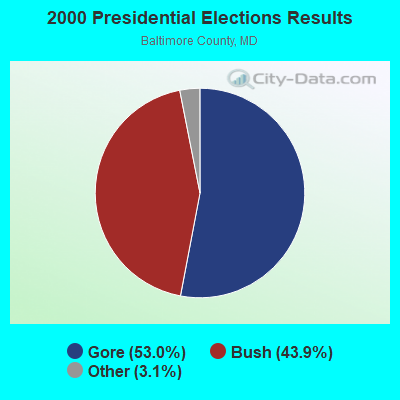
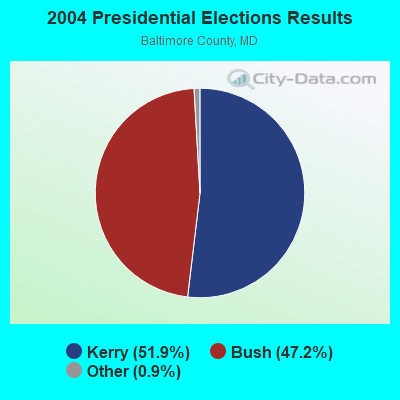

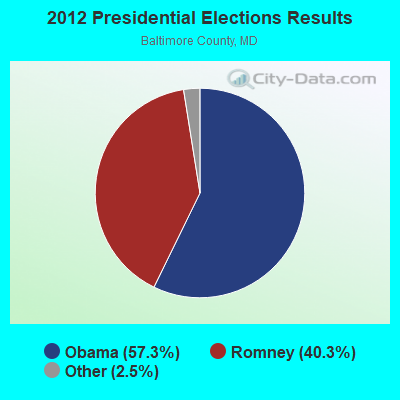
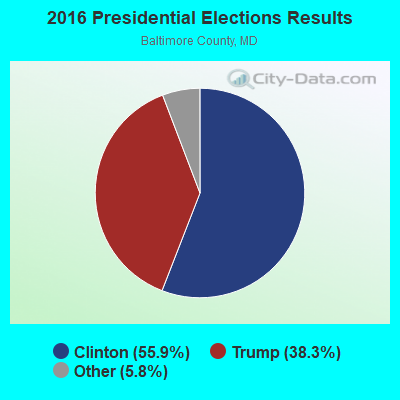
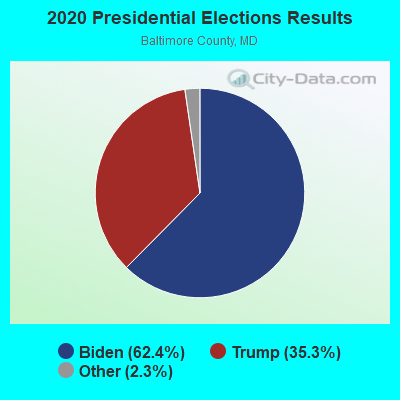
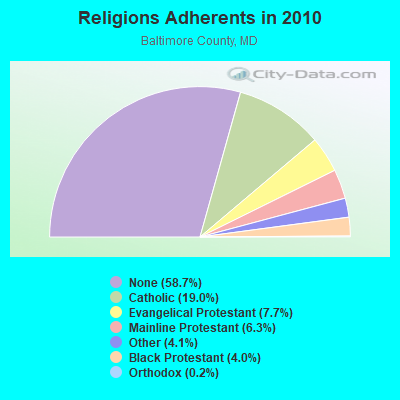
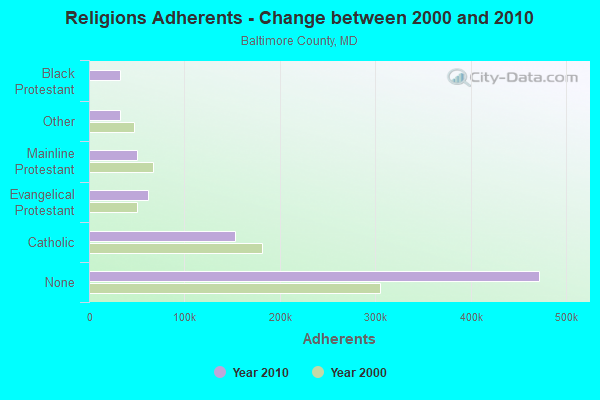
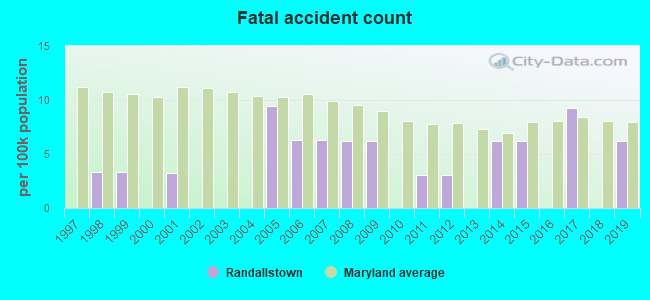
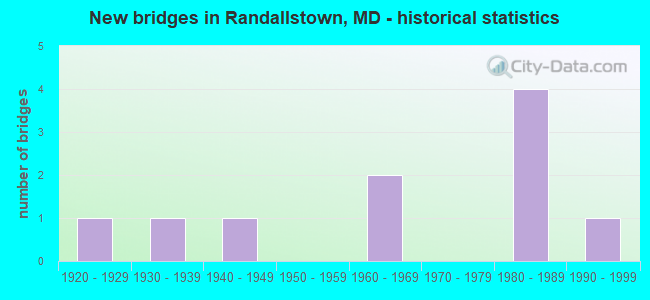
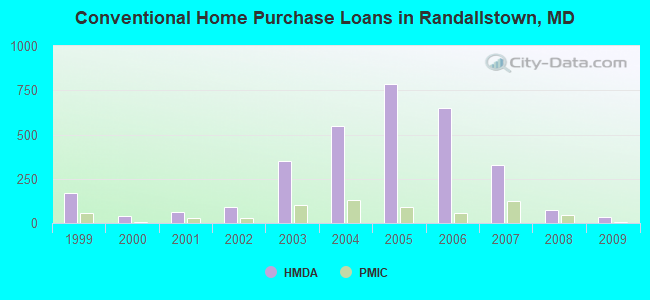
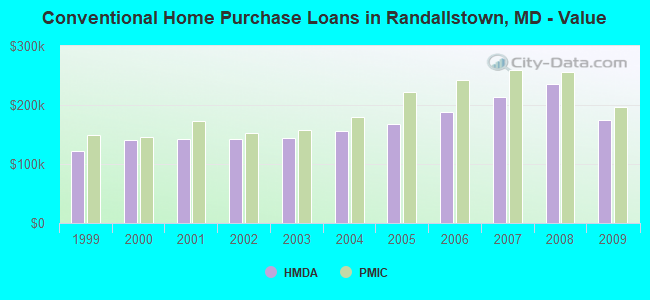
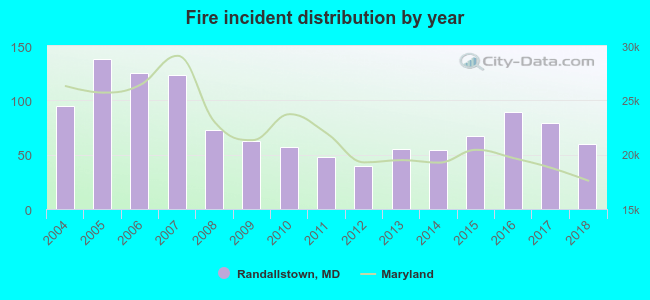 According to the data from the years 2004 - 2018 the average number of fire incidents per year is 78. The highest number of fires - 138 took place in 2005, and the least - 40 in 2012. The data has a declining trend.
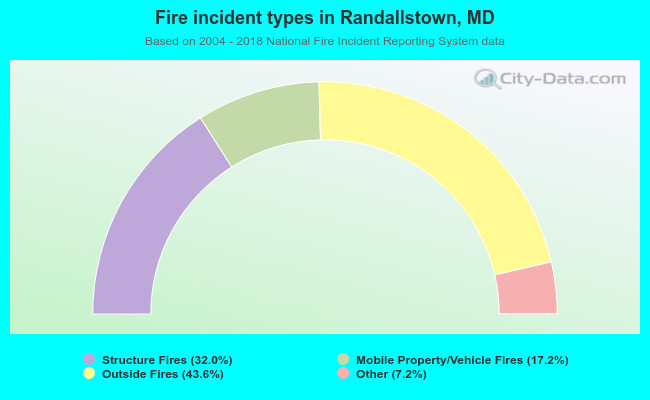 When looking into fire subcategories, the most reports belonged to: Outside Fires (43.6%), and Structure Fires (32.0%).