Estimated zip code population in 2022: 51,044 Zip code population in 2010: 50,846 Zip code population in 2000: 50,154
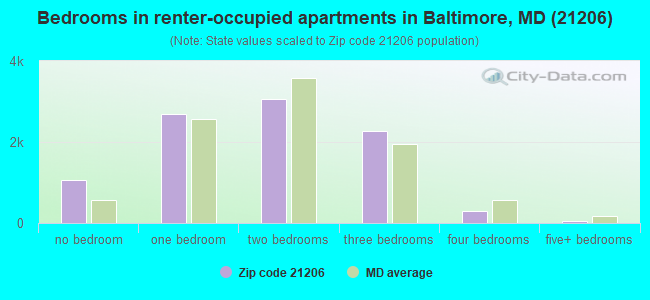
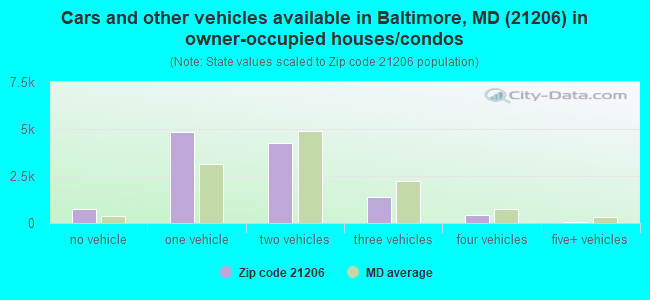
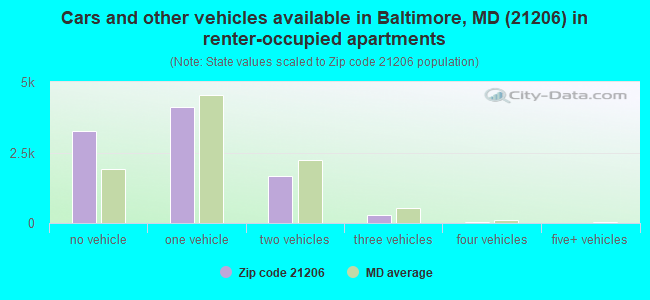
Houses and condos: 22,492 Renter-occupied apartments: 9,383
% of renters here:
45%
State:
32%
March 2022 cost of living index in zip code 21206: 105.0 (near average, U.S. average is 100)
Land area: 7.2 sq. mi. Water area: 0.0 sq. mi.
Population density: 7,081 people per square mile
(high).
OSM Map
General Map
Google Map
MSN Map
OSM Map
General Map
Google Map
MSN Map
OSM Map
General Map
Google Map
MSN Map
OSM Map
General Map
Google Map
MSN Map
Please wait while loading the map...
Real estate property taxes paid for housing units in 2022:
This zip code:
1.4% ($2,873)
Maryland:
0.9% ($3,777)
Median real estate property taxes paid for housing units with mortgages in 2022: $2,958 (1.4%) Median real estate property taxes paid for housing units with no mortgage in 2022: $2,658 (1.5%)
Averages for the 2020 tax year for zip code 21206, filed in 2021:
Average Adjusted Gross Income (AGI) in 2020: $43,537 (Individual Income Tax Returns)
Here:
$43,537
State:
$86,905
Salary/wage: $41,705 (reported on 86.4% of returns)
Here:
$41,705
State:
$73,953
(% of AGI for various income ranges: 1185.5% for AGIs below $25k, 3915.3% for AGIs $25k-50k, 7322.7% for AGIs $50k-75k, 10778.6% for AGIs $75k-100k, 18925.8% for AGIs $100k-200k, 51672.5% for AGIs over 200k)
Taxable interest for individuals: $496 (reported on 18.7% of returns)
This zip code:
$496
Maryland:
$1,528
(% of AGI for various income ranges: 4.8% for AGIs below $25k, 5.4% for AGIs $25k-50k, 15.1% for AGIs $50k-75k, 37.4% for AGIs $75k-100k, 63.2% for AGIs $100k-200k, 167.5% for AGIs over 200k)
Ordinary dividends: $1,774 (reported on 5.5% of returns)
Here:
$1,774
State:
$8,028
(% of AGI for various income ranges: 4.4% for AGIs below $25k, 6.0% for AGIs $25k-50k, 14.5% for AGIs $50k-75k, 25.6% for AGIs $75k-100k, 78.7% for AGIs $100k-200k, 525.0% for AGIs over 200k)
Net capital gain/loss in AGI: +$4,642 (reported on 4.6% of returns)
Here:
+$4,642
State:
+$25,238
(% of AGI for various income ranges: 3.1% for AGIs below $25k, 6.3% for AGIs $25k-50k, 16.0% for AGIs $50k-75k, 29.9% for AGIs $75k-100k, 179.0% for AGIs $100k-200k, 5142.5% for AGIs over 200k)
Profit/loss from business: +$1,114 (reported on 16.4% of returns)
Here:
+$1,114
State:
+$11,398
(% of AGI for various income ranges: 50.4% for AGIs below $25k, 47.5% for AGIs $75k-100k, 61.6% for AGIs $100k-200k, 1392.5% for AGIs over 200k)
Taxable individual retirement arrangement distribution: $11,051 (reported on 3.8% of returns)
21206:
$11,051
Maryland:
$20,944
(% of AGI for various income ranges: 17.3% for AGIs below $25k, 33.1% for AGIs $25k-50k, 74.8% for AGIs $50k-75k, 137.3% for AGIs $75k-100k, 323.4% for AGIs $100k-200k)
Total itemized deductions: $22,994 (reported on 12.8% of returns)
Here:
$22,994
State:
$30,672
(% of AGI for various income ranges: 45.0% for AGIs below $25k, 234.1% for AGIs $25k-50k, 695.8% for AGIs $50k-75k, 1203.8% for AGIs $75k-100k, 1769.9% for AGIs $100k-200k, 4602.5% for AGIs over 200k)
Charity contributions: $7,528 (reported on 10.7% of returns)
Here:
$7,528
State:
$9,065
(% of AGI for various income ranges: 5.3% for AGIs below $25k, 56.2% for AGIs $25k-50k, 187.6% for AGIs $50k-75k, 320.9% for AGIs $75k-100k, 559.9% for AGIs $100k-200k, 2187.5% for AGIs over 200k)
Taxes paid: $7,246 (reported on 12.7% of returns)
21206:
$7,246
State:
$8,475
(% of AGI for various income ranges: 9.6% for AGIs below $25k, 59.3% for AGIs $25k-50k, 225.3% for AGIs $50k-75k, 430.5% for AGIs $75k-100k, 593.8% for AGIs $100k-200k, 1257.5% for AGIs over 200k)
Earned income credit: $2,345 (reported on 25.1% of returns)
Here:
$2,345
State:
$2,151
(% of AGI for various income ranges: 128.8% for AGIs below $25k, 85.9% for AGIs $25k-50k, 0.7% for AGIs $50k-75k)
Percentage of individuals using paid preparers for their 2020 taxes: 91.5%
Here:
91%
State:
90%
(% for various income ranges: 92.1% for AGIs below $25k, 92.6% for AGIs $25k-50k, 89.7% for AGIs $50k-75k, 89.6% for AGIs $75k-100k, 88.9% for AGIs $100k-200k, 90.9% for AGIs over 200k)
Averages for the 2012 tax year for zip code 21206, filed in 2013:
Average Adjusted Gross Income (AGI) in 2012: $38,368 (Individual Income Tax Returns)
Here:
$38,368
State:
$72,703
Salary/wage: $37,378 (reported on 88.7% of returns)
Here:
$37,378
State:
$62,228
(% of AGI for various income ranges: 82.2% for AGIs below $25k, 91.7% for AGIs $25k-50k, 86.2% for AGIs $50k-75k, 84.4% for AGIs $75k-100k, 84.8% for AGIs $100k-200k, 56.1% for AGIs over 200k)
Taxable interest for individuals: $542 (reported on 24.6% of returns)
This zip code:
$542
Maryland:
$1,413
(% of AGI for various income ranges: 0.5% for AGIs below $25k, 0.3% for AGIs $25k-50k, 0.4% for AGIs $50k-75k, 0.3% for AGIs $75k-100k, 0.3% for AGIs $100k-200k, 2.5% for AGIs over 200k)
Ordinary dividends: $1,668 (reported on 7.1% of returns)
Here:
$1,668
State:
$6,933
(% of AGI for various income ranges: 0.4% for AGIs below $25k, 0.2% for AGIs $25k-50k, 0.3% for AGIs $50k-75k, 0.3% for AGIs $75k-100k, 0.5% for AGIs $100k-200k)
Net capital gain/loss in AGI: +$1,115 (reported on 4.1% of returns)
Here:
+$1,115
State:
+$14,830
(% of AGI for various income ranges: 0.1% for AGIs $50k-75k, 0.2% for AGIs $75k-100k, 0.4% for AGIs $100k-200k)
Taxable individual retirement arrangement distribution: $10,045 (reported on 5.0% of returns)
21206:
$10,045
Maryland:
$17,065
(% of AGI for various income ranges: 1.3% for AGIs below $25k, 0.8% for AGIs $25k-50k, 1.3% for AGIs $50k-75k, 1.7% for AGIs $75k-100k, 2.0% for AGIs $100k-200k)
Total itemized deductions: $18,233 (30% of AGI, reported on 39.0% of returns)
Here:
$18,233
State:
$27,886
Here:
30.3% of AGI
State:
22.8% of AGI
(% of AGI for various income ranges: 9.5% for AGIs below $25k, 17.7% for AGIs $25k-50k, 22.4% for AGIs $50k-75k, 21.7% for AGIs $75k-100k, 19.6% for AGIs $100k-200k, 17.1% for AGIs over 200k)
Charity contributions: $3,656 (reported on 33.1% of returns)
Here:
$3,656
State:
$4,452
(% of AGI for various income ranges: 1.4% for AGIs below $25k, 3.0% for AGIs $25k-50k, 3.9% for AGIs $50k-75k, 3.8% for AGIs $75k-100k, 3.5% for AGIs $100k-200k, 2.3% for AGIs over 200k)
Taxes paid: $6,025 (reported on 38.8% of returns)
21206:
$6,025
State:
$11,690
(% of AGI for various income ranges: 1.9% for AGIs below $25k, 4.7% for AGIs $25k-50k, 7.5% for AGIs $50k-75k, 8.1% for AGIs $75k-100k, 8.4% for AGIs $100k-200k, 9.3% for AGIs over 200k)
Earned income credit: $2,389 (reported on 29.4% of returns)
Here:
$2,389
State:
$2,199
(% of AGI for various income ranges: 10.0% for AGIs below $25k, 1.4% for AGIs $25k-50k)
Percentage of individuals using paid preparers for their 2012 taxes: 49.0%
Here:
49%
State:
52%
(% for various income ranges: 49.6% for AGIs below $25k, 47.0% for AGIs $25k-50k, 49.6% for AGIs $50k-75k, 52.2% for AGIs $75k-100k, 51.8% for AGIs $100k-200k, 60.0% for AGIs over 200k)
Averages for the 2004 tax year for zip code 21206, filed in 2005:
Average Adjusted Gross Income (AGI) in 2004: $33,046 (Individual Income Tax Returns)
Here:
$33,046
State:
$60,339
Salary/wage: $32,271 (reported on 90.4% of returns)
Here:
$32,271
State:
$52,211
(% of AGI for various income ranges: 95.7% for AGIs below $10k, 85.9% for AGIs $10k-25k, 91.4% for AGIs $25k-50k, 88.5% for AGIs $50k-75k, 87.7% for AGIs $75k-100k, 78.6% for AGIs over 100k)
Taxable interest for individuals: $996 (reported on 29.0% of returns)
This zip code:
$996
Maryland:
$1,701
(% of AGI for various income ranges: 2.1% for AGIs below $10k, 1.1% for AGIs $10k-25k, 0.7% for AGIs $25k-50k, 0.7% for AGIs $50k-75k, 0.8% for AGIs $75k-100k, 1.5% for AGIs over 100k)
Taxable dividends: $1,424 (reported on 9.5% of returns)
Here:
$1,424
State:
$4,235
(% of AGI for various income ranges: 0.9% for AGIs below $10k, 0.4% for AGIs $10k-25k, 0.3% for AGIs $25k-50k, 0.3% for AGIs $50k-75k, 0.6% for AGIs $75k-100k, 0.7% for AGIs over 100k)
Net capital gain/loss: +$3,746 (reported on 6.0% of returns)
Here:
+$3,746
State:
+$15,888
(% of AGI for various income ranges: -0.1% for AGIs below $10k, 0.1% for AGIs $10k-25k, 0.1% for AGIs $25k-50k, 0.3% for AGIs $50k-75k, 0.7% for AGIs $75k-100k, 4.6% for AGIs over 100k)
Profit/loss from business: +$2,796 (reported on 10.4% of returns)
Here:
+$2,796
State:
+$12,221
(% of AGI for various income ranges: 3.5% for AGIs below $10k, 2.0% for AGIs $10k-25k, 0.2% for AGIs $25k-50k, 0.9% for AGIs $50k-75k, 0.8% for AGIs $75k-100k, 1.0% for AGIs over 100k)
IRA payment deduction: $2,296 (reported on 1.8% of returns)
21206:
$2,296
Maryland:
$2,968
(% of AGI for various income ranges: 0.1% for AGIs below $10k, 0.1% for AGIs $10k-25k, 0.1% for AGIs $25k-50k, 0.1% for AGIs $50k-75k, 0.1% for AGIs $75k-100k, 0.1% for AGIs over 100k)
Self-employed pension: $5,045 (reported on 0.1% of returns)
Here:
$5,045
Maryland:
$17,155
Total itemized deductions: $15,579 (30% of AGI, reported on 40.0% of returns)
Here:
$15,579
State:
$22,960
Here:
30.4% of AGI
State:
23.3% of AGI
(% of AGI for various income ranges: 10.7% for AGIs below $10k, 10.4% for AGIs $10k-25k, 20.2% for AGIs $25k-50k, 22.3% for AGIs $50k-75k, 21.2% for AGIs $75k-100k, 17.9% for AGIs over 100k)
Charity contributions deductions: $3,199 (6% of AGI, reported on 36.6% of returns)
Here:
$3,199
State:
$4,031
Here:
6.1% of AGI
State:
3.9% of AGI
(% of AGI for various income ranges: 1.0% for AGIs below $10k, 1.7% for AGIs $10k-25k, 3.9% for AGIs $25k-50k, 4.2% for AGIs $50k-75k, 4.2% for AGIs $75k-100k, 3.5% for AGIs over 100k)
Total tax: $3,502 (reported on 66.3% of returns)
21206:
$3,502
State:
$10,167
(% of AGI for various income ranges: 2.3% for AGIs below $10k, 2.9% for AGIs $10k-25k, 5.4% for AGIs $25k-50k, 8.3% for AGIs $50k-75k, 9.6% for AGIs $75k-100k, 14.2% for AGIs over 100k)
Earned income credit: $1,794 (reported on 27.2% of returns)
Here:
$1,794
State:
$1,700
Percentage of individuals using paid preparers for their 2004 taxes: 56.7%
Here:
57%
State:
55%
(% for various income ranges: 51.4% for AGIs below $10k, 60.7% for AGIs $10k-25k, 55.7% for AGIs $25k-50k, 56.1% for AGIs $50k-75k, 58.1% for AGIs $75k-100k, 59.2% for AGIs over 100k)
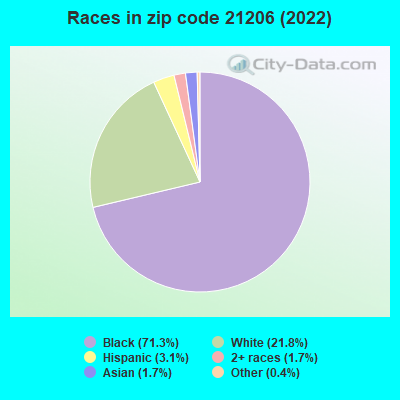
Likely homosexual households (counted as self-reported same-sex unmarried-partner households)
Lesbian couples: 0.1% of all households
Gay men: 0.1% of all households
Household received Food Stamps/SNAP in the past 12 months: 5,261 Household did not receive Food Stamps/SNAP in the past 12 months: 16,011
Women who had a birth in the past 12 months: 525 (165 now married, 355 unmarried) Women who did not have a birth in the past 12 months: 13,027 (3,489 now married, 9,535 unmarried)
Housing units in zip code 21206 with a mortgage: 8,582 (468 second mortgage, 7 home equity loan, 384 both second mortgage and home equity loan) Houses without a mortgage: 144
Median monthly owner costs for units with a mortgage: $1,431 Median monthly owner costs for units without a mortgage: $581
Residents with income below the poverty level in 2022:
This zip code:
13.1%
Whole state:
9.6%
Residents with income below 50% of the poverty level in 2022:
This zip code:
5.7%
Whole state:
4.7%
Median number of rooms in houses and condos:
Here:
6.8
State:
7.3
Median number of rooms in apartments:
Here:
4.0
State:
4.2
Notable locations in this zip code not listed on our city pages
Notable locations in zip code 21206: Gardenville Swim Club (A), Newcomer Hall (B), Gardenville Branch Enoch Pratt Free Library (C), Baltimore City Fire Station 41 Engine 54 (D), Baltimore City Fire Station 13 Engine 27 (E), Saint Catherine Laboure Hall (F). Display/hide their locations on the map
Shopping Centers: Belford Shopping Center (1), Cedonia Shopping Center (2), Frankford Gardens Shopping Center (3), Frankford Plaza Shopping Center (4), Parkside Shopping Center (5). Display/hide their locations on the map
Churches in zip code 21206 include: Saint James Evangelical Lutheran Church (A), Saint Michaels Roman Catholic Church (B), Apostolic Church of Baltimore (C), Abundant Life Christian Church (D), Bethlehem Baptist Church (E), Called Out Gospel Church (F), Baltimore Chinese Baptist Church (G), Berean Bible Church (H), Christ Church Ministries (I). Display/hide their locations on the map
Parks in zip code 21206 include: Belmar Park (1), Cedonia Park (2), Gardenvillage Park (3), Hazelwood Park (4), Holt Park (5), Herring Run Park (6), Moore Run Park (7), Radecke Playfield (8), Burdick Park (9). Display/hide their locations on the map
3,768 married couples with children.
5,210 single-parent households (1,136 men, 4,074 women).
90.5% of residents of 21206 zip code speak English at home.
2.0% of residents speak Spanish at home (43% very well, 31% well, 27% not well).
2.0% of residents speak other Indo-European language at home (51% very well, 18% well, 27% not well, 4% not at all).
0.6% of residents speak Asian or Pacific Island language at home (79% very well, 10% well, 8% not well, 3% not at all).
4.1% of residents speak other language at home (42% very well, 14% well, 39% not well, 5% not at all).
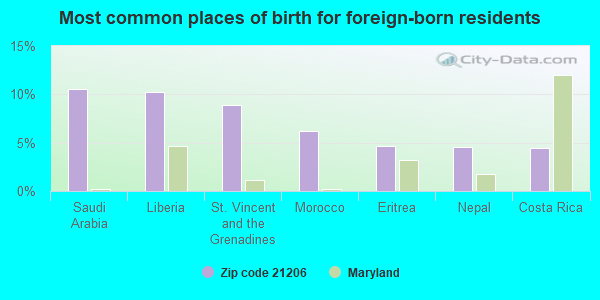
Foreign born population: 4,593 (9.0%) (42.5% of them are naturalized citizens)
Major facilities with environmental interests located in this zip code:
MCCORMICK ELEMENTARY SCHOOL (5101 HAZLEWOOD AVENUE in BALTIMORE, MD)
AIR MINOR (AIRS/AFS) STATE MASTER (Maryland Air Emissions Database) - AIR MINOR (National Center for Education Statistics) - STATE ID-031403 Small Quantity Generators, between 100 kg and 1000 kg of hazardous waste/month (Resource Conservation and Recovery Act (tracking hazardous waste)) - notification Business SIC classification: ELEMENTARY AND SECONDARY SCHOOLS Organizations: BALTO COUNTY BOARD OF ED (CONTACT/OWNER)
, BALTIMORE COUNTY PUBLIC SCHOOLS (SCHOOL DISTRICT)
ELMWOOD ELEMENTARY SCHOOL (531 DALE AVENUE in BALTIMORE, MD)
AIR MINOR (AIRS/AFS) STATE MASTER (Maryland Air Emissions Database) - AIR MINOR (National Center for Education Statistics) - STATE ID-031405 Business SIC classification: ELEMENTARY AND SECONDARY SCHOOLS Organizations: BALTIMORE COUNTY PUBLIC SCHOOLS (SCHOOL DISTRICT)
Alternative names: ELMWOOD ELEM SCHL
MORNING PARK PRIMARY CNTR ES 105 (6201 FRANKFORD AVENUE in BALTIMORE, MD)
AIR MINOR (AIRS/AFS) STATE MASTER (Maryland Air Emissions Database) - AIR MINOR (National Center for Education Statistics) - STATE ID-300105 Business SIC classification: ELEMENTARY AND SECONDARY SCHOOLS Organizations: BALTIMORE CITY PUBLIC SCHOOLS (SCHOOL DISTRICT)
EXXON 6300 BELAIR ROAD (6300 BELAIR ROAD in BALTIMORE, MD)
AIR MINOR (AIRS/AFS) STATE MASTER (Maryland Air Emissions Database) - AIR MINOR Conditionally Exempt Small Quantity Generators, less than 100 kg/month of hazardous waste (Resource Conservation and Recovery Act (tracking hazardous waste)) - notification Business SIC classification: GASOLINE SERVICE STATIONS Organizations: OPERNAME (CONTACT/OPERATOR)
, EXXON MOBIL (CONTACT/OWNER)
Alternative names: EXXON CO USA #25576, EXXON RAS #25576, GLENMORE SERVICE CENTER
PERRY HALL CLEANERS (6705 BELAIR ROAD in BALTIMORE, MD)
AIR MINOR (AIRS/AFS) STATE MASTER (Maryland Air Emissions Database) - AIR MINOR Small Quantity Generators, between 100 kg and 1000 kg of hazardous waste/month (Resource Conservation and Recovery Act (tracking hazardous waste)) - notification Business SIC classification: DRYCLEANING PLANTS, EXCEPT RUG CLEANING Organizations: OPERNAME (CONTACT/OPERATOR)
, CAPOBIANCO, RONALD M (CONTACT/OWNER)
OVERLEA HIGH SCHOOL (5401 KENWOOD AVE in BALTIMORE, MD)
AIR MINOR (AIRS/AFS) STATE MASTER (Maryland Air Emissions Database) - AIR MINOR Small Quantity Generators, between 100 kg and 1000 kg of hazardous waste/month (Resource Conservation and Recovery Act (tracking hazardous waste)) - notification Business SIC classification: ELEMENTARY AND SECONDARY SCHOOLS Organizations: BALTO COUNTY BOARD OF ED (CONTACT/OWNER)
Alternative names: OVERLEA SENIOR HIGH SCHOOL
OVERLEA DRY CLEANING (6618 BELAIR ROAD in BALTIMORE, MD)
AIR MINOR (AIRS/AFS) STATE MASTER (Maryland Air Emissions Database) - AIR MINOR Conditionally Exempt Small Quantity Generators, less than 100 kg/month of hazardous waste (Resource Conservation and Recovery Act (tracking hazardous waste)) - notification Business SIC classification: DRYCLEANING PLANTS, EXCEPT RUG CLEANING Organizations: KIM JI (CONTACT/OWNER)
Alternative names: OVERLEA CLNRS
BETHLEHEM EVANGELICAL LUTHERAN CHRCH (4815 HAMILTON AVENUE in BALTIMORE, MD)
AIR MINOR (AIRS/AFS) STATE MASTER (Maryland Air Emissions Database) - AIR MINOR COMPLIANCE ACTIVITY (Tracking inspections of insecticide, fungicide, and rodenticide, and toxic substances) Business SIC classification: RELIGIOUS ORGANIZATIONS Alternative names: BETHLEHEM CHRISTIAN DAY SCHOOL
NORTHEAST MIDDLE (5001 MORAVIA RD in BALTIMORE, MD)
ENFORCEMENT/COMPLIANCE ACTIVITY (Integrated Compliance Information System) (National Center for Education Statistics) - STATE ID-300049 Small Quantity Generators, between 100 kg and 1000 kg of hazardous waste/month (Resource Conservation and Recovery Act (tracking hazardous waste)) - notification Organizations: BALTIMORE CITY PUBLIC SCHOOLS (CONTACT/OWNER)
Alternative names: NORTHEAST MIDDLE SCHOOL
AMOCO 5921 MORAVIA ROAD (5921 MORAVIA ROAD in BALTIMORE, MD)
AIR MINOR (AIRS/AFS) STATE MASTER (Maryland Air Emissions Database) - AIR MINOR Conditionally Exempt Small Quantity Generators, less than 100 kg/month of hazardous waste (Resource Conservation and Recovery Act (tracking hazardous waste)) - notification Business SIC classification: GASOLINE SERVICE STATIONS Alternative names: MORAVIA INC, MORAVIA BP STATION
BRAEMAR PRESS INCORPORATED (4819 BELAIR ROAD in BALTIMORE, MD)
AIR MINOR (AIRS/AFS) STATE MASTER (Maryland Air Emissions Database) - AIR MINOR Business SIC classification: COMMERCIAL PRINTING, LITHOGRAPHIC
PARKSIDE UNITED METHODIST CHURCH (4400 PARKSIDE DRIVE in BALTIMORE, MD)
AIR MINOR (AIRS/AFS) STATE MASTER (Maryland Air Emissions Database) - AIR MINOR Business SIC classification: RELIGIOUS ORGANIZATIONS
PAUL SCHAFER MEATS (4415 KENWOOD AVENUE in BALTIMORE, MD)
AIR MINOR (AIRS/AFS) STATE MASTER (Maryland Air Emissions Database) - AIR MINOR Business SIC classification: SAUSAGES AND OTHER PREPARED MEAT PRODUCTS Alternative names: SCHAFER, PAUL MEATS
Housing units lacking complete plumbing facilities: 0.7% Housing units lacking complete kitchen facilities: 0.7%
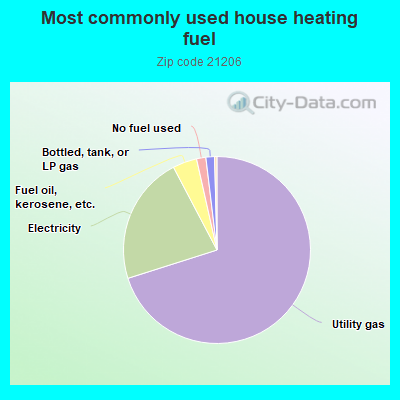
70.1%Utility gas
22.2%Electricity
4.2%Fuel oil, kerosene, etc.
1.6%No fuel used
1.5%Bottled, tank, or LP gas
Population in 1990: 52,114.
Place of birth for U.S.-born residents:
This state: 37,380
Northeast: 2,917
Midwest: 901
South: 4,237
West: 546
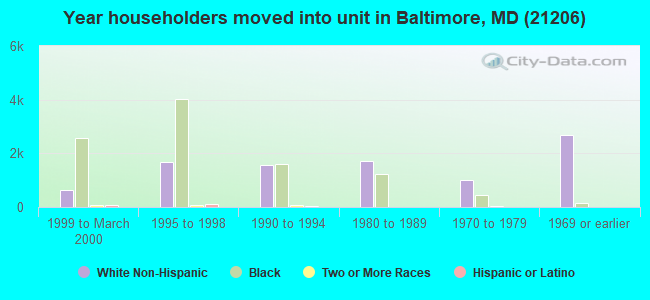
61% of the 21206 zip code residents lived in the same house 5 years ago. Out of people who lived in different houses, 66% lived in this county. Out of people who lived in different counties, 50% lived in Maryland.
93% of the 21206 zip code residents lived in the same house 1 year ago. Out of people who lived in different houses, 54% moved from this county. Out of people who lived in different houses, 35% moved from different county within same state. Out of people who lived in different houses, 9% moved from different state. Out of people who lived in different houses, 7% moved from abroad.
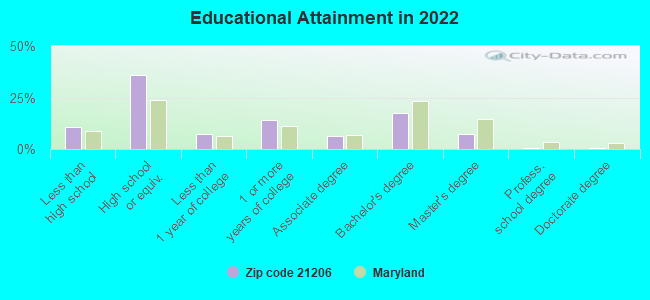
Private vs. public school enrollment:
Students in private schools in grades 1 to 8 (elementary and middle school): 402
Here:
8.2%
Maryland:
15.2%
Students in private schools in grades 9 to 12 (high school): 282
Here:
9.0%
Maryland:
14.4%
Students in private undergraduate colleges: 251
Here:
12.1%
Maryland:
20.2%
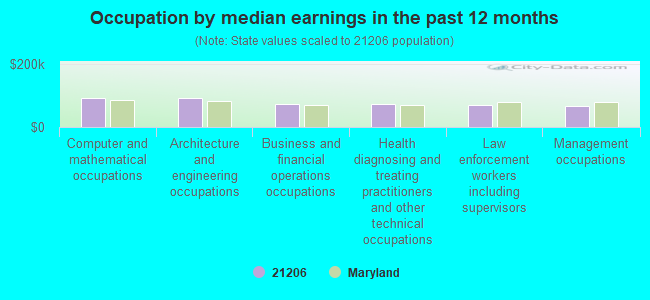
Occupation by median earnings in the past 12 months ($)
92,750Computer and mathematical occupations
91,724Architecture and engineering occupations
73,201Business and financial operations occupations
72,946Health diagnosing and treating practitioners and other technical occupations
70,285Law enforcement workers including supervisors
67,085Management occupations
Companies with federal contracts located in this zip code (BALTIMORE, MD):
PRIMARY ELECTRIC SUPPLY INC (6310 FRANKFORD AVE; small business) : $242,283 in 9 contractsfrom 1999 to 2005
Contracts for Electrical Hardware and Supplies, Engine Electrical System Components, Aircraft Prime Moving by Defense Logistics Agency Signed by year:2000: $88,491; 2001: $0; 2002: $0; 2003: $0; 2004: $49,620; 2005: $59,586; 2006: $0.
Biggest contracts:
$54,808 with Defense Logistics Agency for Electrical Hardware and Supplies. Taking place in IL. Signed on 2000-06-30. Completion date: 2000-08-29.
$44,586, same as above.Signed on 1999-10-10. Completion date: 1999-11-19.
$36,512 with Defense Logistics Agency for Electrical Hardware and Supplies. Signed on 2004-08-20. Completion date: 2004-12-18.
$33,683 with Defense Logistics Agency for Electrical Hardware and Supplies. Taking place in IL. Signed on 2000-11-15. Completion date: 2001-01-14.
DELMARVA MATERIAL HANDLING COM (5716 SEYMOUR AVE; small business) : $60,642 in 2 contractsfrom 2004 to 2005
$50,550 with Defense Logistics Agency for Materials Feeders. Taking place in IA. Signed on 2004-11-12. Completion date: 2004-12-14.
$10,092 with Defense Logistics Agency for Belting, Drive Belts, Fan Belts, and Accessories. Signed on 2005-04-13. Completion date: 2005-05-02.
OVERLEA CATERERS INC (6809 BELAIR RD; small business) : $36,721 in 2 contractsfrom 2003 to 2004
$27,921 with Army for Composite Food Packages. Signed on 2003-02-28. Completion date: 2003-03-06.
$8,800, same as above.Signed on 2004-01-08. Completion date: 2004-01-11.
AQUA-FLO, INC (6244 FRANKFORD AVENUE; small business) : $17,097 in 7 contractsfrom 2001 to 2005
Contracts for Water Distillation Equipment, Marine and Industrial, Maintenance, Repair and Rebuilding of Equipment -- Water Purification and Sewage Treatment Equipment by Army Signed by year:2000: $0; 2001: $9,500; 2002: $3,797; 2003: $3,600; 2004: $3,600; 2005: -$3,400; 2006: $0.
Biggest contracts:
$9,500 with Army for Water Distillation Equipment, Marine and Industrial. Signed on 2001-12-26. Completion date: 2002-03-01.
$3,600 with Army for Maintenance, Repair and Rebuilding of Equipment -- Water Purification and Sewage Treatment Equipment. Signed on 2004-02-10. Completion date: 2004-12-31.
$3,600, same as above.Signed on 2003-02-05. Completion date: 2003-12-31.
$3,600, same as above.Signed on 2002-01-07. Completion date: 2002-09-30.
BUDD ELECTRICAL SERVICE INC (5201 HAMILTON AVE; small business)
$4,860 with Army for Generators and Generators Sets, Electrical. Signed on 2004-02-17. Completion date: 2004-03-31.
RAPID DICTATING AND EQUIPMENT (6905 BELAIR ROAD; small business)
-$2,000 with Army for Maintenance, Repair and Rebuilding of Equipment -- Miscellaneous. Signed on 2004-11-23. Completion date: 2001-09-30.
Top industries in this zip code by the number of employees in 2005:
Health Care and Social Assistance: Nursing Care Facilities (250-499 employees: 1 establishment, 100-249 employees: 1 establishment, 5-9 employees: 1 establishment)
Other Services (except Public Administration): Religious Organizations (100-249: 1, 50-99: 1, 20-49: 1, 10-19: 5, 5-9: 3, 1-4: 12)
2002 - 2018 National Fire Incident Reporting System (NFIRS) incidents
Based on the data from the years 2002 - 2018 the average number of fire incidents per year is 173. The highest number of reported fires - 288 took place in 2007, and the least - 0 in 2003. The data has a decreasing trend.
When looking into fire subcategories, the most incidents belonged to: Structure Fires (45.4%), and Outside Fires (29.5%).
Fire incident types reported to NFIRS in Zip Code 21206


 Nearest zip codes: 21214, 21251, 21237, 21205, 21213, 21234.


 Based on the data from the years 2002 - 2018 the average number of fire incidents per year is 173. The highest number of reported fires - 288 took place in 2007, and the least - 0 in 2003. The data has a decreasing trend.
 When looking into fire subcategories, the most incidents belonged to: Structure Fires (45.4%), and Outside Fires (29.5%).