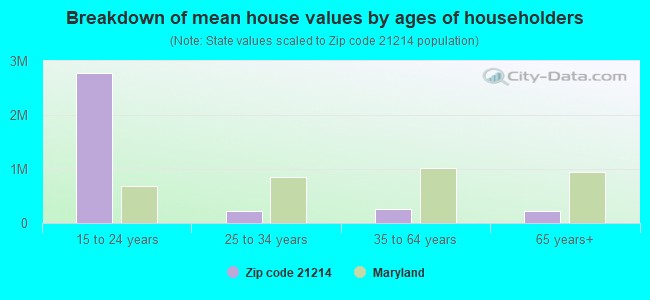
Estimated zip code population in 2022: 21,520 Zip code population in 2010: 20,564 Zip code population in 2000: 21,285
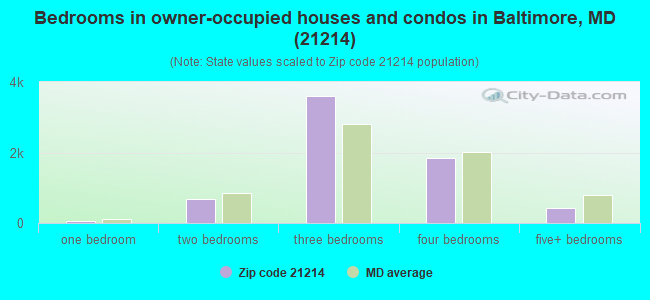
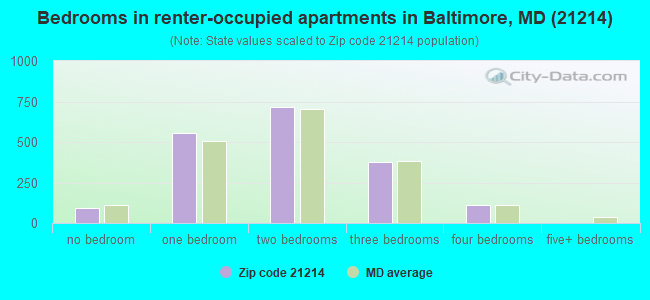
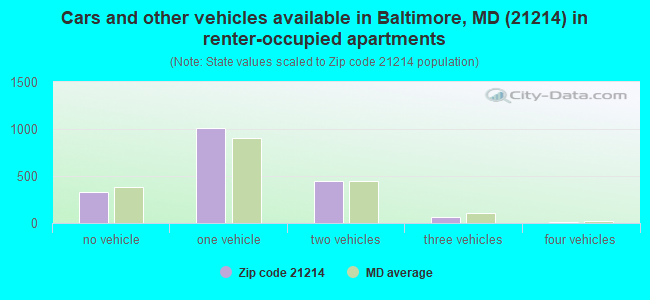
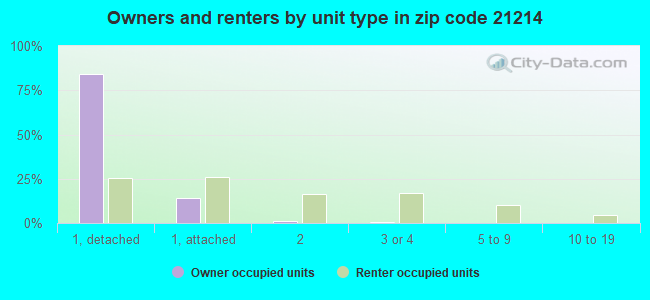
Houses and condos: 9,014 Renter-occupied apartments: 1,863
% of renters here:
22%
State:
32%
March 2022 cost of living index in zip code 21214: 105.0 (near average, U.S. average is 100)
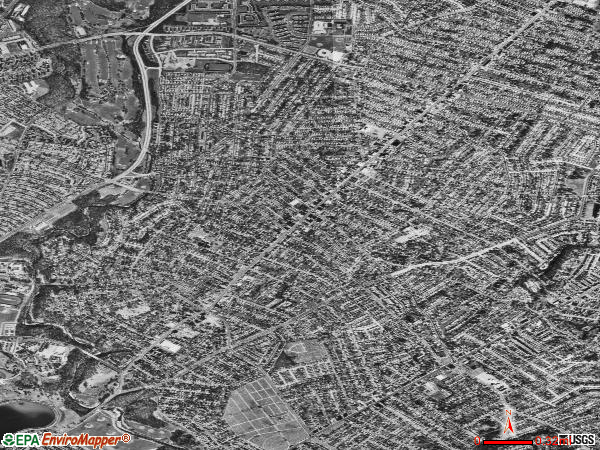
Land area: 2.9 sq. mi. Water area: 0.0 sq. mi.
Population density: 7,537 people per square mile
(high).
OSM Map
General Map
Google Map
MSN Map
OSM Map
General Map
Google Map
MSN Map
OSM Map
General Map
Google Map
MSN Map
OSM Map
General Map
Google Map
MSN Map
Please wait while loading the map...
Real estate property taxes paid for housing units in 2022:
This zip code:
1.4% ($3,432)
Maryland:
0.9% ($3,777)
Median real estate property taxes paid for housing units with mortgages in 2022: $3,432 (1.4%) Median real estate property taxes paid for housing units with no mortgage in 2022: $3,432 (1.5%)
Averages for the 2020 tax year for zip code 21214, filed in 2021:
Average Adjusted Gross Income (AGI) in 2020: $55,881 (Individual Income Tax Returns)
Here:
$55,881
State:
$86,905
Salary/wage: $53,377 (reported on 84.5% of returns)
Here:
$53,377
State:
$73,953
(% of AGI for various income ranges: 1100.6% for AGIs below $25k, 3828.4% for AGIs $25k-50k, 6969.8% for AGIs $50k-75k, 10619.5% for AGIs $75k-100k, 19179.3% for AGIs $100k-200k, 67247.5% for AGIs over 200k)
Taxable interest for individuals: $495 (reported on 28.0% of returns)
This zip code:
$495
Maryland:
$1,528
(% of AGI for various income ranges: 6.6% for AGIs below $25k, 9.8% for AGIs $25k-50k, 26.6% for AGIs $50k-75k, 19.7% for AGIs $75k-100k, 57.5% for AGIs $100k-200k, 242.5% for AGIs over 200k)
Ordinary dividends: $2,533 (reported on 11.2% of returns)
Here:
$2,533
State:
$8,028
(% of AGI for various income ranges: 12.7% for AGIs below $25k, 14.9% for AGIs $25k-50k, 36.8% for AGIs $50k-75k, 48.9% for AGIs $75k-100k, 128.4% for AGIs $100k-200k, 945.0% for AGIs over 200k)
Net capital gain/loss in AGI: +$5,343 (reported on 9.1% of returns)
Here:
+$5,343
State:
+$25,238
(% of AGI for various income ranges: 1.8% for AGIs below $25k, 11.9% for AGIs $25k-50k, 19.3% for AGIs $50k-75k, 77.9% for AGIs $75k-100k, 236.6% for AGIs $100k-200k, 4450.0% for AGIs over 200k)
Profit/loss from business: +$5,368 (reported on 19.8% of returns)
Here:
+$5,368
State:
+$11,398
(% of AGI for various income ranges: 111.5% for AGIs below $25k, 88.9% for AGIs $25k-50k, 87.3% for AGIs $50k-75k, 193.3% for AGIs $75k-100k, 376.2% for AGIs $100k-200k, 1792.5% for AGIs over 200k)
Taxable individual retirement arrangement distribution: $12,659 (reported on 5.6% of returns)
21214:
$12,659
Maryland:
$20,944
(% of AGI for various income ranges: 30.3% for AGIs below $25k, 49.9% for AGIs $25k-50k, 132.5% for AGIs $50k-75k, 175.2% for AGIs $75k-100k, 311.2% for AGIs $100k-200k)
Self-employed (Keogh) retirement plans: $11,300 (reported on 0.2% of returns)
21214:
$11,300
Maryland:
$29,558
(% of AGI for various income ranges: 11.5% for AGIs $25k-50k)
Total itemized deductions: $22,953 (reported on 16.3% of returns)
Here:
$22,953
State:
$30,672
(% of AGI for various income ranges: 38.4% for AGIs below $25k, 249.0% for AGIs $25k-50k, 731.3% for AGIs $50k-75k, 1225.2% for AGIs $75k-100k, 1447.8% for AGIs $100k-200k, 3770.0% for AGIs over 200k)
Charity contributions: $7,076 (reported on 13.3% of returns)
Here:
$7,076
State:
$9,065
(% of AGI for various income ranges: 4.8% for AGIs below $25k, 61.9% for AGIs $25k-50k, 157.0% for AGIs $50k-75k, 264.5% for AGIs $75k-100k, 423.7% for AGIs $100k-200k, 1652.5% for AGIs over 200k)
Taxes paid: $7,798 (reported on 16.3% of returns)
21214:
$7,798
State:
$8,475
(% of AGI for various income ranges: 8.8% for AGIs below $25k, 66.0% for AGIs $25k-50k, 251.4% for AGIs $50k-75k, 449.0% for AGIs $75k-100k, 523.4% for AGIs $100k-200k, 1135.0% for AGIs over 200k)
Earned income credit: $2,130 (reported on 17.9% of returns)
Here:
$2,130
State:
$2,151
(% of AGI for various income ranges: 103.1% for AGIs below $25k, 73.4% for AGIs $25k-50k)
Percentage of individuals using paid preparers for their 2020 taxes: 90.5%
Here:
90%
State:
90%
(% for various income ranges: 90.4% for AGIs below $25k, 91.5% for AGIs $25k-50k, 90.7% for AGIs $50k-75k, 87.0% for AGIs $75k-100k, 90.9% for AGIs $100k-200k, 92.3% for AGIs over 200k)
Averages for the 2012 tax year for zip code 21214, filed in 2013:
Average Adjusted Gross Income (AGI) in 2012: $46,685 (Individual Income Tax Returns)
Here:
$46,685
State:
$72,703
Salary/wage: $45,500 (reported on 86.3% of returns)
Here:
$45,500
State:
$62,228
(% of AGI for various income ranges: 73.7% for AGIs below $25k, 86.1% for AGIs $25k-50k, 86.3% for AGIs $50k-75k, 86.4% for AGIs $75k-100k, 84.0% for AGIs $100k-200k, 76.3% for AGIs over 200k)
Taxable interest for individuals: $480 (reported on 32.9% of returns)
This zip code:
$480
Maryland:
$1,413
(% of AGI for various income ranges: 0.6% for AGIs below $25k, 0.3% for AGIs $25k-50k, 0.3% for AGIs $50k-75k, 0.4% for AGIs $75k-100k, 0.3% for AGIs $100k-200k, 0.2% for AGIs over 200k)
Ordinary dividends: $2,307 (reported on 12.2% of returns)
Here:
$2,307
State:
$6,933
(% of AGI for various income ranges: 0.8% for AGIs below $25k, 0.5% for AGIs $25k-50k, 0.5% for AGIs $50k-75k, 0.4% for AGIs $75k-100k, 0.9% for AGIs $100k-200k, 0.4% for AGIs over 200k)
Net capital gain/loss in AGI: +$720 (reported on 8.0% of returns)
Here:
+$720
State:
+$14,830
(% of AGI for various income ranges: 0.2% for AGIs $50k-75k, 0.2% for AGIs $75k-100k, 0.3% for AGIs $100k-200k)
Profit/loss from business: +$5,505 (reported on 18.0% of returns)
Here:
+$5,505
State:
+$12,606
(% of AGI for various income ranges: 9.0% for AGIs below $25k, 0.9% for AGIs $25k-50k, 0.9% for AGIs $50k-75k, 1.2% for AGIs $75k-100k, 2.5% for AGIs $100k-200k)
Taxable individual retirement arrangement distribution: $9,337 (reported on 6.4% of returns)
21214:
$9,337
Maryland:
$17,065
(% of AGI for various income ranges: 2.1% for AGIs below $25k, 1.0% for AGIs $25k-50k, 1.1% for AGIs $50k-75k, 1.4% for AGIs $75k-100k, 1.5% for AGIs $100k-200k)
Self-employment retirement plans: $8,850 (reported on 0.2% of returns)
21214:
$8,850
Maryland:
$24,439
Total itemized deductions: $18,865 (27% of AGI, reported on 46.7% of returns)
Here:
$18,865
State:
$27,886
Here:
26.6% of AGI
State:
22.8% of AGI
(% of AGI for various income ranges: 11.0% for AGIs below $25k, 17.8% for AGIs $25k-50k, 22.0% for AGIs $50k-75k, 21.2% for AGIs $75k-100k, 18.9% for AGIs $100k-200k, 14.8% for AGIs over 200k)
Charity contributions: $3,330 (reported on 39.8% of returns)
Here:
$3,330
State:
$4,452
(% of AGI for various income ranges: 1.4% for AGIs below $25k, 2.7% for AGIs $25k-50k, 3.4% for AGIs $50k-75k, 3.1% for AGIs $75k-100k, 2.9% for AGIs $100k-200k, 2.0% for AGIs over 200k)
Taxes paid: $7,319 (reported on 46.6% of returns)
21214:
$7,319
State:
$11,690
(% of AGI for various income ranges: 2.8% for AGIs below $25k, 5.4% for AGIs $25k-50k, 8.0% for AGIs $50k-75k, 8.7% for AGIs $75k-100k, 8.9% for AGIs $100k-200k, 8.1% for AGIs over 200k)
Earned income credit: $2,242 (reported on 21.4% of returns)
Here:
$2,242
State:
$2,199
(% of AGI for various income ranges: 8.1% for AGIs below $25k, 1.0% for AGIs $25k-50k)
Percentage of individuals using paid preparers for their 2012 taxes: 47.9%
Here:
48%
State:
52%
(% for various income ranges: 45.4% for AGIs below $25k, 46.1% for AGIs $25k-50k, 50.6% for AGIs $50k-75k, 53.3% for AGIs $75k-100k, 51.2% for AGIs $100k-200k, 60.0% for AGIs over 200k)
Averages for the 2004 tax year for zip code 21214, filed in 2005:
Average Adjusted Gross Income (AGI) in 2004: $38,613 (Individual Income Tax Returns)
Here:
$38,613
State:
$60,339
Salary/wage: $38,035 (reported on 88.3% of returns)
Here:
$38,035
State:
$52,211
(% of AGI for various income ranges: 87.1% for AGIs below $10k, 80.5% for AGIs $10k-25k, 89.8% for AGIs $25k-50k, 88.8% for AGIs $50k-75k, 87.0% for AGIs $75k-100k, 82.7% for AGIs over 100k)
Taxable interest for individuals: $954 (reported on 38.9% of returns)
This zip code:
$954
Maryland:
$1,701
(% of AGI for various income ranges: 3.3% for AGIs below $10k, 1.6% for AGIs $10k-25k, 0.8% for AGIs $25k-50k, 0.8% for AGIs $50k-75k, 0.7% for AGIs $75k-100k, 1.1% for AGIs over 100k)
Taxable dividends: $1,507 (reported on 14.9% of returns)
Here:
$1,507
State:
$4,235
(% of AGI for various income ranges: 1.7% for AGIs below $10k, 0.9% for AGIs $10k-25k, 0.4% for AGIs $25k-50k, 0.4% for AGIs $50k-75k, 0.5% for AGIs $75k-100k, 0.9% for AGIs over 100k)
Net capital gain/loss: +$3,436 (reported on 10.4% of returns)
Here:
+$3,436
State:
+$15,888
(% of AGI for various income ranges: -0.9% for AGIs below $10k, 0.3% for AGIs $10k-25k, 0.2% for AGIs $25k-50k, 0.4% for AGIs $50k-75k, 0.7% for AGIs $75k-100k, 4.2% for AGIs over 100k)
Profit/loss from business: +$4,624 (reported on 14.7% of returns)
Here:
+$4,624
State:
+$12,221
(% of AGI for various income ranges: 7.5% for AGIs below $10k, 3.5% for AGIs $10k-25k, 0.8% for AGIs $25k-50k, 0.7% for AGIs $50k-75k, 2.1% for AGIs $75k-100k, 3.0% for AGIs over 100k)
IRA payment deduction: $2,328 (reported on 2.5% of returns)
21214:
$2,328
Maryland:
$2,968
(% of AGI for various income ranges: 0.6% for AGIs below $10k, 0.2% for AGIs $10k-25k, 0.2% for AGIs $25k-50k, 0.1% for AGIs $50k-75k, 0.1% for AGIs $75k-100k, 0.1% for AGIs over 100k)
Self-employed pension: $5,750 (reported on 0.3% of returns)
Here:
$5,750
Maryland:
$17,155
Total itemized deductions: $15,720 (28% of AGI, reported on 48.3% of returns)
Here:
$15,720
State:
$22,960
Here:
27.8% of AGI
State:
23.3% of AGI
(% of AGI for various income ranges: 9.6% for AGIs below $10k, 14.6% for AGIs $10k-25k, 21.6% for AGIs $25k-50k, 22.0% for AGIs $50k-75k, 19.9% for AGIs $75k-100k, 16.7% for AGIs over 100k)
Charity contributions deductions: $3,056 (5% of AGI, reported on 43.6% of returns)
Here:
$3,056
State:
$4,031
Here:
5.3% of AGI
State:
3.9% of AGI
(% of AGI for various income ranges: 0.9% for AGIs below $10k, 2.2% for AGIs $10k-25k, 3.6% for AGIs $25k-50k, 3.9% for AGIs $50k-75k, 3.7% for AGIs $75k-100k, 3.4% for AGIs over 100k)
Total tax: $4,408 (reported on 75.0% of returns)
21214:
$4,408
State:
$10,167
(% of AGI for various income ranges: 2.6% for AGIs below $10k, 3.7% for AGIs $10k-25k, 6.3% for AGIs $25k-50k, 8.9% for AGIs $50k-75k, 10.3% for AGIs $75k-100k, 14.8% for AGIs over 100k)
Earned income credit: $1,737 (reported on 17.5% of returns)
Here:
$1,737
State:
$1,700
Percentage of individuals using paid preparers for their 2004 taxes: 52.8%
Here:
53%
State:
55%
(% for various income ranges: 46.6% for AGIs below $10k, 56.9% for AGIs $10k-25k, 52.0% for AGIs $25k-50k, 52.5% for AGIs $50k-75k, 52.9% for AGIs $75k-100k, 58.0% for AGIs over 100k)
Likely homosexual households (counted as self-reported same-sex unmarried-partner households)
Lesbian couples: 0.4% of all households
Gay men: 0.3% of all households
Household received Food Stamps/SNAP in the past 12 months: 1,527 Household did not receive Food Stamps/SNAP in the past 12 months: 7,029
Women who had a birth in the past 12 months: 128 (101 now married, 27 unmarried) Women who did not have a birth in the past 12 months: 5,193 (1,831 now married, 3,361 unmarried)
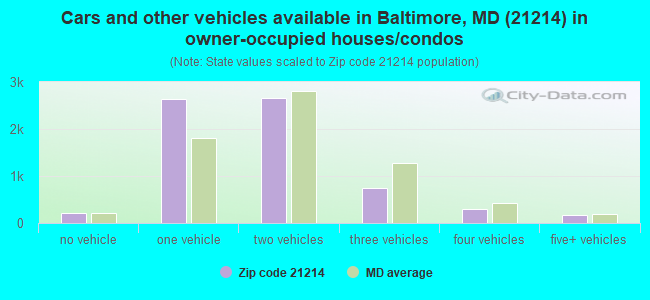
Housing units in zip code 21214 with a mortgage: 4,927 (335 second mortgage, 24 home equity loan, 197 both second mortgage and home equity loan) Houses without a mortgage: 153
Median monthly owner costs for units with a mortgage: $1,583 Median monthly owner costs for units without a mortgage: $675
Residents with income below the poverty level in 2022:
This zip code:
9.9%
Whole state:
9.6%
Residents with income below 50% of the poverty level in 2022:
This zip code:
3.0%
Whole state:
4.7%
Median number of rooms in houses and condos:
Here:
7.2
State:
7.3
Median number of rooms in apartments:
Here:
4.3
State:
4.2
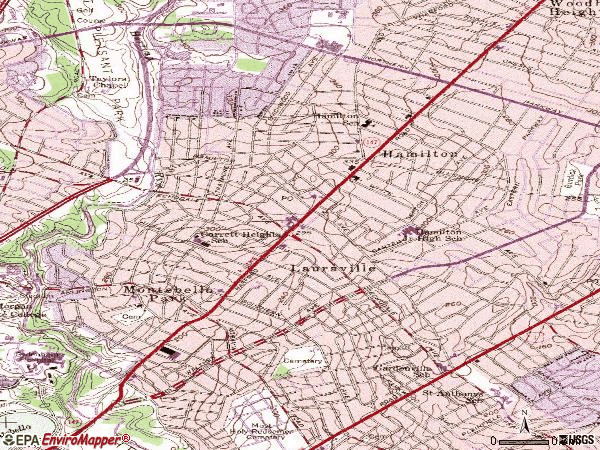
Notable locations in this zip code not listed on our city pages
Notable locations in zip code 21214: Harbel Multi-Purpose Center (A), Hamilton Branch Enoch Pratt Free Library (B), Baltimore City Fire Station 11 Engine 42 (C), Baltimore City Fire Station 10 Engine 56 (D). Display/hide their locations on the map
Churches in zip code 21214 include: Calvary Christian Church (A), Christ and Country Church (B), Faith and Truth Church (C), Mount Zion Hill Baptist Church (D), Pentecostal Church of the Nazarene (E), Restoration Ministries Bible Believers Church (F), Sharon Seventh Day Adventist Church (G), Shepherd Community Baptist Church (H), The Agape Christian Church (I). Display/hide their locations on the map
Cemeteries: Most Holy Redeemer Cemetery (1), German Lutheran Cemetery (2), Christopher Cemetery (3), Bnai Israel Cemetery (4). Display/hide their locations on the map
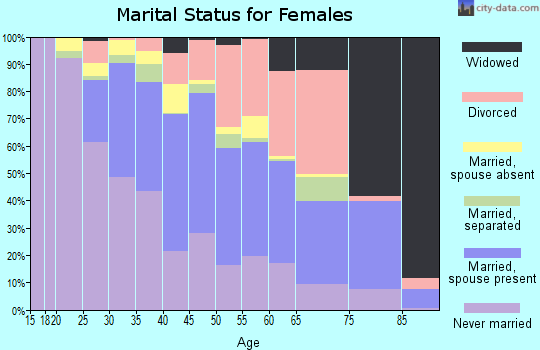
2,135 married couples with children.
1,685 single-parent households (308 men, 1,377 women).
92.5% of residents of 21214 zip code speak English at home.
2.1% of residents speak Spanish at home (78% very well, 17% well, 4% not well).
1.1% of residents speak other Indo-European language at home (71% very well, 20% well, 8% not well).
0.4% of residents speak Asian or Pacific Island language at home (52% well, 48% not well).
3.3% of residents speak other language at home (69% very well, 28% well, 3% not well).
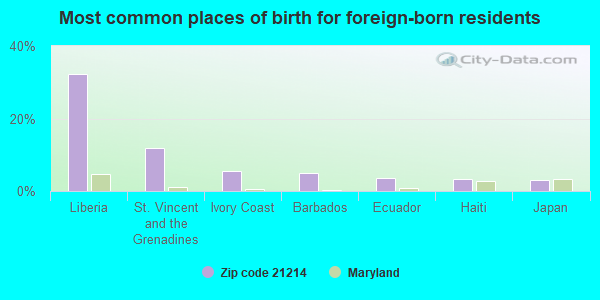
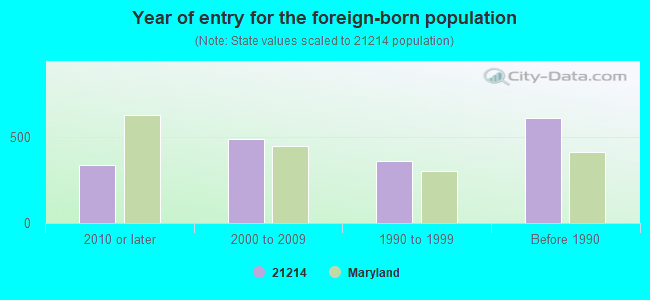
Foreign born population: 1,627 (7.6%) (68.1% of them are naturalized citizens)
Major facilities with environmental interests located in this zip code:
NORTHERN HIGH SCHOOL (2201 PINEWOOD AVENUE in BALTIMORE, MD)
AIR MINOR (AIRS/AFS) STATE MASTER (Maryland Permits tracking) - National Pollutant Discharge Elimination System Permit STATE MASTER (Maryland Air Emissions Database) - AIR MINOR (National Center for Education Statistics) - STATE ID-300402 National Pollutant Discharge Elimination System NON-MAJOR (Tracking pollutant discharge elimination systems) - permit National Pollutant Discharge Elimination System NON-MAJOR (Tracking pollutant discharge elimination systems) - permit Conditionally Exempt Small Quantity Generators, less than 100 kg/month of hazardous waste (Resource Conservation and Recovery Act (tracking hazardous waste)) - notification Business SIC classification: ELEMENTARY AND SECONDARY SCHOOLS Organizations: BALTIMORE CITY PUBLIC SCHOOLS (CONTACT/OWNER)
Alternative names: B.C.P.S.S., B.C.P.S.S.-NORTHERN HIGH SCH, NORTHERN SENIOR HIGH, NORTHERN SENIOR - SH 402
BP / AMOCO STATION # 00044 (5000 HARFORD ROAD in BALTIMORE, MD)
AIR MINOR (AIRS/AFS) STATE MASTER (Maryland Permits tracking) - OIL CONTROL STATE MASTER (Maryland Air Emissions Database) - AIR MINOR National Pollutant Discharge Elimination System NON-MAJOR (Tracking pollutant discharge elimination systems) - permit Small Quantity Generators, between 100 kg and 1000 kg of hazardous waste/month (Resource Conservation and Recovery Act (tracking hazardous waste)) - notification Conditionally Exempt Small Quantity Generators, less than 100 kg/month of hazardous waste (Resource Conservation and Recovery Act (tracking hazardous waste)) - notification Business SIC classification: REFUSE SYSTEMS; GASOLINE SERVICE STATIONS Organizations: OPERNAME (CONTACT/OPERATOR)
, AMOCO OIL COMPANY (CONTACT/OWNER)
, AMOCO OIL CO (CONTACT/OWNER)
Alternative names: AMOCO - 5000 HARFORD ROAD, AMOCO #44-TANKS, BP - 5000 HARFORD ROAD, BP STATION #00044, F & S BP STATION, FS AMOCO
OPEN BIBLE TABERNACLE (5814 HARFORD ROAD in BALTIMORE, MD)
AIR MINOR (AIRS/AFS) (Integrated Compliance Information System) - ICIS-03-1989-0689, FORMAL ENFORCEMENT ACTION STATE MASTER (Maryland Air Emissions Database) - AIR MINOR COMPLIANCE ACTIVITY (Tracking inspections of insecticide, fungicide, and rodenticide, and toxic substances) Business SIC classification: ELEMENTARY AND SECONDARY SCHOOLS; CHILD DAY CARE SERVICES; RELIGIOUS ORGANIZATIONS Alternative names: OPEN BIBLE DAY SCHOOL, OPEN DOOR TABERNACLE SCHOOL
BROMWELL PRESS INCORPORATED (6619 HARFORD ROAD in BALTIMORE, MD)
AIR MINOR (AIRS/AFS) STATE MASTER (Maryland Air Emissions Database) - AIR MINOR Small Quantity Generators, between 100 kg and 1000 kg of hazardous waste/month (Resource Conservation and Recovery Act (tracking hazardous waste)) - notification Business SIC classification: COMMERCIAL PRINTING, LITHOGRAPHIC Organizations: OPERNAME (CONTACT/OPERATOR)
, BROMWELL, KENT S (CONTACT/OWNER)
EXXON 2301 EAST NORTHERN PARKWAY (2301 NORTHERN PARKWAY, EAST in BALTIMORE, MD)
AIR MINOR (AIRS/AFS) STATE MASTER (Maryland Air Emissions Database) - AIR MINOR Conditionally Exempt Small Quantity Generators, less than 100 kg/month of hazardous waste (Resource Conservation and Recovery Act (tracking hazardous waste)) - notification Business SIC classification: GASOLINE SERVICE STATIONS Organizations: OPERNAME (CONTACT/OPERATOR)
, EXXON MOBIL (CONTACT/OWNER)
Alternative names: EXXON O USA #25313, EXXON RAS #25313
BP - 5609 HARFORD ROAD (5609 HARFORD ROAD in BALTIMORE, MD)
AIR MINOR (AIRS/AFS) STATE MASTER (Maryland Air Emissions Database) - AIR MINOR Small Quantity Generators, between 100 kg and 1000 kg of hazardous waste/month (Resource Conservation and Recovery Act (tracking hazardous waste)) - notification Business SIC classification: GASOLINE SERVICE STATIONS Organizations: OPERNAME (CONTACT/OPERATOR)
, AMOCO OIL COMPANY (CONTACT/OWNER)
Alternative names: AMOCO - 5609 HARFORD ROAD, AMOCO #30-TANKS
PACKER AL LINCOLN MERCURY (3010 HAMILTON AVENUE in BALTIMORE, MD)
AIR MINOR (AIRS/AFS) STATE MASTER (Maryland Air Emissions Database) - AIR MINOR Small Quantity Generators, between 100 kg and 1000 kg of hazardous waste/month (Resource Conservation and Recovery Act (tracking hazardous waste)) Business SIC classification: MOTOR VEHICLE DEALERS (NEW AND USED) Organizations: OPERNAME (CONTACT/OPERATOR)
FAIRLANES HARFORD ROAD (6101 HARFORD ROAD in BALTIMORE, MD)
AIR MINOR (AIRS/AFS) STATE MASTER (Maryland Air Emissions Database) - AIR MINOR Business SIC classification: BOWLING CENTERS Alternative names: FAIR LANES - HARFORD ROAD
ARCADE THEATRE (5424 HARFORD ROAD in BALTIMORE, MD)
AIR MINOR (AIRS/AFS) STATE MASTER (Maryland Air Emissions Database) - AIR MINOR Business SIC classification: MOTION PICTURE THEATERS, EXCEPT DRIVE-IN
BETHESDA UNITED METHODIST CHURCH (6300 HARFORD ROAD in BALTIMORE, MD)
AIR MINOR (AIRS/AFS) STATE MASTER (Maryland Air Emissions Database) - AIR MINOR Business SIC classification: RELIGIOUS ORGANIZATIONS
BOTELER GRAPHICS (6205A HARFORD ROAD in BALTIMORE, MD)
AIR MINOR (AIRS/AFS) STATE MASTER (Maryland Air Emissions Database) - AIR MINOR Business SIC classification: COMMERCIAL PRINTING, LITHOGRAPHIC
LAURAVILLE METHODIST CHURCH (4800 HARFORD ROAD in BALTIMORE, MD)
AIR MINOR (AIRS/AFS) STATE MASTER (Maryland Air Emissions Database) - AIR MINOR Business SIC classification: RELIGIOUS ORGANIZATIONS
CHURCH OF THE MESSIAH (5801 HARFORD ROAD in BALTIMORE, MD)
AIR MINOR (AIRS/AFS) STATE MASTER (Maryland Air Emissions Database) - AIR MINOR Business SIC classification: RELIGIOUS ORGANIZATIONS
Housing units lacking complete plumbing facilities: 1.2% Housing units lacking complete kitchen facilities: 2.5%
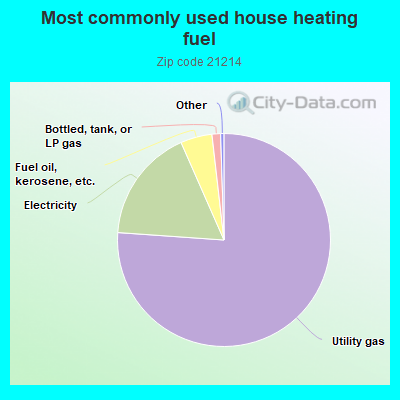
76.2%Utility gas
17.3%Electricity
4.8%Fuel oil, kerosene, etc.
1.3%Bottled, tank, or LP gas
Population in 1990: 20,949. Population change in the 1990s: +336 (+1.6%).
Place of birth for U.S.-born residents:
This state: 14,396
Northeast: 1,871
Midwest: 518
South: 2,313
West: 511
63% of the 21214 zip code residents lived in the same house 5 years ago. Out of people who lived in different houses, 72% lived in this county. Out of people who lived in different counties, 50% lived in Maryland.
93% of the 21214 zip code residents lived in the same house 1 year ago. Out of people who lived in different houses, 61% moved from this county. Out of people who lived in different houses, 27% moved from different county within same state. Out of people who lived in different houses, 11% moved from different state. Out of people who lived in different houses, 5% moved from abroad.
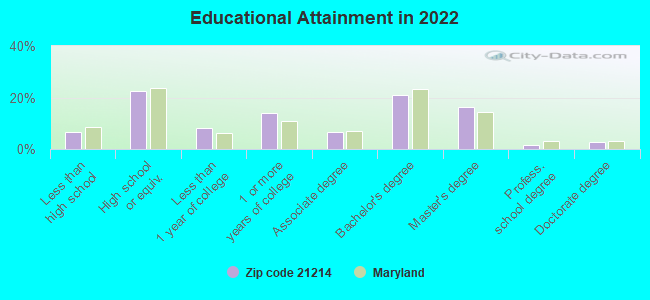
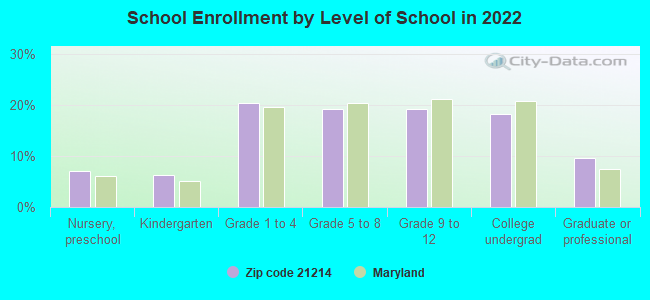
Private vs. public school enrollment:
Students in private schools in grades 1 to 8 (elementary and middle school): 594
Here:
29.3%
Maryland:
15.2%
Students in private schools in grades 9 to 12 (high school): 195
Here:
19.9%
Maryland:
14.4%
Students in private undergraduate colleges: 175
Here:
18.7%
Maryland:
20.2%
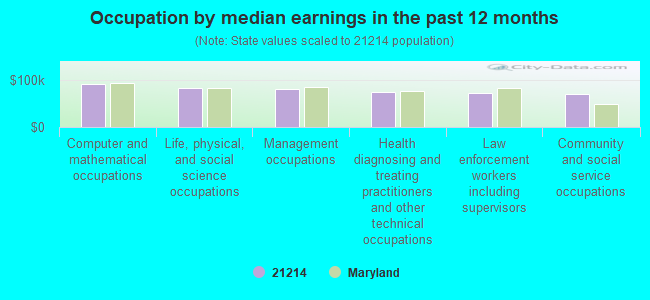
Occupation by median earnings in the past 12 months ($)
90,966Computer and mathematical occupations
81,659Life, physical, and social science occupations
79,426Management occupations
74,079Health diagnosing and treating practitioners and other technical occupations
72,528Law enforcement workers including supervisors
68,958Community and social service occupations
Companies with federal contracts located in this zip code:
DECA INC (6501 HARFORD RD in BALTIMORE, MD; small business) : $25,225 in 3 contractsfrom 2004 to 2005
$14,850 with Army for Installation of Equipment -- Electric Wire, and Power and Distribution Equipment. Signed on 2004-09-01. Completion date: 2004-09-30.
$7,000 with Army for Maintenance, Repair and Rebuilding of Equipment -- Miscellaneous. Signed on 2004-09-30. Completion date: 2004-09-30.
$3,375 with Army for Laboratory Equipment and Supplies. Signed on 2005-06-14. Completion date: 2005-07-29.
MILAGROS JANITORAL SERVICES (6210 MCCLEAN BLVD in BALTIMORE, MD; small business) : $9,000 in 4 contractsfrom 2003 to 2005
$3,120 with Army for Custodial Janitorial Services. Signed on 2005-11-20. Completion date: 2006-09-30.
$3,000, same as above.Signed on 2004-12-10. Completion date: 2004-09-30.
$2,880, same as above.Signed on 2003-11-13. Completion date: 2004-09-30.
$0, same as above.Signed on 2003-11-13. Completion date: 2004-09-30.
Top industries in this zip code by the number of employees in 2005:
Health Care and Social Assistance: Nursing Care Facilities (100-249 employees: 2 establishments, 1-4 employees: 1 establishment)
2002 - 2018 National Fire Incident Reporting System (NFIRS) incidents
According to the data from the years 2002 - 2018 the average number of fire incidents per year is 73. The highest number of fire incidents - 122 took place in 2002, and the least - 0 in 2003. The data has a declining trend.
When looking into fire subcategories, the most reports belonged to: Structure Fires (41.9%), and Outside Fires (32.3%).
Fire incident types reported to NFIRS in Zip Code 21214


 Nearest zip codes: 21251, 21206, 21239, 21213, 21218, 21205.
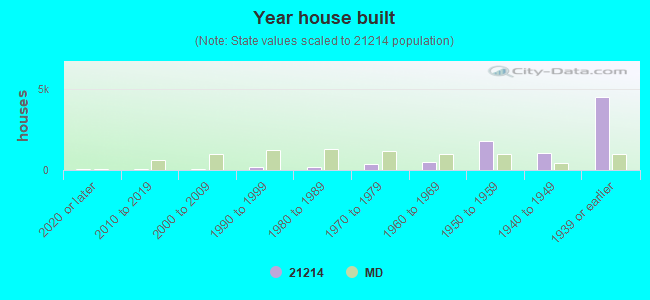


 According to the data from the years 2002 - 2018 the average number of fire incidents per year is 73. The highest number of fire incidents - 122 took place in 2002, and the least - 0 in 2003. The data has a declining trend.
 When looking into fire subcategories, the most reports belonged to: Structure Fires (41.9%), and Outside Fires (32.3%).