Estimated zip code population in 2022: 6,712 Zip code population in 2010: 5,545 Zip code population in 2000: 5,289
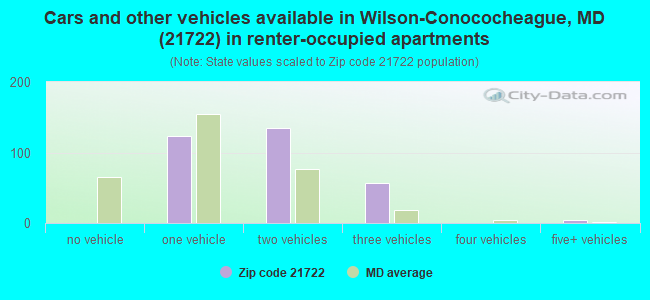
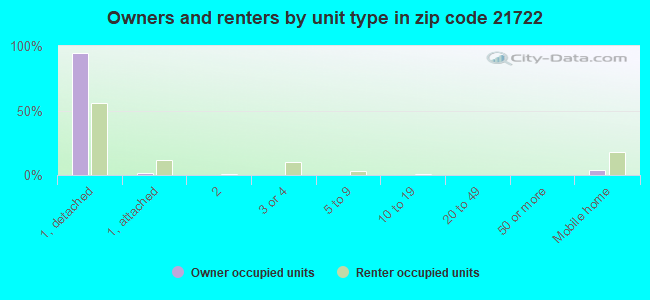
Houses and condos: 2,312 Renter-occupied apartments: 320
% of renters here:
14%
State:
32%
March 2022 cost of living index in zip code 21722: 133.4 (high, U.S. average is 100)
Land area: 59.4 sq. mi. Water area: 1.3 sq. mi.
Population density: 113 people per square mile
(very low).
OSM Map
General Map
Google Map
MSN Map
OSM Map
General Map
Google Map
MSN Map
OSM Map
General Map
Google Map
MSN Map
OSM Map
General Map
Google Map
MSN Map
Please wait while loading the map...
Real estate property taxes paid for housing units in 2022:
This zip code:
0.7% ($2,072)
Maryland:
0.9% ($3,777)
Median real estate property taxes paid for housing units with mortgages in 2022: $2,167 (0.7%) Median real estate property taxes paid for housing units with no mortgage in 2022: $1,983 (0.8%)
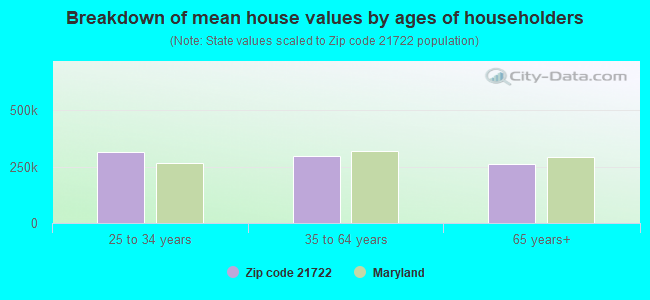
Estimated median house/condo value in 2022: $293,161
21722:
$293,161
Maryland:
$398,100
According to our research of Maryland and other state lists, there were 8 registered sex offenders living in 21722 zip code as of April 26, 2024. The ratio of all residents to sex offenders in zip code 21722 is 758 to 1. The ratio of registered sex offenders to all residents in this zip code is near the state average.
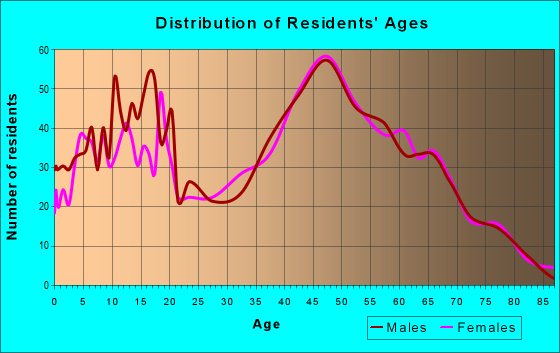
Median resident age:
This zip code:
44.2 years
Maryland median age:
39.7 years
Average household size:
This zip code:
2.9 people
Maryland:
2.5 people
Averages for the 2020 tax year for zip code 21722, filed in 2021:
Average Adjusted Gross Income (AGI) in 2020: $66,574 (Individual Income Tax Returns)
Here:
$66,574
State:
$86,905
Salary/wage: $57,241 (reported on 82.2% of returns)
Here:
$57,241
State:
$73,953
(% of AGI for various income ranges: 1113.9% for AGIs below $25k, 3418.3% for AGIs $25k-50k, 6844.8% for AGIs $50k-75k, 8770.8% for AGIs $75k-100k, 17590.0% for AGIs $100k-200k, 47590.0% for AGIs over 200k)
Taxable interest for individuals: $1,282 (reported on 34.8% of returns)
This zip code:
$1,282
Maryland:
$1,528
(% of AGI for various income ranges: 9.0% for AGIs below $25k, 28.4% for AGIs $25k-50k, 42.4% for AGIs $50k-75k, 112.1% for AGIs $75k-100k, 110.4% for AGIs $100k-200k, 1063.3% for AGIs over 200k)
Ordinary dividends: $3,307 (reported on 15.9% of returns)
Here:
$3,307
State:
$8,028
(% of AGI for various income ranges: 22.5% for AGIs below $25k, 39.3% for AGIs $25k-50k, 52.1% for AGIs $50k-75k, 132.1% for AGIs $75k-100k, 130.7% for AGIs $100k-200k, 926.7% for AGIs over 200k)
Net capital gain/loss in AGI: +$12,632 (reported on 14.9% of returns)
Here:
+$12,632
State:
+$25,238
(% of AGI for various income ranges: 10.2% for AGIs below $25k, 63.4% for AGIs $25k-50k, 65.5% for AGIs $50k-75k, 152.1% for AGIs $75k-100k, 460.0% for AGIs $100k-200k, 9720.0% for AGIs over 200k)
Profit/loss from business: +$9,946 (reported on 13.4% of returns)
Here:
+$9,946
State:
+$11,398
(% of AGI for various income ranges: 89.0% for AGIs below $25k, 108.6% for AGIs $25k-50k, 198.6% for AGIs $50k-75k, 220.0% for AGIs $75k-100k, 532.9% for AGIs $100k-200k)
Taxable individual retirement arrangement distribution: $12,703 (reported on 10.5% of returns)
21722:
$12,703
Maryland:
$20,944
(% of AGI for various income ranges: 84.9% for AGIs below $25k, 121.0% for AGIs $25k-50k, 166.9% for AGIs $50k-75k, 253.3% for AGIs $75k-100k, 520.4% for AGIs $100k-200k)
Total itemized deductions: $27,437 (reported on 10.9% of returns)
Here:
$27,437
State:
$30,672
(% of AGI for various income ranges: 92.7% for AGIs below $25k, 126.2% for AGIs $25k-50k, 410.0% for AGIs $50k-75k, 576.2% for AGIs $75k-100k, 923.2% for AGIs $100k-200k, 6230.0% for AGIs over 200k)
Charity contributions: $10,714 (reported on 8.0% of returns)
Here:
$10,714
State:
$9,065
(% of AGI for various income ranges: 19.8% for AGIs $25k-50k, 91.0% for AGIs $50k-75k, 81.7% for AGIs $75k-100k, 257.9% for AGIs $100k-200k, 3533.3% for AGIs over 200k)
Taxes paid: $7,583 (reported on 10.5% of returns)
21722:
$7,583
State:
$8,475
(% of AGI for various income ranges: 34.0% for AGIs $25k-50k, 116.6% for AGIs $50k-75k, 199.2% for AGIs $75k-100k, 295.0% for AGIs $100k-200k, 1200.0% for AGIs over 200k)
Earned income credit: $2,117 (reported on 10.9% of returns)
Here:
$2,117
State:
$2,151
(% of AGI for various income ranges: 62.5% for AGIs below $25k, 54.5% for AGIs $25k-50k)
Percentage of individuals using paid preparers for their 2020 taxes: 94.2%
Here:
94%
State:
90%
(% for various income ranges: 91.9% for AGIs below $25k, 94.4% for AGIs $25k-50k, 95.3% for AGIs $50k-75k, 96.9% for AGIs $75k-100k, 93.6% for AGIs $100k-200k, 100.0% for AGIs over 200k)
Averages for the 2012 tax year for zip code 21722, filed in 2013:
Average Adjusted Gross Income (AGI) in 2012: $52,077 (Individual Income Tax Returns)
Here:
$52,077
State:
$72,703
Salary/wage: $46,884 (reported on 85.4% of returns)
Here:
$46,884
State:
$62,228
(% of AGI for various income ranges: 72.7% for AGIs below $25k, 76.2% for AGIs $25k-50k, 78.7% for AGIs $50k-75k, 82.4% for AGIs $75k-100k, 81.8% for AGIs $100k-200k, 53.0% for AGIs over 200k)
Taxable interest for individuals: $892 (reported on 39.6% of returns)
This zip code:
$892
Maryland:
$1,413
(% of AGI for various income ranges: 1.2% for AGIs below $25k, 0.9% for AGIs $25k-50k, 0.3% for AGIs $50k-75k, 0.5% for AGIs $75k-100k, 0.5% for AGIs $100k-200k, 1.3% for AGIs over 200k)
Ordinary dividends: $2,284 (reported on 16.4% of returns)
Here:
$2,284
State:
$6,933
(% of AGI for various income ranges: 1.5% for AGIs below $25k, 0.8% for AGIs $25k-50k, 0.4% for AGIs $50k-75k, 0.3% for AGIs $75k-100k, 1.2% for AGIs $100k-200k)
Net capital gain/loss in AGI: +$3,703 (reported on 11.6% of returns)
Here:
+$3,703
State:
+$14,830
(% of AGI for various income ranges: 0.9% for AGIs below $25k, 0.8% for AGIs $25k-50k, 0.9% for AGIs $50k-75k, 0.3% for AGIs $75k-100k, 1.4% for AGIs $100k-200k)
Profit/loss from business: +$9,073 (reported on 12.3% of returns)
Here:
+$9,073
State:
+$12,606
(% of AGI for various income ranges: 3.8% for AGIs below $25k, 2.5% for AGIs $25k-50k, 1.7% for AGIs $50k-75k, 1.2% for AGIs $75k-100k, 3.2% for AGIs $100k-200k)
Taxable individual retirement arrangement distribution: $10,564 (reported on 8.2% of returns)
21722:
$10,564
Maryland:
$17,065
(% of AGI for various income ranges: 2.3% for AGIs below $25k, 1.9% for AGIs $25k-50k, 1.5% for AGIs $50k-75k, 1.8% for AGIs $75k-100k, 1.9% for AGIs $100k-200k)
Total itemized deductions: $21,404 (25% of AGI, reported on 38.8% of returns)
Here:
$21,404
State:
$27,886
Here:
24.8% of AGI
State:
22.8% of AGI
(% of AGI for various income ranges: 13.2% for AGIs below $25k, 11.9% for AGIs $25k-50k, 15.5% for AGIs $50k-75k, 17.9% for AGIs $75k-100k, 17.2% for AGIs $100k-200k, 19.9% for AGIs over 200k)
Charity contributions: $3,423 (reported on 28.7% of returns)
Here:
$3,423
State:
$4,452
(% of AGI for various income ranges: 1.1% for AGIs below $25k, 1.8% for AGIs $25k-50k, 1.8% for AGIs $50k-75k, 2.1% for AGIs $75k-100k, 1.9% for AGIs $100k-200k, 2.7% for AGIs over 200k)
Taxes paid: $8,019 (reported on 38.8% of returns)
21722:
$8,019
State:
$11,690
(% of AGI for various income ranges: 1.8% for AGIs below $25k, 3.2% for AGIs $25k-50k, 5.1% for AGIs $50k-75k, 6.8% for AGIs $75k-100k, 8.1% for AGIs $100k-200k, 9.6% for AGIs over 200k)
Earned income credit: $2,083 (reported on 13.4% of returns)
Here:
$2,083
State:
$2,199
(% of AGI for various income ranges: 4.6% for AGIs below $25k, 0.9% for AGIs $25k-50k)
Percentage of individuals using paid preparers for their 2012 taxes: 58.6%
Here:
59%
State:
52%
(% for various income ranges: 49.5% for AGIs below $25k, 59.4% for AGIs $25k-50k, 66.0% for AGIs $50k-75k, 62.1% for AGIs $75k-100k, 65.5% for AGIs $100k-200k, 100.0% for AGIs over 200k)
Averages for the 2004 tax year for zip code 21722, filed in 2005:
Average Adjusted Gross Income (AGI) in 2004: $45,385 (Individual Income Tax Returns)
Here:
$45,385
State:
$60,339
Salary/wage: $40,420 (reported on 87.9% of returns)
Here:
$40,420
State:
$52,211
(% of AGI for various income ranges: 123.9% for AGIs below $10k, 73.5% for AGIs $10k-25k, 84.1% for AGIs $25k-50k, 86.2% for AGIs $50k-75k, 85.8% for AGIs $75k-100k, 56.2% for AGIs over 100k)
Taxable interest for individuals: $1,077 (reported on 47.8% of returns)
This zip code:
$1,077
Maryland:
$1,701
(% of AGI for various income ranges: 4.3% for AGIs below $10k, 2.5% for AGIs $10k-25k, 1.2% for AGIs $25k-50k, 0.8% for AGIs $50k-75k, 0.7% for AGIs $75k-100k, 1.1% for AGIs over 100k)
Taxable dividends: $1,435 (reported on 18.1% of returns)
Here:
$1,435
State:
$4,235
(% of AGI for various income ranges: 1.1% for AGIs below $10k, 1.3% for AGIs $10k-25k, 0.5% for AGIs $25k-50k, 0.3% for AGIs $50k-75k, 0.5% for AGIs $75k-100k, 0.7% for AGIs over 100k)
Net capital gain/loss: +$10,191 (reported on 14.2% of returns)
Here:
+$10,191
State:
+$15,888
(% of AGI for various income ranges: 1.7% for AGIs below $10k, 1.0% for AGIs $10k-25k, 1.1% for AGIs $25k-50k, 1.2% for AGIs $50k-75k, 3.1% for AGIs $75k-100k, 8.6% for AGIs over 100k)
Profit/loss from business: +$8,872 (reported on 12.7% of returns)
Here:
+$8,872
State:
+$12,221
(% of AGI for various income ranges: -10.5% for AGIs below $10k, 3.5% for AGIs $10k-25k, 2.5% for AGIs $25k-50k, 2.2% for AGIs $50k-75k, 1.4% for AGIs $75k-100k, 4.0% for AGIs over 100k)
IRA payment deduction: $3,152 (reported on 2.5% of returns)
21722:
$3,152
Maryland:
$2,968
(% of AGI for various income ranges: 0.4% for AGIs $10k-25k, 0.3% for AGIs $25k-50k, 0.2% for AGIs $50k-75k, 0.2% for AGIs over 100k)
Total itemized deductions: $16,305 (22% of AGI, reported on 38.6% of returns)
Here:
$16,305
State:
$22,960
Here:
21.9% of AGI
State:
23.3% of AGI
(% of AGI for various income ranges: 8.8% for AGIs $10k-25k, 11.8% for AGIs $25k-50k, 15.4% for AGIs $50k-75k, 17.3% for AGIs $75k-100k, 13.9% for AGIs over 100k)
Charity contributions deductions: $2,923 (4% of AGI, reported on 31.8% of returns)
Here:
$2,923
State:
$4,031
Here:
3.7% of AGI
State:
3.9% of AGI
(% of AGI for various income ranges: 1.1% for AGIs $10k-25k, 1.4% for AGIs $25k-50k, 1.8% for AGIs $50k-75k, 2.3% for AGIs $75k-100k, 3.3% for AGIs over 100k)
Total tax: $5,390 (reported on 81.1% of returns)
21722:
$5,390
State:
$10,167
(% of AGI for various income ranges: 3.0% for AGIs below $10k, 4.5% for AGIs $10k-25k, 6.8% for AGIs $25k-50k, 8.3% for AGIs $50k-75k, 9.2% for AGIs $75k-100k, 16.7% for AGIs over 100k)
Earned income credit: $1,572 (reported on 11.0% of returns)
Here:
$1,572
State:
$1,700
Percentage of individuals using paid preparers for their 2004 taxes: 62.9%
Here:
63%
State:
55%
(% for various income ranges: 50.8% for AGIs below $10k, 64.1% for AGIs $10k-25k, 60.9% for AGIs $25k-50k, 66.8% for AGIs $50k-75k, 69.8% for AGIs $75k-100k, 74.4% for AGIs over 100k)
Household received Food Stamps/SNAP in the past 12 months: 109 Household did not receive Food Stamps/SNAP in the past 12 months: 2,146
Women who had a birth in the past 12 months: 34 (18 now married, 16 unmarried) Women who did not have a birth in the past 12 months: 1,571 (669 now married, 901 unmarried)
Housing units in zip code 21722 with a mortgage: 1,142 (91 second mortgage, 94 both second mortgage and home equity loan) Houses without a mortgage: 17
Median monthly owner costs for units with a mortgage: $1,763 Median monthly owner costs for units without a mortgage: $473
Residents with income below the poverty level in 2022:
This zip code:
3.6%
Whole state:
9.6%
Residents with income below 50% of the poverty level in 2022:
This zip code:
1.0%
Whole state:
4.7%
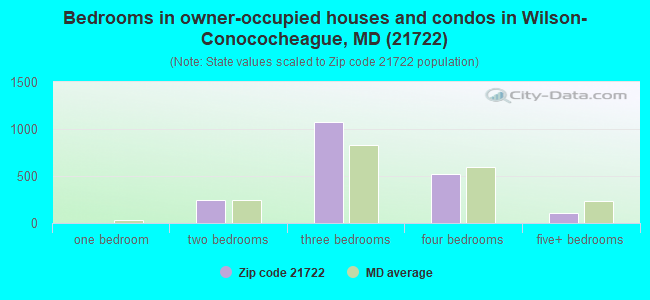
Median number of rooms in houses and condos:
Here:
6.5
State:
7.3
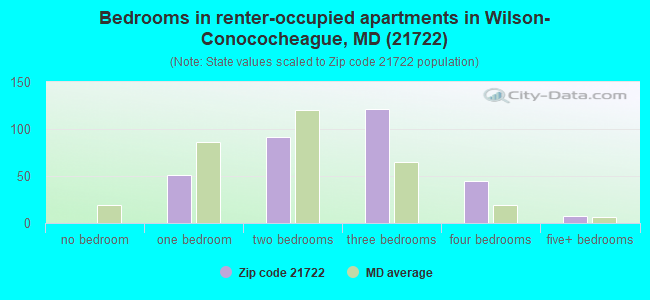
Median number of rooms in apartments:
Here:
5.4
State:
4.2
Notable locations in this zip code not listed on our city pages
Notable locations in zip code 21722: McCoys Ferry Campground (A), Stoneleigh Farm (B), Four Locks Ranger Station (C), Four Locks Picnic Area (D), McCoys Ferry (E), Cushwa Mill (F), Clear Spring Volunteer Fire Company 4 (G), Knob Hill Winery (H), Clear Spring Ambulance Squad 49 (I), Clear Spring Town Hall (J). Display/hide their locations on the map
Churches in zip code 21722 include: Saint Andrews Episcopal Church (A), Saint Johns United Church of Christ (B), Saint Michaels Catholic Church (C), Saint Peters Evangelical Lutheran Church (D), Trinity Church of God (E), Union Bethel Church of God (F), Saint Clements Chapel (G), Saint Pauls Church (H). Display/hide their locations on the map
Cemeteries: Rose Hill Cemetery (1), Union Bethel Cemetery (2), Saint Peters Cemetery (3), Saint Pauls Cemetery (4), Little Metropolitan Cemetery (5), Cushwa Cemetery (6), Green Spring Cemetery (7). Display/hide their locations on the map
Streams, rivers, and creeks: Camp Spring Run (A), Dry Run (B), Little Conococheague Creek (C), Toms Run (D), Hinkle Run (E), Green Spring Run (F). Display/hide their locations on the map
In group quarters: 39 (-1 institutionalized population)
Size of family households: 695 2-persons, 200 3-persons, 542 4-persons, 191 5-persons, 65 6-persons, 55 7-or-more-persons
Size of nonfamily households: 422 1-person, 77 2-persons, 6 6-persons
959 married couples with children.
302 single-parent households (21 men, 281 women).
97.6% of residents of 21722 zip code speak English at home.
0.8% of residents speak Spanish at home (100% very well).
0.1% of residents speak other Indo-European language at home (100% very well).
0.4% of residents speak Asian or Pacific Island language at home (100% very well).
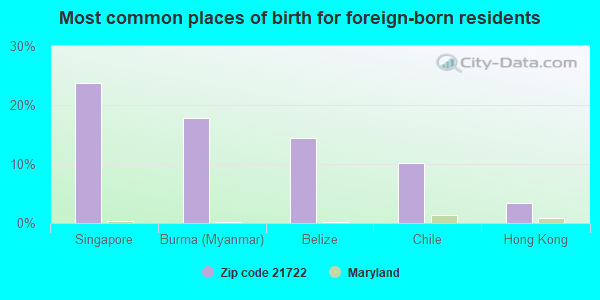
Foreign born population: 118 (1.8%) (55.1% of them are naturalized citizens)
This zip code:
1.8%
Whole state:
16.7%
24%Singapore
18%Burma (Myanmar)
14%Belize
10%Chile
3%Hong Kong
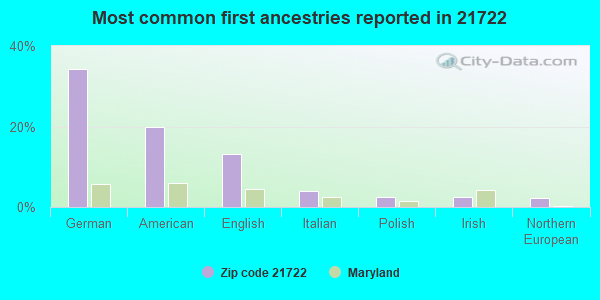
34%German
20%American
13%English
4%Italian
3%Polish
2%Irish
2%Northern European
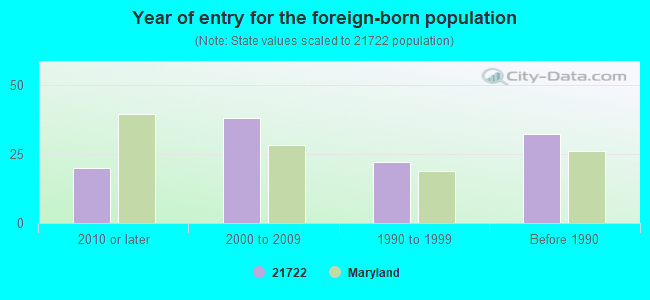
Year of entry for the foreign-born population
202010 or later
382000 to 2009
221990 to 1999
32Before 1990
Facilities with environmental interests located in this zip code:
MELLOTT H B ROCKDALE QUARRY (13645 ROCKDALE ROAD in CLEAR SPRING, MD)
AIR MINOR (AIRS/AFS) STATE MASTER (Maryland Permits tracking) - National Pollutant Discharge Elimination System Permit, OIL CONTROL STATE MASTER (Maryland Air Emissions Database) - AIR MAJOR National Pollutant Discharge Elimination System NON-MAJOR (Tracking pollutant discharge elimination systems) - permit Business SIC classification: CRUSHED AND BROKEN STONE; CONSTRUCTION SAND AND GRAVEL; READY-MIXED CONCRETE Alternative names: H. B. MELLOTT,ESTATES,INC., H.B. MELLOTT - ROCKDALE QUARRY
CLEAR SPRING ELEMENTARY SCHOOL (12627 BROADFORDING ROAD in CLEAR SPRING, MD)
AIR MINOR (AIRS/AFS) STATE MASTER (Maryland Air Emissions Database) - AIR MINOR (National Center for Education Statistics) - STATE ID-210402 Business SIC classification: ELEMENTARY AND SECONDARY SCHOOLS Organizations: WASHINGTON COUNTY BOARD OF EDUCATION (SCHOOL DISTRICT)
CLEAR SPRING MIDDLE SCHOOL (12628 BROADFORDING ROAD in CLEAR SPRING, MD)
AIR MINOR (AIRS/AFS) (National Center for Education Statistics) - STATE ID-210401 Business SIC classification: ELEMENTARY AND SECONDARY SCHOOLS Organizations: WASHINGTON COUNTY BOARD OF EDUCATION (SCHOOL DISTRICT)
AMOCO 12828 CLEAR SPRING ROAD (12828 CLEAR SPRING ROAD in CLEAR SPRING, MD)
AIR MINOR (AIRS/AFS) STATE MASTER (Maryland Air Emissions Database) - AIR MINOR Business SIC classification: GASOLINE SERVICE STATIONS
CLEAR SPRING WWTP (MD. ROUTE 68 in CLEAR SPRING, MD)
STATE MASTER (Maryland Permits tracking) - NPDES NON-MAJOR National Pollutant Discharge Elimination System NON-MAJOR (Tracking pollutant discharge elimination systems) - permit Business SIC classification: SEWERAGE SYSTEMS
CLEAR SPRING HIGH (12630 BROADFORDING RD in CLEAR SPRING, MD)
(National Center for Education Statistics) - STATE ID-210403 Organizations: WASHINGTON COUNTY BOARD OF EDUCATION (SCHOOL DISTRICT)
FAIRVIEW OUTDOOR EDUC CENTER (12808 DRAPER RD in CLEAR SPRING, MD)
(National Center for Education Statistics) - STATE ID-210404 Organizations: WASHINGTON COUNTY BOARD OF EDUCATION (SCHOOL DISTRICT)
AT & T LONG LINES - EQUIP ENGR (PO BOX 180 in CLEAR SPRINGS, MD)
Small Quantity Generators, between 100 kg and 1000 kg of hazardous waste/month (Resource Conservation and Recovery Act (tracking hazardous waste)) - notification Organizations: OPERNAME (CONTACT/OPERATOR)
CLEAR SPRING WTP (HARVEY RD.@ NATIONAL PIKE in CLEAR SPRING, MD)
National Pollutant Discharge Elimination System NON-MAJOR (Tracking pollutant discharge elimination systems) - permit Business SIC classification: WATER SUPPLY Alternative names: TOWN OF CLEAR SPRING
Housing units lacking complete plumbing facilities: 0.1% Housing units lacking complete kitchen facilities: 0.2%
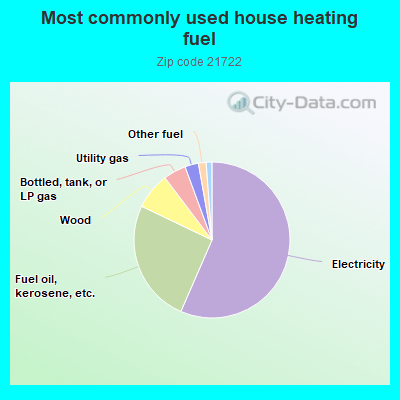
56.6%Electricity
25.6%Fuel oil, kerosene, etc.
7.6%Wood
4.7%Bottled, tank, or LP gas
2.8%Utility gas
1.6%Other fuel
0.6%Coal or coke
0.6%No fuel used
Population in 1990: 3,661. Population change in the 1990s: +1,628 (+44.5%).
Place of birth for U.S.-born residents:
This state: 5,332
Northeast: 369
Midwest: 153
South: 619
West: 86
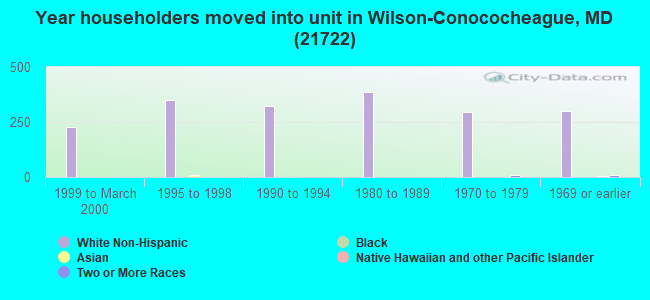
69% of the 21722 zip code residents lived in the same house 5 years ago. Out of people who lived in different houses, 78% lived in this county. Out of people who lived in different counties, 50% lived in Maryland.
90% of the 21722 zip code residents lived in the same house 1 year ago. Out of people who lived in different houses, 89% moved from this county. Out of people who lived in different houses, 5% moved from different state.
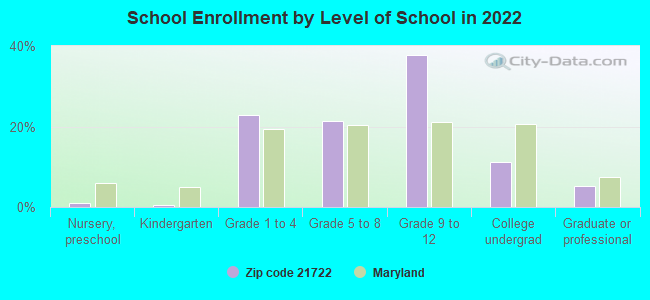
Private vs. public school enrollment:
Students in private schools in grades 1 to 8 (elementary and middle school):
Here:
0.0%
Maryland:
15.2%
Students in private schools in grades 9 to 12 (high school): 272
Here:
37.5%
Maryland:
14.4%
Students in private undergraduate colleges: 22
Here:
10.7%
Maryland:
20.2%
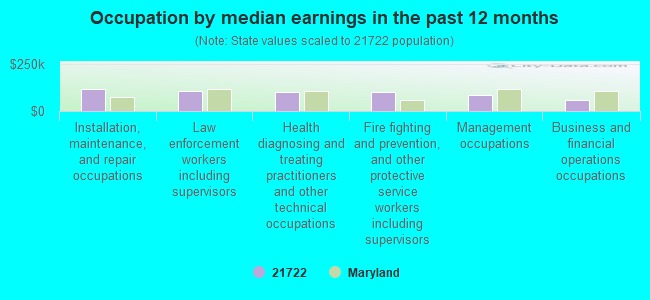
Occupation by median earnings in the past 12 months ($)
118,231Installation, maintenance, and repair occupations
107,387Law enforcement workers including supervisors
102,491Health diagnosing and treating practitioners and other technical occupations
99,678Fire fighting and prevention, and other protective service workers including supervisors
86,928Management occupations
60,300Business and financial operations occupations
Companies with federal contracts located in this zip code:
INDUSTRIAL MECHANICAL DIVERSIF (21 S MILL ST in CLEAR SPRING, MD; small business)
$8,200 with Army for Maintenance, Repair and Rebuilding of Equipment -- Special Industry Machinery. Signed on 2004-01-31. Completion date: 2004-02-29.
Top industries in this zip code by the number of employees in 2005:
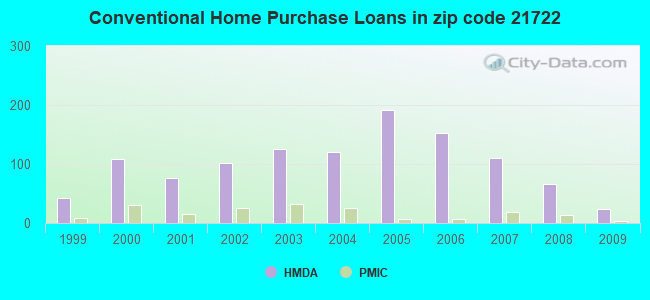
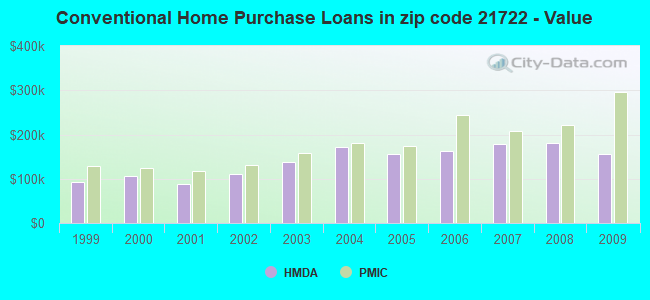
Detailed PMIC statistics for the following Tracts:0105.00
, 0106.00
2002 - 2018 National Fire Incident Reporting System (NFIRS) incidents
Based on the data from the years 2002 - 2018 the average number of fire incidents per year is 51. The highest number of reported fires - 91 took place in 2009, and the least - 25 in 2017. The data has a dropping trend.
When looking into fire subcategories, the most incidents belonged to: Structure Fires (51.7%), and Outside Fires (29.6%).
Fire incident types reported to NFIRS in Zip Code 21722
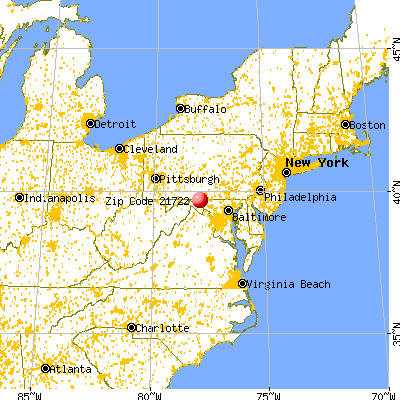


 Nearest zip codes: 25419, 21711, 21795, 17236, 21767, 21740.
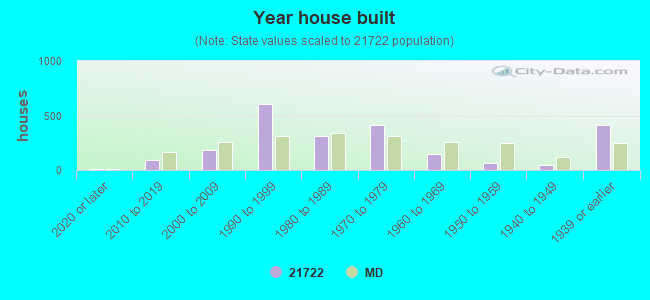


 Based on the data from the years 2002 - 2018 the average number of fire incidents per year is 51. The highest number of reported fires - 91 took place in 2009, and the least - 25 in 2017. The data has a dropping trend.
 When looking into fire subcategories, the most incidents belonged to: Structure Fires (51.7%), and Outside Fires (29.6%).