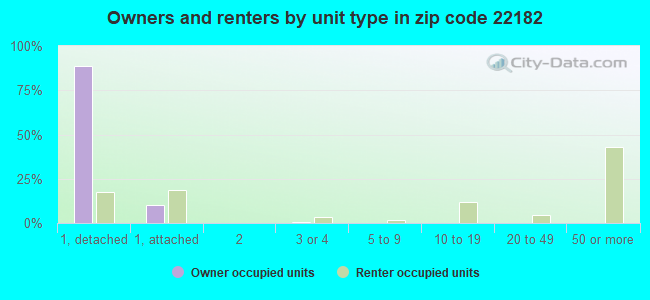
Estimated zip code population in 2022: 27,076 Zip code population in 2010: 24,863 Zip code population in 2000: 22,983
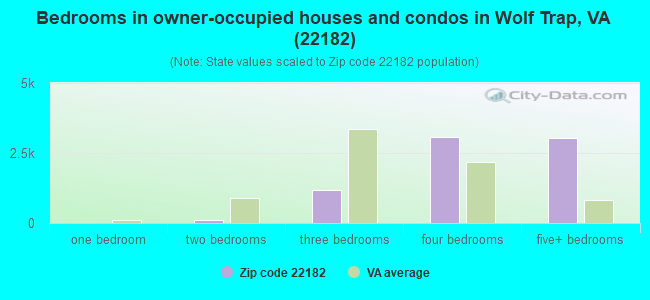
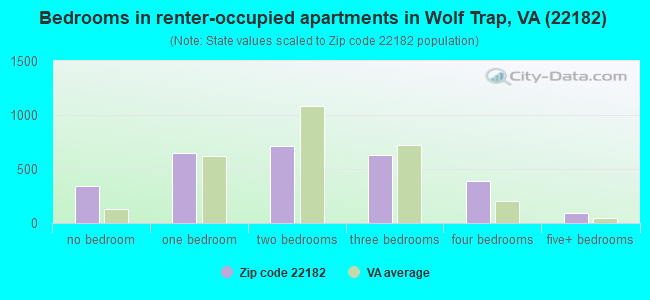
Houses and condos: 10,235 Renter-occupied apartments: 2,781
% of renters here:
28%
State:
33%
March 2022 cost of living index in zip code 22182: 169.2 (very high, U.S. average is 100)
Land area: 11.8 sq. mi. Water area: 0.1 sq. mi.
Population density: 2,303 people per square mile
(low).
OSM Map
General Map
Google Map
MSN Map
OSM Map
General Map
Google Map
MSN Map
OSM Map
General Map
Google Map
MSN Map
OSM Map
General Map
Google Map
MSN Map
Please wait while loading the map...
Real estate property taxes paid for housing units in 2022:
This zip code:
0.9% ($10,101)
Virginia:
0.7% ($2,617)
Median real estate property taxes paid for housing units with mortgages in 2022: $10,089 (0.9%) Median real estate property taxes paid for housing units with no mortgage in 2022: $10,355 (1.0%)
Estimated median house/condo value in 2022: $1,114,642
22182:
$1,114,642
Virginia:
$365,700
According to our research of Virginia and other state lists, there were 3 registered sex offenders living in 22182 zip code as of April 27, 2024. The ratio of all residents to sex offenders in zip code 22182 is 8,857 to 1. The ratio of registered sex offenders to all residents in this zip code is much lower than the state average.
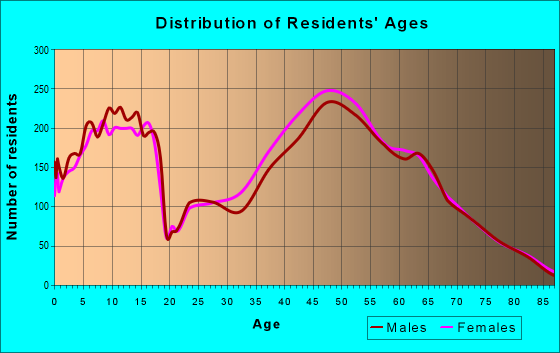
Median resident age:
This zip code:
43.8 years
Virginia median age:
39.0 years
Average household size:
This zip code:
2.7 people
Virginia:
2.5 people
Averages for the 2020 tax year for zip code 22182, filed in 2021:
Average Adjusted Gross Income (AGI) in 2020: $260,124 (Individual Income Tax Returns)
Here:
$260,124
State:
$86,446
Salary/wage: $170,835 (reported on 80.4% of returns)
Here:
$170,835
State:
$71,185
(% of AGI for various income ranges: 1311.8% for AGIs below $25k, 3881.2% for AGIs $25k-50k, 6936.1% for AGIs $50k-75k, 9975.8% for AGIs $75k-100k, 19547.8% for AGIs $100k-200k, 106454.4% for AGIs over 200k)
Taxable interest for individuals: $4,587 (reported on 60.0% of returns)
This zip code:
$4,587
Virginia:
$1,805
(% of AGI for various income ranges: 39.9% for AGIs below $25k, 89.5% for AGIs $25k-50k, 118.8% for AGIs $50k-75k, 147.7% for AGIs $75k-100k, 338.7% for AGIs $100k-200k, 2203.8% for AGIs over 200k)
Ordinary dividends: $16,307 (reported on 52.5% of returns)
Here:
$16,307
State:
$8,327
(% of AGI for various income ranges: 71.9% for AGIs below $25k, 179.4% for AGIs $25k-50k, 268.1% for AGIs $50k-75k, 406.0% for AGIs $75k-100k, 1057.8% for AGIs $100k-200k, 7056.2% for AGIs over 200k)
Net capital gain/loss in AGI: +$117,956 (reported on 49.7% of returns)
Here:
+$117,956
State:
+$24,644
(% of AGI for various income ranges: 59.4% for AGIs below $25k, 144.8% for AGIs $25k-50k, 183.0% for AGIs $50k-75k, 443.0% for AGIs $75k-100k, 1232.2% for AGIs $100k-200k, 58363.8% for AGIs over 200k)
Profit/loss from business: +$32,919 (reported on 20.4% of returns)
Here:
+$32,919
State:
+$12,836
(% of AGI for various income ranges: 176.2% for AGIs below $25k, 360.5% for AGIs $25k-50k, 218.1% for AGIs $50k-75k, 300.0% for AGIs $75k-100k, 949.1% for AGIs $100k-200k, 5129.2% for AGIs over 200k)
Taxable individual retirement arrangement distribution: $37,126 (reported on 11.2% of returns)
22182:
$37,126
Virginia:
$21,535
(% of AGI for various income ranges: 64.4% for AGIs below $25k, 110.4% for AGIs $25k-50k, 329.7% for AGIs $50k-75k, 462.5% for AGIs $75k-100k, 1049.8% for AGIs $100k-200k, 2524.2% for AGIs over 200k)
Self-employed (Keogh) retirement plans: $40,608 (reported on 3.8% of returns)
22182:
$40,608
Virginia:
$31,172
(% of AGI for various income ranges: 126.7% for AGIs $100k-200k, 1463.7% for AGIs over 200k)
Total itemized deductions: $40,912 (reported on 33.4% of returns)
Here:
$40,912
State:
$33,287
(% of AGI for various income ranges: 169.6% for AGIs below $25k, 420.2% for AGIs $25k-50k, 681.5% for AGIs $50k-75k, 1068.8% for AGIs $75k-100k, 2540.4% for AGIs $100k-200k, 9816.0% for AGIs over 200k)
Charity contributions: $11,820 (reported on 27.8% of returns)
Here:
$11,820
State:
$10,381
(% of AGI for various income ranges: 7.2% for AGIs below $25k, 31.4% for AGIs $25k-50k, 65.9% for AGIs $50k-75k, 115.4% for AGIs $75k-100k, 418.4% for AGIs $100k-200k, 2786.8% for AGIs over 200k)
Taxes paid: $9,614 (reported on 33.4% of returns)
22182:
$9,614
State:
$8,284
(% of AGI for various income ranges: 38.8% for AGIs below $25k, 101.9% for AGIs $25k-50k, 191.2% for AGIs $50k-75k, 309.6% for AGIs $75k-100k, 743.6% for AGIs $100k-200k, 2097.1% for AGIs over 200k)
Earned income credit: $1,520 (reported on 3.8% of returns)
Here:
$1,520
State:
$2,214
(% of AGI for various income ranges: 31.3% for AGIs below $25k, 34.7% for AGIs $25k-50k)
Percentage of individuals using paid preparers for their 2020 taxes: 90.6%
Here:
91%
State:
92%
(% for various income ranges: 88.4% for AGIs below $25k, 90.8% for AGIs $25k-50k, 91.7% for AGIs $50k-75k, 90.0% for AGIs $75k-100k, 89.5% for AGIs $100k-200k, 92.3% for AGIs over 200k)
Averages for the 2012 tax year for zip code 22182, filed in 2013:
Average Adjusted Gross Income (AGI) in 2012: $204,722 (Individual Income Tax Returns)
Here:
$204,722
State:
$71,192
Salary/wage: $145,518 (reported on 83.0% of returns)
Here:
$145,518
State:
$59,229
(% of AGI for various income ranges: 81.7% for AGIs below $25k, 74.5% for AGIs $25k-50k, 75.0% for AGIs $50k-75k, 70.2% for AGIs $75k-100k, 70.6% for AGIs $100k-200k, 54.6% for AGIs over 200k)
Taxable interest for individuals: $3,439 (reported on 65.0% of returns)
This zip code:
$3,439
Virginia:
$1,600
(% of AGI for various income ranges: 2.2% for AGIs below $25k, 1.8% for AGIs $25k-50k, 1.4% for AGIs $50k-75k, 1.0% for AGIs $75k-100k, 0.9% for AGIs $100k-200k, 1.1% for AGIs over 200k)
Ordinary dividends: $14,031 (reported on 52.3% of returns)
Here:
$14,031
State:
$6,959
(% of AGI for various income ranges: 5.6% for AGIs below $25k, 3.0% for AGIs $25k-50k, 3.0% for AGIs $50k-75k, 2.9% for AGIs $75k-100k, 2.9% for AGIs $100k-200k, 3.8% for AGIs over 200k)
Net capital gain/loss in AGI: +$30,799 (reported on 46.5% of returns)
Here:
+$30,799
State:
+$16,672
(% of AGI for various income ranges: 0.9% for AGIs below $25k, 0.6% for AGIs $25k-50k, 0.8% for AGIs $50k-75k, 0.6% for AGIs $75k-100k, 1.3% for AGIs $100k-200k, 9.1% for AGIs over 200k)
Profit/loss from business: +$40,381 (reported on 20.4% of returns)
Here:
+$40,381
State:
+$14,116
(% of AGI for various income ranges: 11.2% for AGIs below $25k, 6.4% for AGIs $25k-50k, 5.3% for AGIs $50k-75k, 4.6% for AGIs $75k-100k, 4.5% for AGIs $100k-200k, 3.7% for AGIs over 200k)
Taxable individual retirement arrangement distribution: $25,927 (reported on 13.5% of returns)
22182:
$25,927
Virginia:
$16,667
(% of AGI for various income ranges: 3.2% for AGIs below $25k, 2.0% for AGIs $25k-50k, 2.1% for AGIs $50k-75k, 2.8% for AGIs $75k-100k, 3.5% for AGIs $100k-200k, 1.2% for AGIs over 200k)
Self-employment retirement plans: $30,118 (reported on 4.7% of returns)
22182:
$30,118
Virginia:
$25,373
(% of AGI for various income ranges: 0.8% for AGIs $50k-75k, 0.5% for AGIs $100k-200k, 0.8% for AGIs over 200k)
Total itemized deductions: $55,360 (19% of AGI, reported on 64.4% of returns)
Here:
$55,360
State:
$26,596
Here:
18.6% of AGI
State:
20.1% of AGI
(% of AGI for various income ranges: 22.6% for AGIs below $25k, 19.0% for AGIs $25k-50k, 18.9% for AGIs $50k-75k, 19.1% for AGIs $75k-100k, 19.8% for AGIs $100k-200k, 16.6% for AGIs over 200k)
Charity contributions: $6,908 (reported on 56.1% of returns)
Here:
$6,908
State:
$4,443
(% of AGI for various income ranges: 0.9% for AGIs below $25k, 1.3% for AGIs $25k-50k, 1.5% for AGIs $50k-75k, 1.8% for AGIs $75k-100k, 2.0% for AGIs $100k-200k, 1.9% for AGIs over 200k)
Taxes paid: $23,612 (reported on 64.2% of returns)
22182:
$23,612
State:
$9,951
(% of AGI for various income ranges: 4.6% for AGIs below $25k, 5.5% for AGIs $25k-50k, 6.3% for AGIs $50k-75k, 7.4% for AGIs $75k-100k, 8.7% for AGIs $100k-200k, 7.2% for AGIs over 200k)
Earned income credit: $1,565 (reported on 3.7% of returns)
Here:
$1,565
State:
$2,211
(% of AGI for various income ranges: 2.4% for AGIs below $25k, 0.3% for AGIs $25k-50k)
Percentage of individuals using paid preparers for their 2012 taxes: 47.5%
Here:
47%
State:
46%
(% for various income ranges: 40.0% for AGIs below $25k, 45.8% for AGIs $25k-50k, 44.4% for AGIs $50k-75k, 45.2% for AGIs $75k-100k, 44.9% for AGIs $100k-200k, 57.1% for AGIs over 200k)
Averages for the 2004 tax year for zip code 22182, filed in 2005:
Average Adjusted Gross Income (AGI) in 2004: $150,124 (Individual Income Tax Returns)
Here:
$150,124
State:
$56,704
Salary/wage: $119,369 (reported on 82.5% of returns)
Here:
$119,369
State:
$48,441
(% of AGI for various income ranges: 307.7% for AGIs below $10k, 74.7% for AGIs $10k-25k, 75.5% for AGIs $25k-50k, 70.5% for AGIs $50k-75k, 68.4% for AGIs $75k-100k, 64.5% for AGIs over 100k)
Taxable interest for individuals: $3,586 (reported on 72.4% of returns)
This zip code:
$3,586
Virginia:
$1,688
(% of AGI for various income ranges: 26.4% for AGIs below $10k, 3.1% for AGIs $10k-25k, 2.6% for AGIs $25k-50k, 2.3% for AGIs $50k-75k, 2.3% for AGIs $75k-100k, 1.6% for AGIs over 100k)
Taxable dividends: $5,513 (reported on 57.9% of returns)
Here:
$5,513
State:
$4,028
(% of AGI for various income ranges: 35.9% for AGIs below $10k, 3.8% for AGIs $10k-25k, 2.6% for AGIs $25k-50k, 3.1% for AGIs $50k-75k, 2.8% for AGIs $75k-100k, 2.0% for AGIs over 100k)
Net capital gain/loss: +$32,067 (reported on 52.6% of returns)
Here:
+$32,067
State:
+$14,375
(% of AGI for various income ranges: -6.1% for AGIs below $10k, 2.1% for AGIs $10k-25k, 1.1% for AGIs $25k-50k, 1.2% for AGIs $50k-75k, 1.3% for AGIs $75k-100k, 12.7% for AGIs over 100k)
Profit/loss from business: +$34,063 (reported on 18.3% of returns)
Here:
+$34,063
State:
+$13,342
(% of AGI for various income ranges: 12.2% for AGIs below $10k, 7.6% for AGIs $10k-25k, 7.4% for AGIs $25k-50k, 4.4% for AGIs $50k-75k, 4.3% for AGIs $75k-100k, 4.0% for AGIs over 100k)
IRA payment deduction: $3,639 (reported on 3.8% of returns)
22182:
$3,639
Virginia:
$2,943
(% of AGI for various income ranges: 1.9% for AGIs below $10k, 0.3% for AGIs $10k-25k, 0.3% for AGIs $25k-50k, 0.2% for AGIs $50k-75k, 0.3% for AGIs $75k-100k, 0.1% for AGIs over 100k)
Self-employed pension: $22,612 (reported on 5.4% of returns)
Here:
$22,612
Virginia:
$17,430
(% of AGI for various income ranges: 0.3% for AGIs $25k-50k, 0.2% for AGIs $50k-75k, 0.6% for AGIs $75k-100k, 0.9% for AGIs over 100k)
Total itemized deductions: $37,286 (17% of AGI, reported on 65.0% of returns)
Here:
$37,286
State:
$21,492
Here:
17.0% of AGI
State:
21.0% of AGI
(% of AGI for various income ranges: 69.9% for AGIs below $10k, 22.6% for AGIs $10k-25k, 21.4% for AGIs $25k-50k, 24.1% for AGIs $50k-75k, 24.5% for AGIs $75k-100k, 15.0% for AGIs over 100k)
Charity contributions deductions: $5,939 (3% of AGI, reported on 59.8% of returns)
Here:
$5,939
State:
$3,794
Here:
2.6% of AGI
State:
3.5% of AGI
(% of AGI for various income ranges: 1.9% for AGIs below $10k, 1.2% for AGIs $10k-25k, 1.8% for AGIs $25k-50k, 2.4% for AGIs $50k-75k, 2.6% for AGIs $75k-100k, 2.4% for AGIs over 100k)
Total tax: $33,572 (reported on 86.3% of returns)
22182:
$33,572
State:
$9,537
(% of AGI for various income ranges: 14.2% for AGIs below $10k, 5.2% for AGIs $10k-25k, 8.7% for AGIs $25k-50k, 10.2% for AGIs $50k-75k, 10.9% for AGIs $75k-100k, 20.6% for AGIs over 100k)
Earned income credit: $1,322 (reported on 2.8% of returns)
Here:
$1,322
State:
$1,734
Percentage of individuals using paid preparers for their 2004 taxes: 48.3%
Here:
48%
State:
52%
(% for various income ranges: 44.0% for AGIs below $10k, 43.3% for AGIs $10k-25k, 48.6% for AGIs $25k-50k, 46.0% for AGIs $50k-75k, 46.5% for AGIs $75k-100k, 51.7% for AGIs over 100k)
Likely homosexual households (counted as self-reported same-sex unmarried-partner households)
Lesbian couples: 0.2% of all households
Gay men: 0.2% of all households
Household received Food Stamps/SNAP in the past 12 months: 196 Household did not receive Food Stamps/SNAP in the past 12 months: 9,746
Women who had a birth in the past 12 months: 267 (275 now married, 0 unmarried) Women who did not have a birth in the past 12 months: 5,251 (2,817 now married, 2,411 unmarried)
Housing units in zip code 22182 with a mortgage: 5,037 (867 second mortgage, 60 home equity loan, 774 both second mortgage and home equity loan) Houses without a mortgage: 138
Median monthly owner costs for units with a mortgage: $3,812 Median monthly owner costs for units without a mortgage: $1,277
Residents with income below the poverty level in 2022:
This zip code:
4.4%
Whole state:
10.6%
Residents with income below 50% of the poverty level in 2022:
This zip code:
1.4%
Whole state:
5.2%
Median number of rooms in houses and condos:
Here:
10.0
State:
7.0
Median number of rooms in apartments:
Here:
4.1
State:
4.3
Notable locations in this zip code not listed on our city pages
Notable locations in zip code 22182: Filene Center (A), Cedar Hill Office Center (B), Fairfax County Fire / Rescue Wolftrap Station 42 (C), Fairfax County Fire and Rescue Department Station 13 Dunn Loring (D), Fairfax County Fire and Rescue Department Station 29 Tysons Corners (E), Department of Motor Vehicles Tysons Corner (F). Display/hide their locations on the map
Churches in zip code 22182 include: Christian Fellowship Church (A), Christian Assembly Church (B), Berea Church of Christ (C), Peace Baptist Church (D), Our Lady of Good Counsel Church (E), Cartersville Baptist Church (F), Saint Mark Coptic Orthodox Church (G), Saint Athanasius Church (H), Antioch Church (I). Display/hide their locations on the map
Parks in zip code 22182 include: Raglan Road Park (1), Freedom Hill Park (2), Wolf Trails Park (3), Tamarack Park (4), Symphony Hill Park (5), Sun Valley Park (6), Foxstone Park (7), Clarke Crossing Park (8), Wolf Trap National Park for the Performing Arts (9). Display/hide their locations on the map
5,399 married couples with children.
575 single-parent households (298 men, 277 women).
64.4% of residents of 22182 zip code speak English at home.
7.9% of residents speak Spanish at home (79% very well, 19% well, 2% not well).
12.0% of residents speak other Indo-European language at home (74% very well, 14% well, 7% not well, 5% not at all).
12.6% of residents speak Asian or Pacific Island language at home (64% very well, 25% well, 9% not well, 1% not at all).
3.6% of residents speak other language at home (84% very well, 12% well, 4% not well).
Foreign born population: 8,431 (31.1%) (74.4% of them are naturalized citizens)
This zip code:
31.1%
Whole state:
12.7%
17%Bhutan
8%Japan
7%India
5%Honduras
4%Thailand
3%Hong Kong
3%Nicaragua
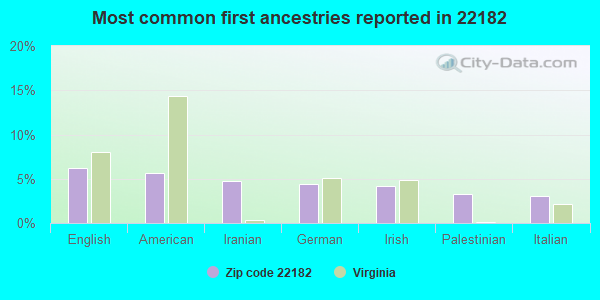
6%English
6%American
5%Iranian
4%German
4%Irish
3%Palestinian
3%Italian
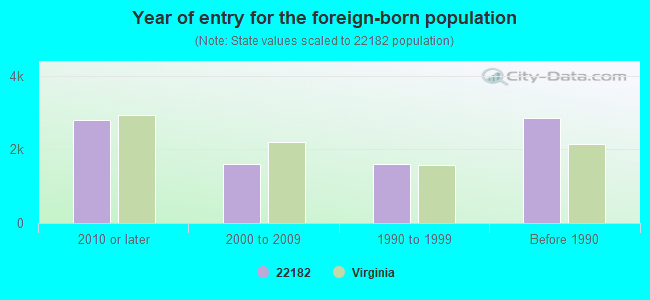
Year of entry for the foreign-born population
2,7842010 or later
1,6092000 to 2009
1,6041990 to 1999
2,850Before 1990
Facilities with environmental interests located in this zip code:
1951 KIDWELL ASSOCIATES (1951 KIDWELL DRIVE in VIENNA, VA)
AIR MINOR (AIRS/AFS) STATE MASTER (Virginia pollutants databases) - CEDS-71829, AIR PROGRAM Business SIC classification: OPERATORS OF NONRESIDENTIAL BUILDINGS Business NAICS classification: LESSORS OF NONRESIDENTIAL BUILDINGS (EXCEPT MINIWAREHOUSES).
ABOVENET COMMUNICATIONS (2051 CHAIN BRIDGE ROAD in VIENNA, VA)
AIR MINOR (AIRS/AFS) STATE MASTER (Virginia pollutants databases) - CEDS-73141, AIR PROGRAM Business SIC classification: COMPUTER RELATED SERVICES Business NAICS classification: DATA PROCESSING, HOSTING, AND RELATED SERVICES.
ANDREW CHAPEL ELEM. (1400 TRAP RD. in VIENNA, VA)
(National Center for Education Statistics) - STATE ID-0292234 Organizations: FAIRFAX COUNTY PUBLIC SCHOOLS (SCHOOL DISTRICT)
AMOCO #462-TANKS (8217 LEESBURG PK in VIENNA, VA)
Small Quantity Generators, between 100 kg and 1000 kg of hazardous waste/month (Resource Conservation and Recovery Act (tracking hazardous waste)) - notification Organizations: OPERNAME (CONTACT/OPERATOR)
, AMOCO OIL COMPANY (CONTACT/OWNER)
AREA 6 MANAGEMENT (1410 HUNTER MILL RD in VIENNA, VA)
Conditionally Exempt Small Quantity Generators, less than 100 kg/month of hazardous waste (Resource Conservation and Recovery Act (tracking hazardous waste)) - notification Organizations: OPERNAME (CONTACT/OPERATOR)
, FAIRFAX COUNTY PARK AUTHORITY (CONTACT/OWNER)
Alternative names: DIST 4 MAINTENANCE FACITLITY
Housing units lacking complete plumbing facilities: 0.1% Housing units lacking complete kitchen facilities: 0.2%
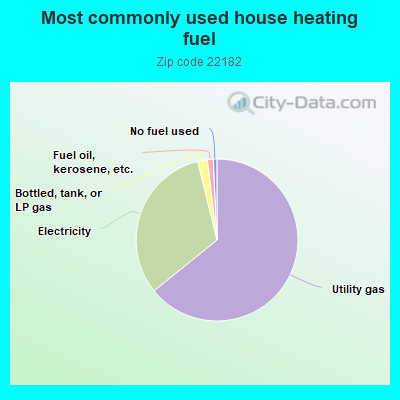
64.0%Utility gas
31.9%Electricity
1.9%Bottled, tank, or LP gas
1.2%Fuel oil, kerosene, etc.
0.7%No fuel used
Population in 1990: 19,121. Population change in the 1990s: +3,862 (+20.2%).
Place of birth for U.S.-born residents:
This state: 6,460
Northeast: 4,029
Midwest: 2,129
South: 4,549
West: 1,153
57% of the 22182 zip code residents lived in the same house 5 years ago. Out of people who lived in different houses, 48% lived in this county. Out of people who lived in different counties, 50% lived in Virginia.
89% of the 22182 zip code residents lived in the same house 1 year ago. Out of people who lived in different houses, 51% moved from this county. Out of people who lived in different houses, 13% moved from different county within same state. Out of people who lived in different houses, 25% moved from different state. Out of people who lived in different houses, 9% moved from abroad.
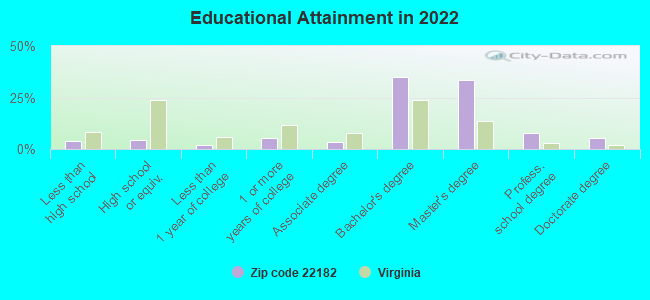
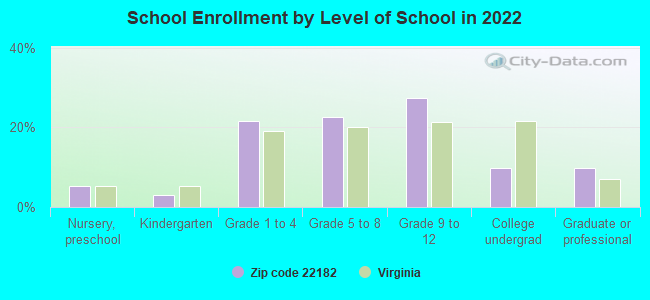
Private vs. public school enrollment:
Students in private schools in grades 1 to 8 (elementary and middle school): 527
Here:
16.4%
Virginia:
13.2%
Students in private schools in grades 9 to 12 (high school): 445
Here:
22.7%
Virginia:
10.2%
Students in private undergraduate colleges: 235
Here:
33.4%
Virginia:
18.7%
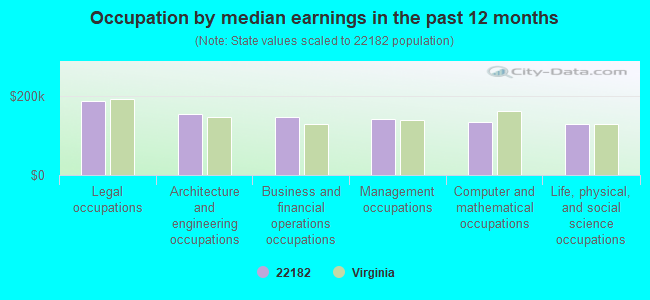
Occupation by median earnings in the past 12 months ($)
188,613Legal occupations
155,469Architecture and engineering occupations
147,077Business and financial operations occupations
142,030Management occupations
134,859Computer and mathematical occupations
130,389Life, physical, and social science occupations
Companies with biggest federal contracts located in this zip code (VIENNA, VA):
MCI WORLDCOM COMMUNICATIONS, I (1945 OLD GALLOWS ROAD) : $972,671,472 in 9913 contractsfrom 1999 to 2006
Contracts for ADP Telecommunications and Transmission Services, Other ADP and Telecommunications Services (includes data storage on tapes, compact disks, etc.), Telecommunications Network Management Services, Telephone and/or Communications Services (includes Telegraph, Telex, and Cablevision Services), and moreby Department of Defense, Defense Information Systems Agency, ENERGY, Department of, Immediate Office of the Secretary of Transportation, and others Signed by year:2000: $6,020,360; 2001: $389,267,631; 2002: -$308,328; 2003: $390,140,119; 2004: $149,288,615; 2005: $23,021,523; 2006: $15,191,552.
Biggest contracts:
$229,187,840 with Department of Defense for ADP Telecommunications and Transmission Services. Signed on 2001-10-31. Completion date: 2007-03-20.
$97,411,460, same as above.Signed on 2001-12-31. Completion date: 2007-01-15.
$63,402,027, same as above.Signed on 2003-09-30. Completion date: 2007-03-12.
$61,850,179, same as above.Signed on 2002-03-31. Completion date: 2002-03-12.
NJVC,LLC (8614 WESTWOOD CENTER DRIVE; small business) : $970,259,003 in 111 contractsfrom 2001 to 2006
Contracts for Engineering and Technical Services, Maintenance, Repair and Rebuilding of Equipment -- Special Industry Machinery by Department of Defense, National Geospatial-Intelligence Agency Signed by year:2000: $0; 2001: $4,000,000; 2002: $101,559,252; 2003: $156,560,856; 2004: $183,678,957; 2005: $341,954,417; 2006: $182,505,521.
Biggest contracts:
$63,815,489 with Department of Defense for Engineering and Technical Services. Signed on 2005-07-21. Completion date: 2016-12-31.
$60,951,306 with National Geospatial-Intelligence Agency for Engineering and Technical Services. Signed on 2006-02-10. Completion date: 2016-12-31.
$53,818,956 with Department of Defense for Engineering and Technical Services. Signed on 2005-02-08. Completion date: 2016-12-31.
$45,000,000 with Department of Defense for Maintenance, Repair and Rebuilding of Equipment -- Special Industry Machinery. Taking place in MD. Signed on 2002-11-26. Completion date: 2016-12-31.
CENTENNIAL CONTRACTORS ENTERPR (8500 LEESBURG PIKE, SUITE) : $645,151,782 in 6843 contractsfrom 1999 to 2006
Contracts for Maintenance, Repair or Alteration of Real Property -- Miscellaneous Buildings, Construction of Structures and Facilities -- Other Administrative Facilities and Service Buildings, Construction of Structures and Facilities -- Airport Runways, Maintenance, Repair or Alteration of Real Property -- Other Non-Building Facilities, and moreby Navy, Army, Air Force, Public Buildings Service, and others Signed by year:2000: $109,241,458; 2001: $112,265,694; 2002: $131,978,051; 2003: $122,660,953; 2004: $79,288,429; 2005: $66,876,210; 2006: $14,196,285.
Biggest contracts:
$6,495,049 with Navy for Maintenance, Repair or Alteration of Real Property -- Miscellaneous Buildings. Signed on 2003-11-04. Completion date: 2005-06-28.
$5,608,969, same as above.Signed on 2002-05-20. Completion date: 2003-09-17.
$5,351,255 with Navy for Construction of Structures and Facilities -- Other Administrative Facilities and Service Buildings. Signed on 2001-03-16. Completion date: 2001-12-26.
$5,098,446 with Navy for Maintenance, Repair or Alteration of Real Property -- Miscellaneous Buildings. Signed on 2002-03-15. Completion date: 2004-02-28.
SAIC INFORMATION SERVICES SECT (7990 SCNCE APPLCTIONS CT) : $502,969,238 in 554 contractsfrom 1999 to 2004
Contracts for Automated Information System Design and Integration Services, Other ADP and Telecommunications Services (includes data storage on tapes, compact disks, etc.), ADP Facility Operation and Maintenance Services, ADPE System Configuration, and moreby Army, Department of Defense, NASA, Navy, and others Signed by year:2000: $233,749,303; 2001: $82,220,952; 2002: $67,015,064; 2003: $8,855,624; 2004: -$457,872; 2005: $0; 2006: $0.
Biggest contracts:
$69,748,798 with Army for Automated Information System Design and Integration Services. Signed on 2000-10-31. Completion date: 2001-09-30.
$53,051,587, same as above.Signed on 1999-12-10. Completion date: 1999-12-10.
$22,211,439, same as above.Signed on 2002-09-26. Completion date: 2002-09-26.
$18,150,207, same as above.Signed on 2002-07-16. Completion date: 2002-09-30.
N E T FEDERAL, INC (8300 BOONE BLVD , SUITE 60) : $304,493,966 in 1729 contractsfrom 1999 to 2006
Contracts for Lease or Rental of Equipment -- Communication, Detection, and Coherent Radiation Equipment, Miscellaneous Communication Equipment, ADP Input/Output and Storage Devices, Other ADP and Telecommunications Services (includes data storage on tapes, compact disks, etc.), and moreby Department of Defense, Defense Information Systems Agency, Federal Technology Service, Air Force, and others Signed by year:2000: $45,798,355; 2001: $54,022,324; 2002: $54,198,836; 2003: $47,034,880; 2004: $36,538,890; 2005: $25,802,435; 2006: $8,403,276.
Biggest contracts:
$6,286,452 with Department of Defense for Lease or Rental of Equipment -- Communication, Detection, and Coherent Radiation Equipment. Signed on 1999-10-01. Completion date: 2000-09-30.
$4,577,586 with Defense Information Systems Agency for Miscellaneous Communication Equipment. Signed on 2003-11-20. Completion date: 2005-01-13.
$4,502,799 with Department of Defense for Lease or Rental of Equipment -- Communication, Detection, and Coherent Radiation Equipment. Signed on 2000-11-02. Completion date: 2001-07-11.
$4,403,472, same as above.Signed on 1999-10-01. Completion date: 2000-09-30.
ANHAM JOINT VENTURE (8075 LEESBURG PIKE, STE 76) : $257,227,961 in 18 contractsfrom 2004 to 2006
Contracts for Trucks and Truck Tractors, Wheeled by Army Signed by year:2000: $0; 2001: $0; 2002: $0; 2003: $0; 2004: $257,837,992; 2005: -$5,275; 2006: -$604,756.
Biggest contracts:
$123,555,478 with Army for Trucks and Truck Tractors, Wheeled. Signed on 2004-07-16. Completion date: 2006-09-30.
$120,125,150, same as above.Signed on 2004-05-25. Completion date: 2006-09-30.
$10,317,895, same as above.Signed on 2004-09-20. Completion date: 2006-09-30.
$1,268,798, same as above.Signed on 2004-07-07. Completion date: 2006-09-30.
JIL INFORMATION SYSTEMS, INC (1608 SPRING HILL ROAD; small business) : $124,594,058 in 492 contractsfrom 1999 to 2006
Contracts for ADP Facility Operation and Maintenance Services, Automated Information System Design and Integration Services, AIDS Training, Other ADP and Telecommunications Services (includes data storage on tapes, compact disks, etc.), and moreby Federal Technology Service, Department of Defense, Navy, Transportation Security Administration, and others Signed by year:2000: $27,850,907; 2001: $13,609,378; 2002: $12,133,492; 2003: $15,543,098; 2004: $27,234,838; 2005: $17,257,493; 2006: $3,283,651.
Biggest contracts:
$6,297,722 with Federal Technology Service for ADP Facility Operation and Maintenance Services. Taking place in FL. Signed on 2004-09-07. Completion date: 2005-01-07.
$4,151,513 with Department of Defense for Automated Information System Design and Integration Services. Signed on 2000-11-09. Completion date: 2001-09-30.
$4,057,627, same as above.Signed on 1999-11-19. Completion date: 2000-09-30.
$4,019,608 with Navy for AIDS Training. Signed on 2005-05-24. Completion date: 2006-05-31.
ASPENMED SERVICES, INC (8150 LEESBURG PIKE) : $106,425,045 in 230 contractsfrom 2000 to 2006
Contracts for General Health Care Services, Other Professional Services, Nursing Services, Other Medical Services, and moreby Drug Enforcement Administration, Office of Assistant Secretary for Health except national centers (disused code), Health Resources and Services Administration, Navy, and others Signed by year:2000: $15,581,985; 2001: $40,168,211; 2002: $10,492,228; 2003: $14,531,036; 2004: $11,575,637; 2005: $11,752,340; 2006: $2,323,608.
Biggest contracts:
$11,280,000 with Drug Enforcement Administration for General Health Care Services. Signed on 2001-05-15. Completion date: 2001-12-15.
$11,280,000, same as above.Signed on 2001-05-15. Completion date: 2001-12-15.
$8,474,995 with Office of Assistant Secretary for Health except national centers (disused code) for Other Professional Services. Taking place in DC. Signed on 2003-10-09. Completion date: 2004-07-31.
$7,374,000, same as above.Signed on 2000-11-15. Completion date: 2001-07-15.
DELEX SYSTEMS, INCORPORATED (1953 GALLOWS ROAD; small business) : $76,425,347 in 200 contractsfrom 1999 to 2006
Contracts for Armament Training Devices, Program Review/Development Services, Engineering and Technical Services, Training Aids, and moreby Navy, Army, Department of Defense, Federal Technology Service, and others Signed by year:2000: $9,947,253; 2001: $10,952,431; 2002: $6,677,371; 2003: $14,031,973; 2004: $20,015,600; 2005: $9,201,490; 2006: $2,524,257.
Biggest contracts:
$6,877,780 with Navy for Armament Training Devices. Signed on 2004-01-29. Completion date: 2009-01-26.
$3,494,338 with Navy for Program Review/Development Services. Taking place in CA. Signed on 2003-08-01. Completion date: 2004-08-01.
$2,078,152 with Navy for Engineering and Technical Services. Taking place in MD. Signed on 2003-07-09. Completion date: 2004-07-08.
$1,778,607 with Navy for Training Aids. Taking place in WA. Signed on 2004-10-04. Completion date: 2004-09-30.
BCS TECHNOLOGIES CORPORATION (1950 OLD GALLOWS ROAD) : $44,249,139 in 127 contractsfrom 1999 to 2005
Contracts for Other ADP and Telecommunications Services (includes data storage on tapes, compact disks, etc.), Services -- Basic Research (R&D), Other Medical Services, Educational Services, and moreby Army, Department of Defense, Federal Technology Service, Department of Veterans Affairs, and others Signed by year:2000: $31,507,833; 2001: $9,964,685; 2002: $2,375,676; 2003: $122,597; 2004: -$502,262; 2005: $72,270; 2006: $0.
Biggest contracts:
$5,199,273 with Army for Other ADP and Telecommunications Services (includes data storage on tapes, compact disks, etc.). Signed on 2000-03-08. Completion date: 2000-09-30.
$3,917,874, same as above.Signed on 2000-02-25. Completion date: 2000-09-30.
$3,688,507, same as above.Signed on 2000-03-01. Completion date: 2000-09-30.
$2,437,981 with Army for Services -- Basic Research (R&D). Signed on 2000-04-07. Completion date: 2000-12-05.
Top industries in this zip code by the number of employees in 2005:
Arts, Entertainment, and Recreation: Other Performing Arts Companies (over 1000: 1, 500-999: 1)
Real Estate and Rental and Leasing: Residential Property Managers (over 1000: 1, 250-499: 1, 100-249: 2, 5-9: 3, 1-4: 2)
Professional, Scientific, and Technical Services: Research and Development in the Physical, Engineering, and Life Sciences (500-999: 2, 250-499: 1, 10-19: 2, 5-9: 2, 1-4: 7)
Administrative and Support and Waste Management and Remediation Services: Security Guards and Patrol Services (over 1000: 1, 1-4: 1)
Professional, Scientific, and Technical Services: Administrative Management and General Management Consulting Services (100-249: 5, 50-99: 4, 20-49: 7, 10-19: 1, 5-9: 6, 1-4: 43)
Administrative and Support and Waste Management and Remediation Services: Temporary Help Services (100-249: 4, 50-99: 3, 20-49: 6, 10-19: 3, 5-9: 3, 1-4: 9)
Professional, Scientific, and Technical Services: Other Computer Related Services (100-249: 4, 50-99: 2, 20-49: 4, 10-19: 3, 1-4: 15)
People in group quarters in 2010:
11 people in group homes intended for adults
8 people in residential treatment centers for juveniles (non-correctional)
6 people in other noninstitutional facilities
3 people in residential treatment centers for adults
People in group quarters in 2000:
11 people in homes for the mentally retarded
5 people in homes or halfway houses for drug/alcohol abuse
Fatal accident statistics in 2014:
Fatal accident count: 1
Vehicles involved in fatal accidents: 1
Fatal accidents caused by drunken drivers: 0
Fatalities: 1
Persons involved in fatal accidents: 1
Pedestrians involved in fatal accidents: 0
Fatal accident statistics in 2012:
Fatal accident count: 2
Vehicles involved in fatal accidents: 4
Fatal accidents caused by drunken drivers: 0
Fatalities: 2
Persons involved in fatal accidents: 6
Pedestrians involved in fatal accidents: 0
Home Mortgage Disclosure Act Aggregated Statistics For Year 2009 (Based on 4 full and 12 partial tracts)
A) FHA, FSA/RHS & VA Home Purchase Loans
B) Conventional Home Purchase Loans
C) Refinancings
D) Home Improvement Loans
F) Non-occupant Loans on < 5 Family Dwellings (A B C & D)
Number
Average Value
Number
Average Value
Number
Average Value
Number
Average Value
Number
Average Value
LOANS ORIGINATED
127
$538,901
468
$532,529
2,632
$390,459
72
$233,654
93
$327,627
APPLICATIONS APPROVED, NOT ACCEPTED
6
$681,115
24
$508,947
184
$399,741
3
$9,620
4
$259,460
APPLICATIONS DENIED
13
$590,772
56
$625,978
329
$494,966
13
$147,390
26
$332,649
APPLICATIONS WITHDRAWN
21
$453,258
81
$563,555
479
$421,349
14
$334,505
21
$273,861
FILES CLOSED FOR INCOMPLETENESS
2
$512,990
16
$462,921
106
$464,784
5
$425,470
2
$334,770
Aggregated Statistics For Year 2008 (Based on 4 full and 12 partial tracts)
A) FHA, FSA/RHS & VA Home Purchase Loans
B) Conventional Home Purchase Loans
C) Refinancings
D) Home Improvement Loans
F) Non-occupant Loans on < 5 Family Dwellings (A B C & D)
G) Loans On Manufactured Home Dwelling (A B C & D)
Number
Average Value
Number
Average Value
Number
Average Value
Number
Average Value
Number
Average Value
Number
Average Value
LOANS ORIGINATED
48
$494,949
461
$463,968
734
$387,105
72
$142,564
39
$323,100
0
$0
APPLICATIONS APPROVED, NOT ACCEPTED
8
$480,280
67
$517,308
125
$376,028
12
$93,245
10
$406,516
0
$0
APPLICATIONS DENIED
7
$543,076
68
$479,954
198
$488,347
31
$234,414
13
$190,890
1
$52,980
APPLICATIONS WITHDRAWN
7
$451,250
88
$605,544
203
$419,671
11
$212,067
16
$278,745
0
$0
FILES CLOSED FOR INCOMPLETENESS
0
$0
8
$451,248
33
$425,379
4
$77,885
0
$0
0
$0
Aggregated Statistics For Year 2007 (Based on 4 full and 12 partial tracts)
A) FHA, FSA/RHS & VA Home Purchase Loans
B) Conventional Home Purchase Loans
C) Refinancings
D) Home Improvement Loans
E) Loans on Dwellings For 5+ Families
F) Non-occupant Loans on < 5 Family Dwellings (A B C & D)
Number
Average Value
Number
Average Value
Number
Average Value
Number
Average Value
Number
Average Value
Number
Average Value
LOANS ORIGINATED
3
$294,697
820
$453,424
812
$398,760
135
$168,337
0
$0
65
$371,673
APPLICATIONS APPROVED, NOT ACCEPTED
0
$0
115
$452,449
176
$363,012
19
$125,171
0
$0
17
$335,366
APPLICATIONS DENIED
0
$0
77
$558,754
286
$426,047
39
$152,233
0
$0
30
$420,086
APPLICATIONS WITHDRAWN
0
$0
194
$413,778
165
$429,934
17
$290,184
11
$263,095
43
$389,516
FILES CLOSED FOR INCOMPLETENESS
0
$0
12
$616,004
56
$550,058
4
$231,235
0
$0
5
$412,280
Aggregated Statistics For Year 2006 (Based on 4 full and 12 partial tracts)
A) FHA, FSA/RHS & VA Home Purchase Loans
B) Conventional Home Purchase Loans
C) Refinancings
D) Home Improvement Loans
F) Non-occupant Loans on < 5 Family Dwellings (A B C & D)
Number
Average Value
Number
Average Value
Number
Average Value
Number
Average Value
Number
Average Value
LOANS ORIGINATED
1
$294,580
879
$461,566
965
$416,375
151
$171,107
100
$450,567
APPLICATIONS APPROVED, NOT ACCEPTED
0
$0
96
$478,603
148
$362,283
34
$135,430
23
$346,620
APPLICATIONS DENIED
0
$0
91
$530,896
301
$447,951
37
$213,962
27
$449,337
APPLICATIONS WITHDRAWN
0
$0
101
$467,357
249
$438,405
14
$194,519
19
$492,778
FILES CLOSED FOR INCOMPLETENESS
0
$0
18
$612,122
53
$484,089
4
$99,640
6
$547,613
Aggregated Statistics For Year 2005 (Based on 4 full and 12 partial tracts)
A) FHA, FSA/RHS & VA Home Purchase Loans
B) Conventional Home Purchase Loans
C) Refinancings
D) Home Improvement Loans
F) Non-occupant Loans on < 5 Family Dwellings (A B C & D)
G) Loans On Manufactured Home Dwelling (A B C & D)
Number
Average Value
Number
Average Value
Number
Average Value
Number
Average Value
Number
Average Value
Number
Average Value
LOANS ORIGINATED
6
$220,493
1,175
$468,715
1,502
$406,288
174
$227,956
166
$379,651
0
$0
APPLICATIONS APPROVED, NOT ACCEPTED
0
$0
74
$538,631
159
$342,488
29
$266,982
12
$305,504
2
$48,170
APPLICATIONS DENIED
0
$0
118
$505,578
298
$412,140
39
$166,337
42
$492,527
0
$0
APPLICATIONS WITHDRAWN
2
$190,265
90
$519,674
233
$379,492
26
$254,696
26
$388,131
0
$0
FILES CLOSED FOR INCOMPLETENESS
0
$0
36
$534,228
46
$480,730
0
$0
5
$899,136
0
$0
Aggregated Statistics For Year 2004 (Based on 4 full and 12 partial tracts)
A) FHA, FSA/RHS & VA Home Purchase Loans
B) Conventional Home Purchase Loans
C) Refinancings
D) Home Improvement Loans
E) Loans on Dwellings For 5+ Families
F) Non-occupant Loans on < 5 Family Dwellings (A B C & D)
Number
Average Value
Number
Average Value
Number
Average Value
Number
Average Value
Number
Average Value
Number
Average Value
LOANS ORIGINATED
3
$224,780
1,411
$412,807
1,982
$344,269
133
$193,020
1
$15,601,280
177
$283,484
APPLICATIONS APPROVED, NOT ACCEPTED
0
$0
82
$378,722
221
$301,518
28
$102,448
2
$156,545
26
$256,023
APPLICATIONS DENIED
4
$163,460
133
$471,229
318
$369,341
38
$135,104
0
$0
22
$309,992
APPLICATIONS WITHDRAWN
3
$227,460
100
$423,277
273
$366,721
29
$153,014
0
$0
22
$321,632
FILES CLOSED FOR INCOMPLETENESS
0
$0
27
$380,464
66
$386,392
10
$202,737
0
$0
5
$323,654
Aggregated Statistics For Year 2003 (Based on 4 full and 12 partial tracts)
A) FHA, FSA/RHS & VA Home Purchase Loans
B) Conventional Home Purchase Loans
C) Refinancings
D) Home Improvement Loans
F) Non-occupant Loans on < 5 Family Dwellings (A B C & D)
Number
Average Value
Number
Average Value
Number
Average Value
Number
Average Value
Number
Average Value
LOANS ORIGINATED
16
$157,616
1,486
$348,590
6,348
$294,055
61
$131,465
206
$231,824
APPLICATIONS APPROVED, NOT ACCEPTED
0
$0
114
$350,096
586
$312,004
18
$63,941
32
$252,266
APPLICATIONS DENIED
0
$0
111
$350,420
450
$351,225
38
$99,924
19
$275,484
APPLICATIONS WITHDRAWN
0
$0
160
$390,002
500
$314,829
14
$77,671
43
$258,493
FILES CLOSED FOR INCOMPLETENESS
1
$237,100
44
$363,708
128
$343,073
5
$41,238
5
$297,320
Aggregated Statistics For Year 2002 (Based on 4 full and 12 partial tracts)
A) FHA, FSA/RHS & VA Home Purchase Loans
B) Conventional Home Purchase Loans
C) Refinancings
D) Home Improvement Loans
E) Loans on Dwellings For 5+ Families
F) Non-occupant Loans on < 5 Family Dwellings (A B C & D)
Number
Average Value
Number
Average Value
Number
Average Value
Number
Average Value
Number
Average Value
Number
Average Value
LOANS ORIGINATED
21
$137,357
1,386
$315,764
4,724
$290,839
61
$66,060
0
$0
172
$224,437
APPLICATIONS APPROVED, NOT ACCEPTED
0
$0
72
$308,781
369
$276,097
43
$105,209
0
$0
25
$243,101
APPLICATIONS DENIED
2
$103,560
90
$378,134
393
$291,502
38
$65,855
0
$0
26
$275,445
APPLICATIONS WITHDRAWN
5
$120,382
113
$305,461
389
$259,199
26
$160,717
1
$494,510
12
$219,904
FILES CLOSED FOR INCOMPLETENESS
0
$0
8
$406,366
130
$266,728
0
$0
0
$0
7
$194,393
Aggregated Statistics For Year 2001 (Based on 4 full and 12 partial tracts)
A) FHA, FSA/RHS & VA Home Purchase Loans
B) Conventional Home Purchase Loans
C) Refinancings
D) Home Improvement Loans
E) Loans on Dwellings For 5+ Families
F) Non-occupant Loans on < 5 Family Dwellings (A B C & D)
Number
Average Value
Number
Average Value
Number
Average Value
Number
Average Value
Number
Average Value
Number
Average Value
LOANS ORIGINATED
47
$143,586
1,589
$286,732
2,860
$269,127
110
$57,867
0
$0
134
$228,078
APPLICATIONS APPROVED, NOT ACCEPTED
1
$88,270
120
$256,411
219
$252,483
40
$81,264
0
$0
13
$235,833
APPLICATIONS DENIED
6
$193,025
93
$303,480
249
$237,037
25
$54,573
0
$0
16
$241,631
APPLICATIONS WITHDRAWN
3
$149,720
143
$283,345
315
$224,187
41
$64,643
1
$8,776,800
22
$195,109
FILES CLOSED FOR INCOMPLETENESS
1
$82,110
23
$375,742
90
$239,254
3
$80,040
0
$0
1
$55,430
Aggregated Statistics For Year 2000 (Based on 4 full and 12 partial tracts)
A) FHA, FSA/RHS & VA Home Purchase Loans
B) Conventional Home Purchase Loans
C) Refinancings
D) Home Improvement Loans
F) Non-occupant Loans on < 5 Family Dwellings (A B C & D)
Number
Average Value
Number
Average Value
Number
Average Value
Number
Average Value
Number
Average Value
LOANS ORIGINATED
87
$153,438
1,521
$261,258
395
$226,205
148
$58,390
71
$164,718
APPLICATIONS APPROVED, NOT ACCEPTED
6
$177,695
131
$209,387
73
$168,346
46
$56,801
12
$154,348
APPLICATIONS DENIED
5
$117,782
109
$226,758
153
$229,428
43
$73,399
12
$93,119
APPLICATIONS WITHDRAWN
1
$69,800
151
$272,326
79
$180,179
26
$102,278
8
$77,540
FILES CLOSED FOR INCOMPLETENESS
2
$133,945
25
$228,797
26
$199,633
15
$57,060
6
$130,705
Aggregated Statistics For Year 1999 (Based on 2 full and 6 partial tracts)
A) FHA, FSA/RHS & VA Home Purchase Loans
B) Conventional Home Purchase Loans
C) Refinancings
D) Home Improvement Loans
F) Non-occupant Loans on < 5 Family Dwellings (A B C & D)
2004 - 2018 National Fire Incident Reporting System (NFIRS) incidents
Based on the data from the years 2004 - 2018 the average number of fire incidents per year is 42. The highest number of fire incidents - 62 took place in 2014, and the least - 8 in 2004. The data has a growing trend.
When looking into fire subcategories, the most reports belonged to: Structure Fires (39.6%), and Outside Fires (36.5%).
Fire incident types reported to NFIRS in Zip Code 22182


 Nearest zip codes: 22181, 22180, 22102, 22027, 20190, 22185.


 Based on the data from the years 2004 - 2018 the average number of fire incidents per year is 42. The highest number of fire incidents - 62 took place in 2014, and the least - 8 in 2004. The data has a growing trend.
 When looking into fire subcategories, the most reports belonged to: Structure Fires (39.6%), and Outside Fires (36.5%).