Estimated zip code population in 2022: 17,167 Zip code population in 2010: 15,440 Zip code population in 2000: 15,687
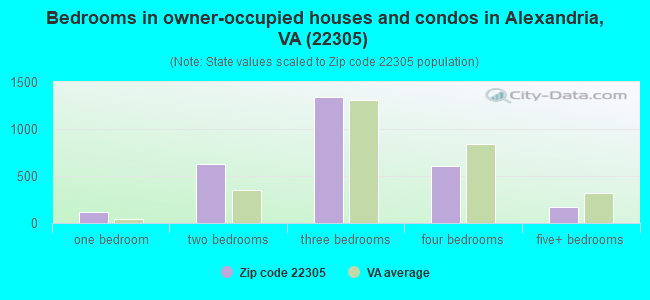
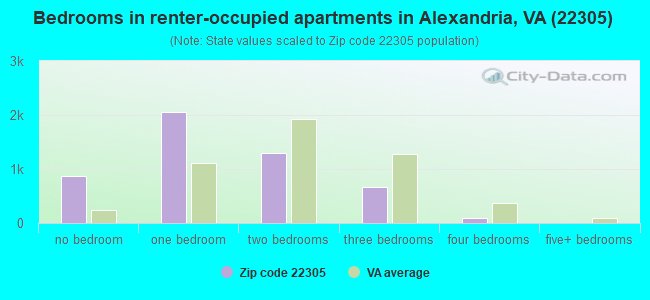
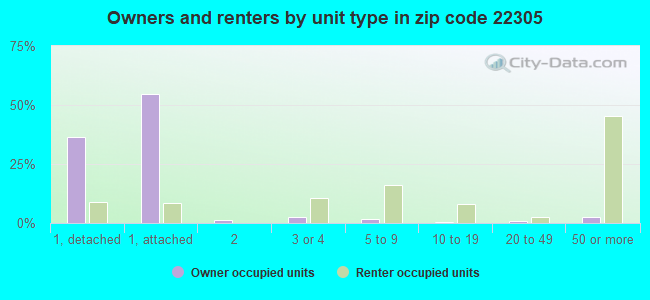
Houses and condos: 8,106 Renter-occupied apartments: 4,853
% of renters here:
63%
State:
33%
March 2022 cost of living index in zip code 22305: 169.2 (very high, U.S. average is 100)
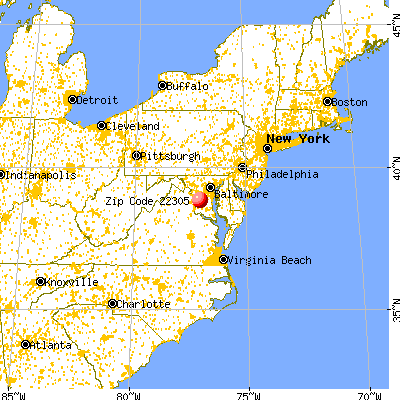
Land area: 1.4 sq. mi. Water area: 0.1 sq. mi.
Population density: 12,713 people per square mile
(very high).
OSM Map
General Map
Google Map
MSN Map
OSM Map
General Map
Google Map
MSN Map
OSM Map
General Map
Google Map
MSN Map
OSM Map
General Map
Google Map
MSN Map
Please wait while loading the map...
Real estate property taxes paid for housing units in 2022:
This zip code:
1.0% ($7,682)
Virginia:
0.7% ($2,617)
Median real estate property taxes paid for housing units with mortgages in 2022: $7,795 (1.0%) Median real estate property taxes paid for housing units with no mortgage in 2022: $7,433 (1.0%)
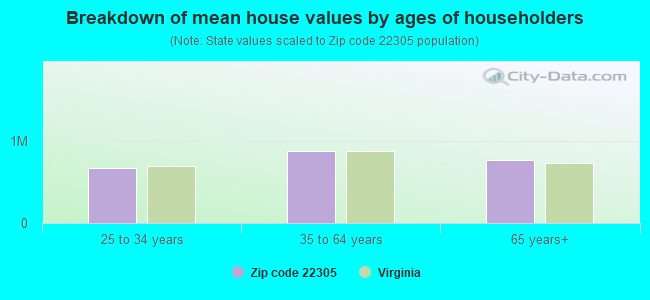
Estimated median house/condo value in 2022: $774,772
22305:
$774,772
Virginia:
$365,700
According to our research of Virginia and other state lists, there were 9 registered sex offenders living in 22305 zip code as of April 27, 2024. The ratio of all residents to sex offenders in zip code 22305 is 2,025 to 1. The ratio of registered sex offenders to all residents in this zip code is much lower than the state average.
Median resident age:
This zip code:
34.5 years
Virginia median age:
39.0 years
Average household size:
This zip code:
2.2 people
Virginia:
2.5 people
Averages for the 2020 tax year for zip code 22305, filed in 2021:
Average Adjusted Gross Income (AGI) in 2020: $97,143 (Individual Income Tax Returns)
Here:
$97,143
State:
$86,446
Salary/wage: $88,850 (reported on 85.4% of returns)
Here:
$88,850
State:
$71,185
(% of AGI for various income ranges: 1480.5% for AGIs below $25k, 3964.2% for AGIs $25k-50k, 7520.4% for AGIs $50k-75k, 10992.8% for AGIs $75k-100k, 19317.8% for AGIs $100k-200k, 76737.2% for AGIs over 200k)
Taxable interest for individuals: $1,148 (reported on 30.8% of returns)
This zip code:
$1,148
Virginia:
$1,805
(% of AGI for various income ranges: 4.4% for AGIs below $25k, 6.5% for AGIs $25k-50k, 12.0% for AGIs $50k-75k, 23.7% for AGIs $75k-100k, 94.6% for AGIs $100k-200k, 492.5% for AGIs over 200k)
Ordinary dividends: $6,297 (reported on 24.0% of returns)
Here:
$6,297
State:
$8,327
(% of AGI for various income ranges: 10.3% for AGIs below $25k, 30.6% for AGIs $25k-50k, 46.5% for AGIs $50k-75k, 80.9% for AGIs $75k-100k, 324.3% for AGIs $100k-200k, 2385.0% for AGIs over 200k)
Net capital gain/loss in AGI: +$16,893 (reported on 22.2% of returns)
Here:
+$16,893
State:
+$24,644
(% of AGI for various income ranges: 14.4% for AGIs below $25k, 15.8% for AGIs $25k-50k, 36.3% for AGIs $50k-75k, 79.3% for AGIs $75k-100k, 391.4% for AGIs $100k-200k, 7583.6% for AGIs over 200k)
Profit/loss from business: +$14,239 (reported on 21.5% of returns)
Here:
+$14,239
State:
+$12,836
(% of AGI for various income ranges: 449.7% for AGIs below $25k, 151.4% for AGIs $25k-50k, 111.8% for AGIs $50k-75k, 210.2% for AGIs $75k-100k, 391.6% for AGIs $100k-200k, 3292.5% for AGIs over 200k)
Taxable individual retirement arrangement distribution: $23,095 (reported on 4.4% of returns)
22305:
$23,095
Virginia:
$21,535
(% of AGI for various income ranges: 6.4% for AGIs below $25k, 43.1% for AGIs $25k-50k, 61.0% for AGIs $50k-75k, 131.2% for AGIs $75k-100k, 285.1% for AGIs $100k-200k, 1181.1% for AGIs over 200k)
Self-employed (Keogh) retirement plans: $31,438 (reported on 1.5% of returns)
22305:
$31,438
Virginia:
$31,172
(% of AGI for various income ranges: 50.4% for AGIs $100k-200k, 1005.0% for AGIs over 200k)
Total itemized deductions: $32,133 (reported on 19.7% of returns)
Here:
$32,133
State:
$33,287
(% of AGI for various income ranges: 37.5% for AGIs below $25k, 185.7% for AGIs $25k-50k, 286.2% for AGIs $50k-75k, 734.6% for AGIs $75k-100k, 1769.6% for AGIs $100k-200k, 7911.7% for AGIs over 200k)
Charity contributions: $7,551 (reported on 16.7% of returns)
Here:
$7,551
State:
$10,381
(% of AGI for various income ranges: 41.9% for AGIs $25k-50k, 50.1% for AGIs $50k-75k, 118.2% for AGIs $75k-100k, 267.8% for AGIs $100k-200k, 1862.5% for AGIs over 200k)
Taxes paid: $9,148 (reported on 19.6% of returns)
22305:
$9,148
State:
$8,284
(% of AGI for various income ranges: 7.5% for AGIs below $25k, 45.3% for AGIs $25k-50k, 94.4% for AGIs $50k-75k, 227.5% for AGIs $75k-100k, 601.3% for AGIs $100k-200k, 1957.5% for AGIs over 200k)
Earned income credit: $2,465 (reported on 12.0% of returns)
Here:
$2,465
State:
$2,214
(% of AGI for various income ranges: 127.7% for AGIs below $25k, 50.2% for AGIs $25k-50k)
Percentage of individuals using paid preparers for their 2020 taxes: 88.0%
Here:
88%
State:
92%
(% for various income ranges: 79.2% for AGIs below $25k, 89.1% for AGIs $25k-50k, 91.4% for AGIs $50k-75k, 91.5% for AGIs $75k-100k, 92.7% for AGIs $100k-200k, 94.2% for AGIs over 200k)
Averages for the 2012 tax year for zip code 22305, filed in 2013:
Average Adjusted Gross Income (AGI) in 2012: $73,222 (Individual Income Tax Returns)
Here:
$73,222
State:
$71,192
Salary/wage: $66,643 (reported on 89.9% of returns)
Here:
$66,643
State:
$59,229
(% of AGI for various income ranges: 87.1% for AGIs below $25k, 92.7% for AGIs $25k-50k, 90.3% for AGIs $50k-75k, 86.3% for AGIs $75k-100k, 84.3% for AGIs $100k-200k, 70.6% for AGIs over 200k)
Taxable interest for individuals: $924 (reported on 30.7% of returns)
This zip code:
$924
Virginia:
$1,600
(% of AGI for various income ranges: 0.3% for AGIs below $25k, 0.1% for AGIs $25k-50k, 0.3% for AGIs $50k-75k, 0.3% for AGIs $75k-100k, 0.4% for AGIs $100k-200k, 0.5% for AGIs over 200k)
Ordinary dividends: $4,431 (reported on 20.7% of returns)
Here:
$4,431
State:
$6,959
(% of AGI for various income ranges: 0.6% for AGIs below $25k, 0.5% for AGIs $25k-50k, 0.8% for AGIs $50k-75k, 0.8% for AGIs $75k-100k, 1.3% for AGIs $100k-200k, 2.0% for AGIs over 200k)
Net capital gain/loss in AGI: +$8,967 (reported on 15.7% of returns)
Here:
+$8,967
State:
+$16,672
(% of AGI for various income ranges: 0.1% for AGIs $50k-75k, 0.5% for AGIs $75k-100k, 0.8% for AGIs $100k-200k, 5.0% for AGIs over 200k)
Profit/loss from business: +$17,221 (reported on 15.8% of returns)
Here:
+$17,221
State:
+$14,116
(% of AGI for various income ranges: 10.3% for AGIs below $25k, 2.1% for AGIs $25k-50k, 1.9% for AGIs $50k-75k, 1.6% for AGIs $75k-100k, 3.1% for AGIs $100k-200k, 4.9% for AGIs over 200k)
Taxable individual retirement arrangement distribution: $15,185 (reported on 4.8% of returns)
22305:
$15,185
Virginia:
$16,667
(% of AGI for various income ranges: 0.5% for AGIs below $25k, 0.6% for AGIs $25k-50k, 0.6% for AGIs $50k-75k, 1.2% for AGIs $75k-100k, 1.3% for AGIs $100k-200k, 1.0% for AGIs over 200k)
Self-employment retirement plans: $27,191 (reported on 1.3% of returns)
22305:
$27,191
Virginia:
$25,373
Total itemized deductions: $25,817 (21% of AGI, reported on 43.7% of returns)
Here:
$25,817
State:
$26,596
Here:
21.3% of AGI
State:
20.1% of AGI
(% of AGI for various income ranges: 13.4% for AGIs below $25k, 17.8% for AGIs $25k-50k, 12.1% for AGIs $50k-75k, 13.5% for AGIs $75k-100k, 17.1% for AGIs $100k-200k, 15.2% for AGIs over 200k)
Charity contributions: $3,682 (reported on 33.3% of returns)
Here:
$3,682
State:
$4,443
(% of AGI for various income ranges: 0.5% for AGIs below $25k, 1.2% for AGIs $25k-50k, 1.3% for AGIs $50k-75k, 1.9% for AGIs $75k-100k, 1.8% for AGIs $100k-200k, 1.9% for AGIs over 200k)
Taxes paid: $9,715 (reported on 43.5% of returns)
22305:
$9,715
State:
$9,951
(% of AGI for various income ranges: 1.7% for AGIs below $25k, 2.8% for AGIs $25k-50k, 3.6% for AGIs $50k-75k, 4.8% for AGIs $75k-100k, 7.1% for AGIs $100k-200k, 7.4% for AGIs over 200k)
Earned income credit: $2,294 (reported on 13.8% of returns)
Here:
$2,294
State:
$2,211
(% of AGI for various income ranges: 5.8% for AGIs below $25k, 0.8% for AGIs $25k-50k)
Percentage of individuals using paid preparers for their 2012 taxes: 41.6%
Here:
42%
State:
46%
(% for various income ranges: 45.6% for AGIs below $25k, 39.3% for AGIs $25k-50k, 35.5% for AGIs $50k-75k, 36.6% for AGIs $75k-100k, 38.6% for AGIs $100k-200k, 54.4% for AGIs over 200k)
Averages for the 2004 tax year for zip code 22305, filed in 2005:
Average Adjusted Gross Income (AGI) in 2004: $54,792 (Individual Income Tax Returns)
Here:
$54,792
State:
$56,704
Salary/wage: $49,979 (reported on 89.6% of returns)
Here:
$49,979
State:
$48,441
(% of AGI for various income ranges: 104.1% for AGIs below $10k, 89.6% for AGIs $10k-25k, 93.8% for AGIs $25k-50k, 88.5% for AGIs $50k-75k, 87.1% for AGIs $75k-100k, 72.1% for AGIs over 100k)
Taxable interest for individuals: $1,084 (reported on 34.7% of returns)
This zip code:
$1,084
Virginia:
$1,688
(% of AGI for various income ranges: 2.1% for AGIs below $10k, 0.4% for AGIs $10k-25k, 0.4% for AGIs $25k-50k, 0.6% for AGIs $50k-75k, 0.9% for AGIs $75k-100k, 0.8% for AGIs over 100k)
Taxable dividends: $3,044 (reported on 21.3% of returns)
Here:
$3,044
State:
$4,028
(% of AGI for various income ranges: 3.8% for AGIs below $10k, 0.6% for AGIs $10k-25k, 0.4% for AGIs $25k-50k, 0.9% for AGIs $50k-75k, 1.0% for AGIs $75k-100k, 1.7% for AGIs over 100k)
Net capital gain/loss: +$14,804 (reported on 17.0% of returns)
Here:
+$14,804
State:
+$14,375
(% of AGI for various income ranges: 0.4% for AGIs below $10k, 0.3% for AGIs $10k-25k, 0.2% for AGIs $25k-50k, 0.6% for AGIs $50k-75k, 0.5% for AGIs $75k-100k, 9.2% for AGIs over 100k)
Profit/loss from business: +$13,191 (reported on 13.2% of returns)
Here:
+$13,191
State:
+$13,342
(% of AGI for various income ranges: 26.5% for AGIs below $10k, 5.3% for AGIs $10k-25k, 1.0% for AGIs $25k-50k, 2.1% for AGIs $50k-75k, 2.2% for AGIs $75k-100k, 3.7% for AGIs over 100k)
IRA payment deduction: $2,628 (reported on 1.7% of returns)
22305:
$2,628
Virginia:
$2,943
(% of AGI for various income ranges: 0.1% for AGIs $10k-25k, 0.1% for AGIs $25k-50k, 0.1% for AGIs $50k-75k, 0.1% for AGIs $75k-100k, 0.1% for AGIs over 100k)
Self-employed pension: $19,079 (reported on 1.5% of returns)
Here:
$19,079
Virginia:
$17,430
Total itemized deductions: $20,678 (22% of AGI, reported on 41.2% of returns)
Here:
$20,678
State:
$21,492
Here:
21.8% of AGI
State:
21.0% of AGI
(% of AGI for various income ranges: 9.5% for AGIs below $10k, 15.1% for AGIs $10k-25k, 14.2% for AGIs $25k-50k, 15.3% for AGIs $50k-75k, 17.9% for AGIs $75k-100k, 15.8% for AGIs over 100k)
Charity contributions deductions: $3,085 (3% of AGI, reported on 35.9% of returns)
Here:
$3,085
State:
$3,794
Here:
3.1% of AGI
State:
3.5% of AGI
(% of AGI for various income ranges: 0.8% for AGIs below $10k, 1.3% for AGIs $10k-25k, 1.7% for AGIs $25k-50k, 2.1% for AGIs $50k-75k, 2.0% for AGIs $75k-100k, 2.3% for AGIs over 100k)
Total tax: $9,418 (reported on 80.1% of returns)
22305:
$9,418
State:
$9,537
(% of AGI for various income ranges: 5.4% for AGIs below $10k, 4.0% for AGIs $10k-25k, 7.9% for AGIs $25k-50k, 11.9% for AGIs $50k-75k, 12.6% for AGIs $75k-100k, 18.6% for AGIs over 100k)
Earned income credit: $1,745 (reported on 15.9% of returns)
Here:
$1,745
State:
$1,734
Percentage of individuals using paid preparers for their 2004 taxes: 50.2%
Here:
50%
State:
52%
(% for various income ranges: 50.4% for AGIs below $10k, 60.1% for AGIs $10k-25k, 47.6% for AGIs $25k-50k, 43.6% for AGIs $50k-75k, 41.9% for AGIs $75k-100k, 48.5% for AGIs over 100k)
Likely homosexual households (counted as self-reported same-sex unmarried-partner households)
Lesbian couples: 0.2% of all households
Gay men: 0.2% of all households
Household received Food Stamps/SNAP in the past 12 months: 559 Household did not receive Food Stamps/SNAP in the past 12 months: 7,204
Women who had a birth in the past 12 months: 299 (198 now married, 98 unmarried) Women who did not have a birth in the past 12 months: 4,559 (1,733 now married, 2,835 unmarried)
Housing units in zip code 22305 with a mortgage: 2,214 (211 second mortgage, 6 home equity loan, 193 both second mortgage and home equity loan) Houses without a mortgage: 49
Median monthly owner costs for units with a mortgage: $3,101 Median monthly owner costs for units without a mortgage: $938
Residents with income below the poverty level in 2022:
This zip code:
15.0%
Whole state:
10.6%
Residents with income below 50% of the poverty level in 2022:
This zip code:
8.2%
Whole state:
5.2%
Median number of rooms in houses and condos:
Here:
6.4
State:
7.0
Median number of rooms in apartments:
Here:
3.4
State:
4.3
Notable locations in this zip code not listed on our city pages
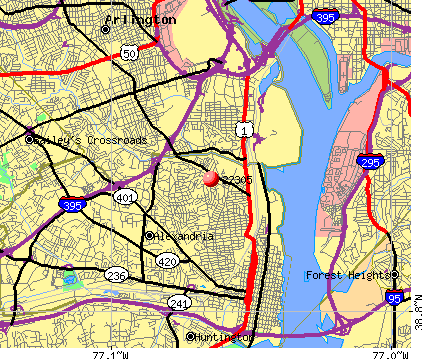
Churches in zip code 22305 include: Freedom Way Baptist Church (A), Saint Rita Church (B), Beverley Hills Community United Methodist Church (C), Beverley Hills United Methodist Church (D), Saint Rita Catholic Church (E), Westminster Presbyterian Church (F), Grace Episcopal Church (G). Display/hide their locations on the map
2,207 married couples with children.
1,461 single-parent households (402 men, 1,059 women).
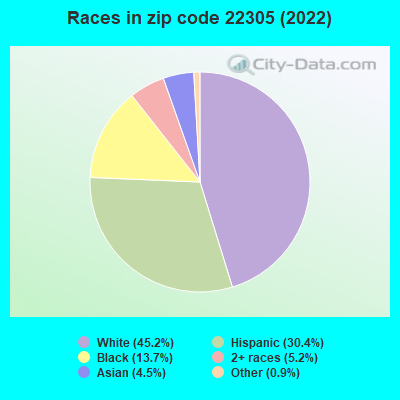
66.4% of residents of 22305 zip code speak English at home.
23.6% of residents speak Spanish at home (42% very well, 16% well, 25% not well, 17% not at all).
3.1% of residents speak other Indo-European language at home (86% very well, 14% well).
3.1% of residents speak Asian or Pacific Island language at home (82% very well, 18% well).
3.2% of residents speak other language at home (71% very well, 29% well).
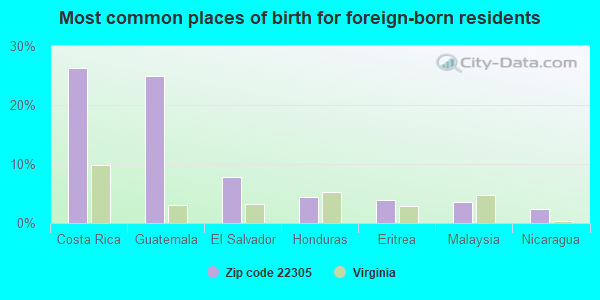
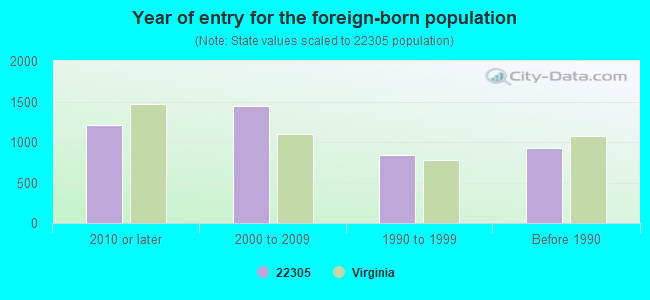
Foreign born population: 4,032 (23.5%) (37.9% of them are naturalized citizens)
Facilities with environmental interests located in this zip code:
ARLANDRIA CLEANERS (4125 MOUNT VERNON AVENUE in ALEXANDRIA, VA)
AIR MINOR (AIRS/AFS) STATE MASTER (Virginia pollutants databases) - CEDS-72054, AIR PROGRAM Small Quantity Generators, between 100 kg and 1000 kg of hazardous waste/month (Resource Conservation and Recovery Act (tracking hazardous waste)) - notification Business SIC classification: DRYCLEANING PLANTS, EXCEPT RUG CLEANING Business NAICS classification: DRYCLEANING AND LAUNDRY SERVICES (EXCEPT COIN-OPERATED). Organizations: OPERNAME (CONTACT/OPERATOR)
, YONG & KEUM KIM (CONTACT/OWNER)
Alternative names: KEUM, KIM S
ALEXANDRIA APARTMENTS (3908 ELBERT AVE. #103 in ALEXANDRIA, VA)
AIR MINOR (AIRS/AFS) Business SIC classification: OPERATORS OF APARTMENT BUILDINGS
Housing units lacking complete kitchen facilities: 0.3%
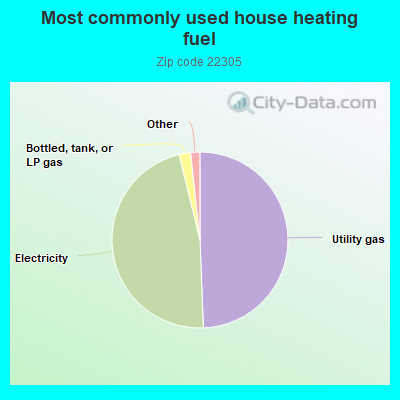
49.4%Utility gas
46.8%Electricity
2.1%Bottled, tank, or LP gas
0.7%No fuel used
0.6%Fuel oil, kerosene, etc.
Population in 1990: 13,514. Population change in the 1990s: +2,173 (+16.1%).
Place of birth for U.S.-born residents:
This state: 4,547
Northeast: 2,167
Midwest: 1,246
South: 3,729
West: 1,101
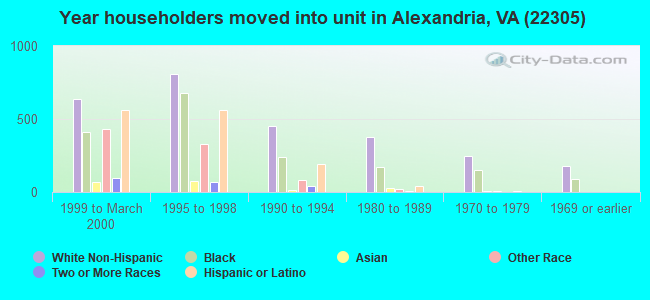
45% of the 22305 zip code residents lived in the same house 5 years ago. Out of people who lived in different houses, 43% lived in this county. Out of people who lived in different counties, 50% lived in Virginia.
82% of the 22305 zip code residents lived in the same house 1 year ago. Out of people who lived in different houses, 21% moved from this county. Out of people who lived in different houses, 22% moved from different county within same state. Out of people who lived in different houses, 54% moved from different state. Out of people who lived in different houses, 4% moved from abroad.
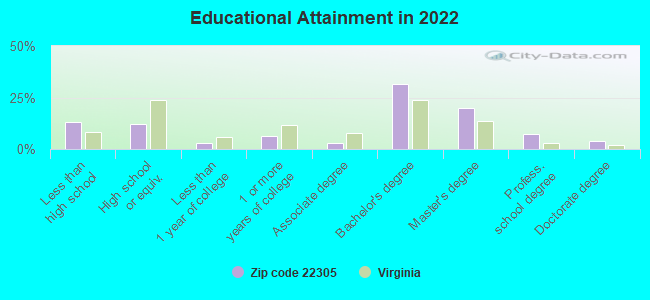
Private vs. public school enrollment:
Students in private schools in grades 1 to 8 (elementary and middle school): 322
Here:
19.7%
Virginia:
13.2%
Students in private schools in grades 9 to 12 (high school): 101
Here:
15.0%
Virginia:
10.2%
Students in private undergraduate colleges: 53
Here:
11.8%
Virginia:
18.7%
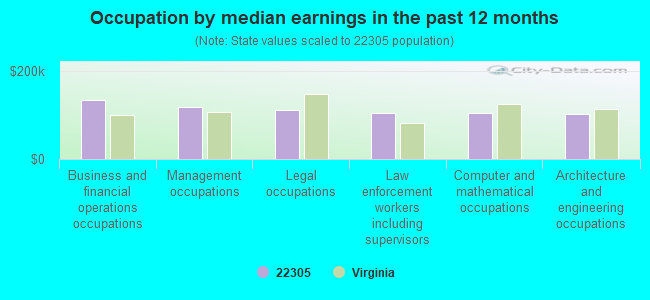
Occupation by median earnings in the past 12 months ($)
133,456Business and financial operations occupations
117,597Management occupations
111,206Legal occupations
103,989Law enforcement workers including supervisors
103,730Computer and mathematical occupations
102,825Architecture and engineering occupations
Companies with federal contracts located in this zip code (ALEXANDRIA, VA):
R BRATTI ASSOCIATES, INC (401 E GLEBE RD; small business) : $167,902 in 6 contractsfrom 2001 to 2002
Contracts for Maintenance, Repair or Alteration of Real Property -- Other Non-Building Facilities, Care of Remains and/or Funeral Services, Floor Coverings by Army Signed by year:2000: $0; 2001: $154,722; 2002: $13,180; 2003: $0; 2004: $0; 2005: $0; 2006: $0.
Biggest contracts:
$134,184 with Army for Maintenance, Repair or Alteration of Real Property -- Other Non-Building Facilities. Signed on 2001-06-19. Completion date: 2001-07-25.
$13,000 with Army for Care of Remains and/or Funeral Services. Signed on 2002-07-10. Completion date: 2002-09-03.
$9,672 with Army for Maintenance, Repair or Alteration of Real Property -- Other Non-Building Facilities. Signed on 2001-10-31. Completion date: 2001-07-25.
$7,462 with Army for Floor Coverings. Signed on 2001-12-13. Completion date: 2002-02-07.
JOYCE A. KRAMER (4201 S 31ST ST 801; small business) : $165,000 in 4 contractsfrom 2001 to 2003
$77,000 with Broadcasting Board of Governors for Contract, Procurement, and Acquisition Support Services. Taking place in DC. Signed on 2002-09-15. Completion date: 2003-09-15.
$40,000, same as above.Signed on 2001-09-15. Completion date: 2002-09-15.
$35,000, same as above.Signed on 2003-09-15. Completion date: 2004-09-15.
$13,000, same as above.Signed on 2002-04-15. Completion date: 2002-09-15.
VIRGINIA ELECTRIC AND POWER CO (907 W GLEBE RD) : $148,924 in 4 contractsin 2000
$116,423 with Navy for Maintenance, Repair or Alteration of Real Property -- Other Non-Building Facilities. Taking place in DC. Signed on 2000-10-01. Completion date: 2000-12-03.
$30,113 with Navy for Maintenance, Repair or Alteration of Real Property -- Other Non-Building Facilities. Taking place in MD. Signed on 2000-07-19. Completion date: 1999-11-04.
$2,388 with Navy for Maintenance, Repair or Alteration of Real Property -- Other Non-Building Facilities. Taking place in DC. Signed on 2000-10-01. Completion date: 2000-07-24.
$0 with Navy for Maintenance, Repair or Alteration of Real Property -- Other Non-Building Facilities. Taking place in MD. Signed on 2000-07-19. Completion date: 1999-11-04.
L & Z TRANSPORTATION, INC (3706 MOUNT VERNON AVENUE; small business) : $110,220 in 4 contractsfrom 2000 to 2005
$50,000 with Defense Logistics Agency for Maintenance, Repair and Rebuilding of Equipment -- Automatic Data Processing Equipment (Including Firmware), Software, Supplies and Support Equipment. Signed on 2000-12-01. Completion date: 2001-11-30.
$36,220 with Defense Logistics Agency for Other Transportation Travel and Relocation Services. Signed on 2004-03-04. Completion date: 2004-12-31.
$24,000, same as above.Signed on 2005-03-07. Completion date: 2005-12-31.
$0, same as above.Signed on 2005-03-07. Completion date: 2005-12-31.
KLIGGE, KENNETH (3201 LANDOVER ST APT 422; small business) : $61,792 in 2 contractsfrom 2002 to 2003
$52,000 with Army for Operations Research and Quantitative Analysis Services. Signed on 2002-08-13. Completion date: 2003-09-02.
$9,792, same as above.Signed on 2003-08-25. Completion date: 2003-09-02.
DEL RAY GLASS INC (3000 JEFFERSON DAVIS HWY; small business) : $16,400 in 3 contractsfrom 2000 to 2003
$11,000 with Public Buildings Service for Maintenance, Repair or Alteration of Real Property -- Office Buildings. Taking place in DC. Signed on 2001-08-15. Completion date: 2001-12-15.
$3,120 with Army for Tile, Brick, and Block. Signed on 2003-07-30. Completion date: 2003-09-24.
$2,280 with Navy for Maintenance, Repair or Alteration of Real Property -- Other Non-Building Facilities. Taking place in DC. Signed on 2000-10-01. Completion date: 2000-06-30.
VIZA RESTORATION COMPANY (2952 HICKORY STREET; small business)
$6,240 with U.S. Army Corps of Engineers - civil program financing only for Maintenance, Repair or Alteration of Real Property -- Office Buildings. Signed on 2003-02-12. Completion date: 2003-02-27.
RICHARSON-JONES, CHRISTINA (3818 BRIGHTON CT; small business)
$3,012 with Army for Chaplain Services. Signed on 2006-04-20. Completion date: 2006-09-30.
Top industries in this zip code by the number of employees in 2005:
2002 - 2018 National Fire Incident Reporting System (NFIRS) incidents
Based on the data from the years 2002 - 2018 the average number of fires per year is 35. The highest number of fires - 48 took place in 2002, and the least - 23 in 2017. The data has a decreasing trend.
When looking into fire subcategories, the most reports belonged to: Structure Fires (58.0%), and Outside Fires (27.7%).
Fire incident types reported to NFIRS in Zip Code 22305


 Nearest zip codes: 22301, 22302, 22202, 22206, 22314, 22214.


 Based on the data from the years 2002 - 2018 the average number of fires per year is 35. The highest number of fires - 48 took place in 2002, and the least - 23 in 2017. The data has a decreasing trend.
 When looking into fire subcategories, the most reports belonged to: Structure Fires (58.0%), and Outside Fires (27.7%).