Estimated zip code population in 2022: 2,656 Zip code population in 2010: 2,439 Zip code population in 2000: 2,078
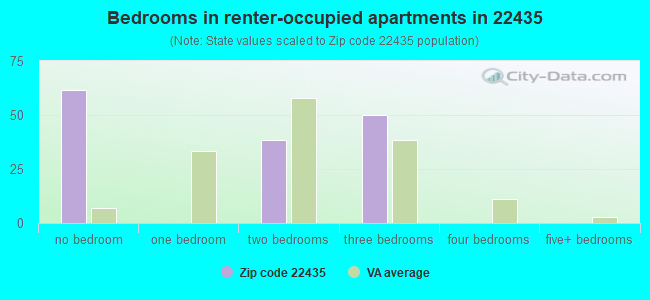
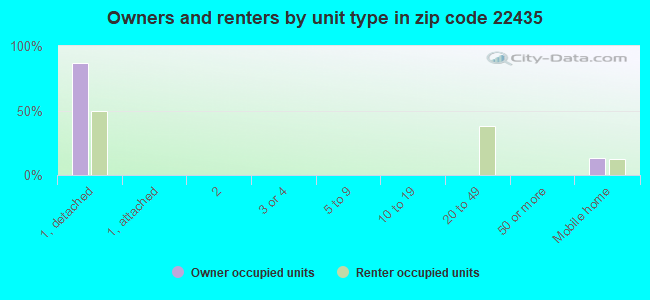
Houses and condos: 1,382 Renter-occupied apartments: 144
% of renters here:
14%
State:
33%
March 2022 cost of living index in zip code 22435: 83.3 (low, U.S. average is 100)
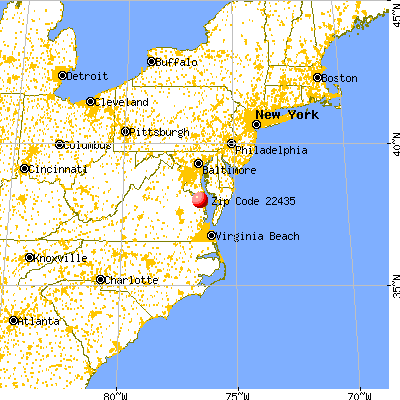
Land area: 25.5 sq. mi. Water area: 1.7 sq. mi.
Population density: 104 people per square mile
(very low).
OSM Map
General Map
Google Map
MSN Map
OSM Map
General Map
Google Map
MSN Map
OSM Map
General Map
Google Map
MSN Map
OSM Map
General Map
Google Map
MSN Map
Please wait while loading the map...
Real estate property taxes paid for housing units in 2022:
This zip code:
0.6% ($1,000)
Virginia:
0.7% ($2,617)
Median real estate property taxes paid for housing units with mortgages in 2022: $1,080 (0.7%) Median real estate property taxes paid for housing units with no mortgage in 2022: $910 (0.5%)
Business Search- 14 Million verified businesses
Males: 1,198
(45.1%)
Females: 1,457
(54.9%)
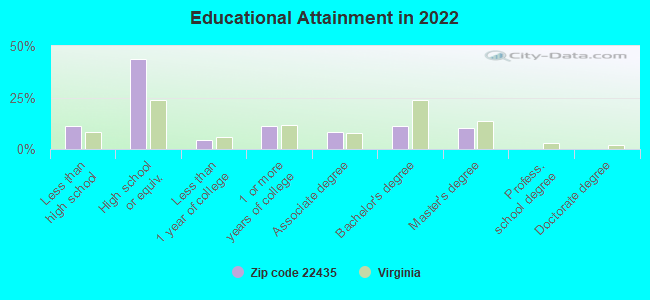
For population 25 years and over in 22435:
High school or higher: 88.6%
Bachelor's degree or higher: 21.3%
Graduate or professional degree: 10.3%
Unemployed: 1.6%
Mean travel time to work (commute): 32.3 minutes
For population 15 years and over in 22435:
Never married: 38.9%
Now married: 37.0%
Separated: 0.0%
Widowed: 8.5%
Divorced: 15.5%
Zip code 22435 compared to state average:
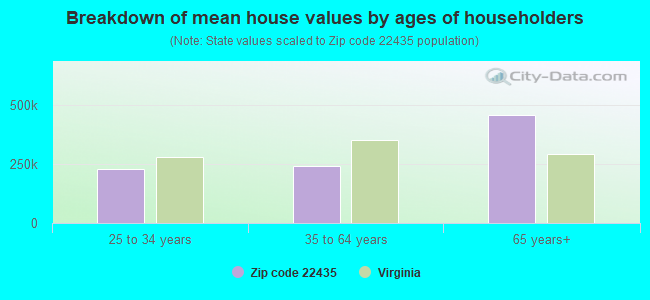
Median house value below state average.
Unemployed percentage below state average.
Foreign-born population percentage significantly below state average.
Renting percentage significantly below state average.
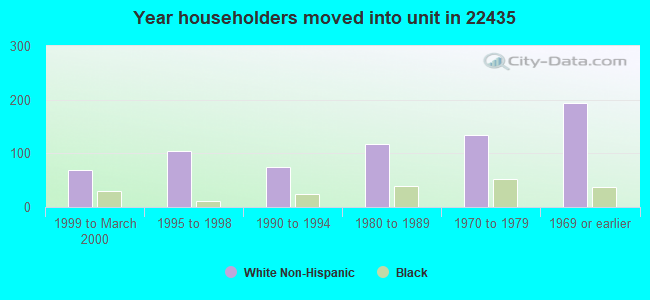
Length of stay since moving in significantly above state average.
Percentage of population with a bachelor's degree or higher below state average.
Estimated median house/condo value in 2022: $170,366
22435:
$170,366
Virginia:
$365,700
According to our research of Virginia and other state lists, there were 5 registered sex offenders living in 22435 zip code as of April 26, 2024. The ratio of all residents to sex offenders in zip code 22435 is 558 to 1. The ratio of registered sex offenders to all residents in this zip code is lower than the state average.
Median resident age:
This zip code:
39.9 years
Virginia median age:
39.0 years
Average household size:
This zip code:
2.6 people
Virginia:
2.5 people
Averages for the 2020 tax year for zip code 22435, filed in 2021:
Average Adjusted Gross Income (AGI) in 2020: $59,419 (Individual Income Tax Returns)
Here:
$59,419
State:
$86,446
Salary/wage: $41,070 (reported on 76.4% of returns)
Here:
$41,070
State:
$71,185
(% of AGI for various income ranges: 1179.2% for AGIs below $25k, 3480.8% for AGIs $25k-50k, 6818.9% for AGIs $50k-75k, 8725.0% for AGIs $75k-100k, 21186.0% for AGIs $100k-200k)
Taxable interest for individuals: $1,829 (reported on 33.0% of returns)
This zip code:
$1,829
Virginia:
$1,805
(% of AGI for various income ranges: 26.8% for AGIs below $25k, 60.8% for AGIs $25k-50k, 75.6% for AGIs $50k-75k, 230.0% for AGIs $75k-100k, 148.0% for AGIs $100k-200k)
Ordinary dividends: $7,252 (reported on 19.8% of returns)
Here:
$7,252
State:
$8,327
(% of AGI for various income ranges: 28.4% for AGIs below $25k, 72.5% for AGIs $25k-50k, 85.6% for AGIs $50k-75k, 116.7% for AGIs $75k-100k, 2262.0% for AGIs $100k-200k)
Net capital gain/loss in AGI: +$14,756 (reported on 17.0% of returns)
Here:
+$14,756
State:
+$24,644
(% of AGI for various income ranges: 16.4% for AGIs below $25k, 12.9% for AGIs $25k-50k, 50.0% for AGIs $50k-75k, 330.0% for AGIs $75k-100k, 1010.0% for AGIs $100k-200k)
Profit/loss from business: +$7,013 (reported on 21.7% of returns)
Here:
+$7,013
State:
+$12,836
(% of AGI for various income ranges: 206.8% for AGIs below $25k, 161.7% for AGIs $25k-50k, 383.3% for AGIs $50k-75k, 726.0% for AGIs $100k-200k)
Taxable individual retirement arrangement distribution: $15,400 (reported on 11.3% of returns)
22435:
$15,400
Virginia:
$21,535
(% of AGI for various income ranges: 46.4% for AGIs below $25k, 112.5% for AGIs $25k-50k, 711.1% for AGIs $50k-75k, 1644.0% for AGIs $100k-200k)
Total itemized deductions: $35,812 (reported on 7.5% of returns)
Here:
$35,812
State:
$33,287
(% of AGI for various income ranges: 1142.2% for AGIs $50k-75k, 3674.0% for AGIs $100k-200k)
Charity contributions: $14,300 (reported on 4.7% of returns)
Here:
$14,300
State:
$10,381
(% of AGI for various income ranges: 65.0% for AGIs $25k-50k, 1118.0% for AGIs $100k-200k)
Taxes paid: $6,062 (reported on 7.5% of returns)
22435:
$6,062
State:
$8,284
(% of AGI for various income ranges: 175.6% for AGIs $50k-75k, 654.0% for AGIs $100k-200k)
Earned income credit: $2,415 (reported on 18.9% of returns)
Here:
$2,415
State:
$2,214
(% of AGI for various income ranges: 121.2% for AGIs below $25k, 75.0% for AGIs $25k-50k)
Percentage of individuals using paid preparers for their 2020 taxes: 88.7%
Here:
89%
State:
92%
(% for various income ranges: 86.5% for AGIs below $25k, 90.3% for AGIs $25k-50k, 86.7% for AGIs $50k-75k, 90.0% for AGIs $75k-100k, 90.0% for AGIs $100k-200k, 100.0% for AGIs over 200k)
Averages for the 2012 tax year for zip code 22435, filed in 2013:
Average Adjusted Gross Income (AGI) in 2012: $40,144 (Individual Income Tax Returns)
Here:
$40,144
State:
$71,192
Salary/wage: $31,410 (reported on 76.6% of returns)
Here:
$31,410
State:
$59,229
(% of AGI for various income ranges: 72.7% for AGIs below $25k, 74.0% for AGIs $25k-50k, 64.3% for AGIs $50k-75k, 60.8% for AGIs $75k-100k, 37.8% for AGIs $100k-200k)
Taxable interest for individuals: $1,525 (reported on 33.6% of returns)
This zip code:
$1,525
Virginia:
$1,600
(% of AGI for various income ranges: 1.5% for AGIs below $25k, 1.1% for AGIs $25k-50k, 1.2% for AGIs $50k-75k, 1.1% for AGIs $75k-100k, 1.4% for AGIs $100k-200k)
Ordinary dividends: $4,195 (reported on 20.6% of returns)
Here:
$4,195
State:
$6,959
(% of AGI for various income ranges: 2.1% for AGIs below $25k, 1.0% for AGIs $25k-50k, 1.3% for AGIs $50k-75k, 4.4% for AGIs $75k-100k, 2.6% for AGIs $100k-200k)
Net capital gain/loss in AGI: +$3,079 (reported on 13.1% of returns)
Here:
+$3,079
State:
+$16,672
(% of AGI for various income ranges: 2.1% for AGIs $50k-75k, 2.6% for AGIs $100k-200k)
Profit/loss from business: +$6,365 (reported on 18.7% of returns)
Here:
+$6,365
State:
+$14,116
(% of AGI for various income ranges: 8.4% for AGIs below $25k, 2.5% for AGIs $25k-50k, 3.2% for AGIs $50k-75k, 3.2% for AGIs $75k-100k)
Taxable individual retirement arrangement distribution: $14,986 (reported on 13.1% of returns)
22435:
$14,986
Virginia:
$16,667
(% of AGI for various income ranges: 2.8% for AGIs below $25k, 3.9% for AGIs $25k-50k, 5.1% for AGIs $50k-75k, 4.0% for AGIs $75k-100k, 7.2% for AGIs $100k-200k)
Total itemized deductions: $21,300 (27% of AGI, reported on 23.4% of returns)
Here:
$21,300
State:
$26,596
Here:
26.8% of AGI
State:
20.1% of AGI
(% of AGI for various income ranges: 7.0% for AGIs below $25k, 11.4% for AGIs $25k-50k, 14.4% for AGIs $50k-75k, 14.0% for AGIs $75k-100k, 14.2% for AGIs $100k-200k)
Charity contributions: $5,005 (reported on 17.8% of returns)
Here:
$5,005
State:
$4,443
(% of AGI for various income ranges: 0.6% for AGIs below $25k, 1.3% for AGIs $25k-50k, 3.1% for AGIs $50k-75k, 2.2% for AGIs $75k-100k, 3.4% for AGIs $100k-200k)
Taxes paid: $5,475 (reported on 22.4% of returns)
22435:
$5,475
State:
$9,951
(% of AGI for various income ranges: 1.0% for AGIs below $25k, 1.9% for AGIs $25k-50k, 3.2% for AGIs $50k-75k, 3.4% for AGIs $75k-100k, 5.0% for AGIs $100k-200k)
Earned income credit: $2,330 (reported on 21.5% of returns)
Here:
$2,330
State:
$2,211
(% of AGI for various income ranges: 6.1% for AGIs below $25k, 1.1% for AGIs $25k-50k)
Percentage of individuals using paid preparers for their 2012 taxes: 61.7%
Here:
62%
State:
46%
(% for various income ranges: 62.7% for AGIs below $25k, 58.6% for AGIs $25k-50k, 61.5% for AGIs $50k-75k, 71.4% for AGIs $75k-100k, 57.1% for AGIs $100k-200k)
Averages for the 2004 tax year for zip code 22435, filed in 2005:
Average Adjusted Gross Income (AGI) in 2004: $40,366 (Individual Income Tax Returns)
Here:
$40,366
State:
$56,704
Salary/wage: $30,902 (reported on 77.3% of returns)
Here:
$30,902
State:
$48,441
(% of AGI for various income ranges: 81.0% for AGIs below $10k, 69.7% for AGIs $10k-25k, 73.8% for AGIs $25k-50k, 73.2% for AGIs $50k-75k, 60.5% for AGIs $75k-100k, 35.2% for AGIs over 100k)
Taxable interest for individuals: $2,924 (reported on 45.2% of returns)
This zip code:
$2,924
Virginia:
$1,688
(% of AGI for various income ranges: 6.5% for AGIs below $10k, 3.9% for AGIs $10k-25k, 2.7% for AGIs $25k-50k, 2.1% for AGIs $50k-75k, 1.5% for AGIs $75k-100k, 4.4% for AGIs over 100k)
Taxable dividends: $4,289 (reported on 25.9% of returns)
Here:
$4,289
State:
$4,028
(% of AGI for various income ranges: 3.6% for AGIs below $10k, 1.9% for AGIs $10k-25k, 2.2% for AGIs $25k-50k, 1.9% for AGIs $50k-75k, 3.7% for AGIs $75k-100k, 3.7% for AGIs over 100k)
Net capital gain/loss: +$14,438 (reported on 18.2% of returns)
Here:
+$14,438
State:
+$14,375
(% of AGI for various income ranges: 2.1% for AGIs below $10k, 0.3% for AGIs $10k-25k, 0.7% for AGIs $25k-50k, 2.1% for AGIs $50k-75k, 9.5% for AGIs $75k-100k, 14.9% for AGIs over 100k)
Profit/loss from business: +$12,773 (reported on 19.6% of returns)
Here:
+$12,773
State:
+$13,342
(% of AGI for various income ranges: -1.3% for AGIs below $10k, 5.6% for AGIs $10k-25k, 5.3% for AGIs $25k-50k, 4.9% for AGIs $50k-75k, 10.0% for AGIs over 100k)
IRA payment deduction: $2,721 (reported on 4.1% of returns)
22435:
$2,721
Virginia:
$2,943
Self-employed pension: $10,538 (reported on 1.2% of returns)
Here:
$10,538
Virginia:
$17,430
Total itemized deductions: $17,642 (22% of AGI, reported on 26.0% of returns)
Here:
$17,642
State:
$21,492
Here:
21.5% of AGI
State:
21.0% of AGI
(% of AGI for various income ranges: 10.0% for AGIs $10k-25k, 12.5% for AGIs $25k-50k, 11.3% for AGIs $50k-75k, 15.9% for AGIs $75k-100k, 10.7% for AGIs over 100k)
Charity contributions deductions: $3,504 (4% of AGI, reported on 21.4% of returns)
Here:
$3,504
State:
$3,794
Here:
3.9% of AGI
State:
3.5% of AGI
(% of AGI for various income ranges: 0.7% for AGIs $10k-25k, 1.8% for AGIs $25k-50k, 1.2% for AGIs $50k-75k, 5.2% for AGIs $75k-100k, 1.9% for AGIs over 100k)
Total tax: $6,124 (reported on 74.1% of returns)
22435:
$6,124
State:
$9,537
(% of AGI for various income ranges: 3.1% for AGIs below $10k, 3.9% for AGIs $10k-25k, 6.6% for AGIs $25k-50k, 8.7% for AGIs $50k-75k, 10.5% for AGIs $75k-100k, 19.4% for AGIs over 100k)
Earned income credit: $1,882 (reported on 18.5% of returns)
Here:
$1,882
State:
$1,734
Percentage of individuals using paid preparers for their 2004 taxes: 65.5%
Here:
65%
State:
52%
(% for various income ranges: 55.1% for AGIs below $10k, 71.6% for AGIs $10k-25k, 62.7% for AGIs $25k-50k, 60.6% for AGIs $50k-75k, 72.1% for AGIs $75k-100k, 86.3% for AGIs over 100k)
Notable locations in zip code 22435: Winstead Gate (A), Lodge Landing (B), Mundy Point (C), Hudsons Landing (D), Fruit Plain (E), Quinton Oaks Golf Course (F), Village Green Golf Course (G), Callao Volunteer Rescue Squad (H), Callo Rescue Squad (I), Callao Volunteer Fire Department (J). Display/hide their locations on the map
Churches in zip code 22435 include: Gibeon Baptist Church (A), Bethany Church (B), Northern Neck Baptist Church (C), Good Shepherd Lutheran Church (D), Henderson Church (E), Lively Hope Church (F). Display/hide their locations on the map
Streams, rivers, and creeks: Wilkins Creek (A), West Yeocomico River (B), South Yeocomico River (C), Northwest Yeocomico River (D), Mill Creek (E), Lodge Creek (F), Hampton Hall Branch (G). Display/hide their locations on the map
Size of family households: 453 2-persons, 170 3-persons, 63 4-persons, 26 5-persons
Size of nonfamily households: 214 1-person, 88 2-persons
72 married couples with children.
345 single-parent households (345 women).
92.1% of residents of 22435 zip code speak English at home.
7.1% of residents speak Spanish at home (100% very well).
0.8% of residents speak other Indo-European language at home (100% very well).
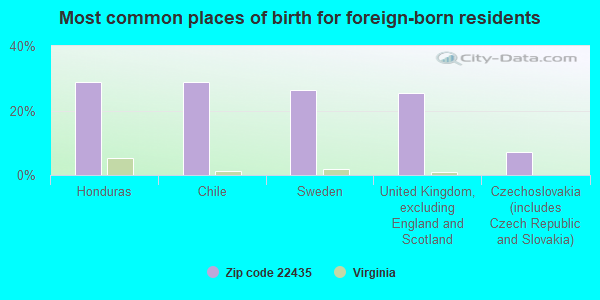
Foreign born population: 87 (3.3%) (100.0% of them are naturalized citizens)
This zip code:
3.3%
Whole state:
12.7%
29%Honduras
29%Chile
27%Sweden
25%United Kingdom, excluding England and Scotland
7%Czechoslovakia (includes Czech Republic and Slovakia)
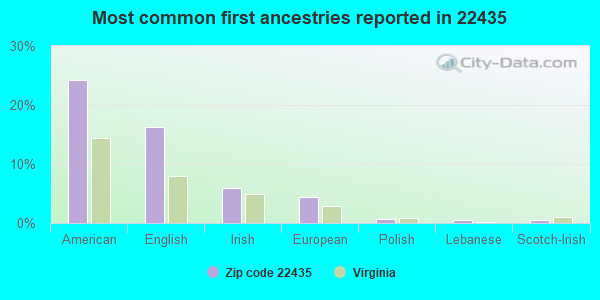
24%American
16%English
6%Irish
4%European
1%Polish
1%Lebanese
0%Scotch-Irish
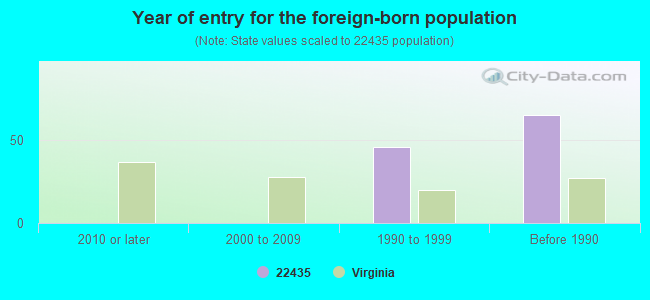
Year of entry for the foreign-born population
02010 or later
02000 to 2009
461990 to 1999
65Before 1990
Facilities with environmental interests located in this zip code:
CARRY ON TRAILER CORPORATION (617 HARRY HOGAN RD in CALLAO, VA)
AIR SYNTHETIC MINOR (AIRS/AFS) STATE MASTER (Virginia pollutants databases) - CEDS-51988, AIR PROGRAM CRITERIA AND HAZARDOUS AIR POLLUTANT INVENTORY (Inventory of air pollution sources) Large Quantity Generators, more that 1000 kg of hazardous waste/month (Resource Conservation and Recovery Act (tracking hazardous waste)) TRI REPORTER (Tracking of toxic chemicals releasing facilities) Business SIC classification: TRUCK TRAILERS; TRANSPORTATION EQUIPMENT Business NAICS classification: TRAVEL TRAILER AND CAMPER MANUFACTURING. Organizations: CARRY ON TRAILER CORP. (CONTACT/OPERATOR)
Alternative names: CARRY-ON TRAILER CORP.
CALLAO WASTEWATER TREATMENT PL (HARRYHOGAN RD in CALLAO, VA)
National Pollutant Discharge Elimination System NON-MAJOR (Tracking pollutant discharge elimination systems) - permit National Pollutant Discharge Elimination System NON-MAJOR (Tracking pollutant discharge elimination systems) - permit Business SIC classification: SEWERAGE SYSTEMS; ELEMENTARY AND SECONDARY SCHOOLS Organizations: CALLAO SHOPS AND APARTMENTS (CONTACT/OWNER)
Alternative names: CALLAO SHOPS AND APARTMENTS, CALLAO SHOPS & APARTMENTS WTP
Housing units lacking complete plumbing facilities: 0.5% Housing units lacking complete kitchen facilities: 1.6%
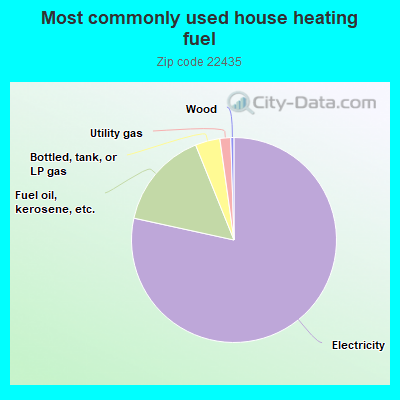
78.5%Electricity
15.5%Fuel oil, kerosene, etc.
3.9%Bottled, tank, or LP gas
1.7%Utility gas
0.5%Wood
Population in 1990: 1,808. Population change in the 1990s: +270 (+14.9%).
Place of birth for U.S.-born residents:
This state: 2,035
Northeast: 142
Midwest: 51
South: 254
West: 37
74% of the 22435 zip code residents lived in the same house 5 years ago. Out of people who lived in different houses, 36% lived in this county. Out of people who lived in different counties, 50% lived in Virginia.
94% of the 22435 zip code residents lived in the same house 1 year ago. Out of people who lived in different houses, 47% moved from different county within same state. Out of people who lived in different houses, 50% moved from different state. Out of people who lived in different houses, 14% moved from abroad.
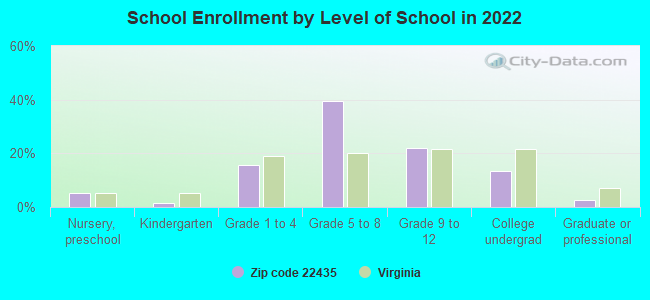
Private vs. public school enrollment:
Students in private schools in grades 1 to 8 (elementary and middle school): 22
Here:
6.2%
Virginia:
13.2%
Students in private schools in grades 9 to 12 (high school):
Here:
0.0%
Virginia:
10.2%
Students in private undergraduate colleges:
Here:
0.0%
Virginia:
18.7%
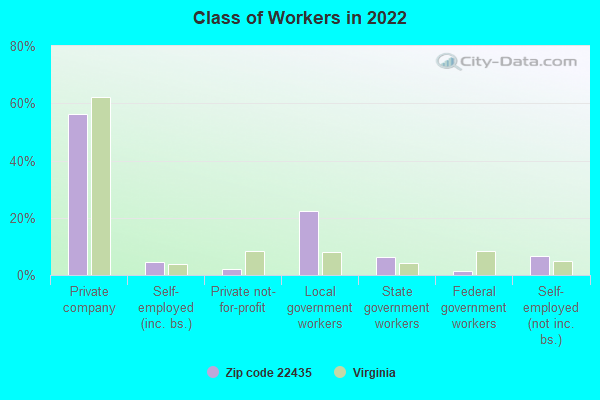
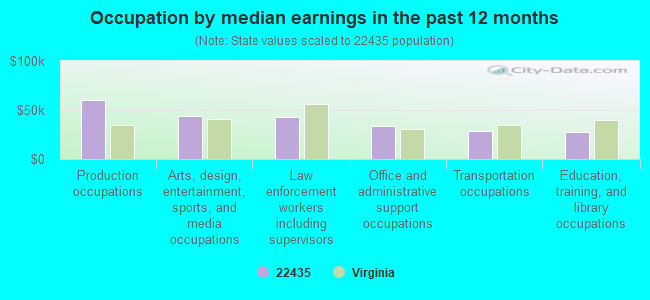
Occupation by median earnings in the past 12 months ($)
60,597Production occupations
43,773Arts, design, entertainment, sports, and media occupations
42,759Law enforcement workers including supervisors
34,127Office and administrative support occupations
28,807Transportation occupations
27,415Education, training, and library occupations
Top industries in this zip code by the number of employees in 2005:
Professional, Scientific, and Technical Services: Administrative Management and General Management Consulting Services (20-49: 1)
Arts, Entertainment, and Recreation: Golf Courses and Country Clubs (20-49: 1)
Construction: Poured Concrete Foundation and Structure Contractors (20-49: 1)
Finance and Insurance: Commercial Banking (10-19: 1, 5-9: 1)
Fatal accident statistics in 2014:
Fatal accident count: 1
Vehicles involved in fatal accidents: 1
Fatal accidents caused by drunken drivers: 0
Fatalities: 1
Persons involved in fatal accidents: 1
Pedestrians involved in fatal accidents: 0
Fatal accident statistics in 2013:
Fatal accident count: 1
Vehicles involved in fatal accidents: 2
Fatal accidents caused by drunken drivers: 1
Fatalities: 1
Persons involved in fatal accidents: 3
Pedestrians involved in fatal accidents: 0
2004 - 2017 National Fire Incident Reporting System (NFIRS) incidents
Based on the data from the years 2004 - 2017 the average number of fire incidents per year is 15. The highest number of reported fires - 34 took place in 2007, and the least - 4 in 2004. The data has an increasing trend.
When looking into fire subcategories, the most incidents belonged to: Outside Fires (42.1%), and Structure Fires (38.4%).
Fire incident types reported to NFIRS in Zip Code 22435


 Nearest zip codes: 22511, 22488, 22460, 22529, 22469, 22473.


 Based on the data from the years 2004 - 2017 the average number of fire incidents per year is 15. The highest number of reported fires - 34 took place in 2007, and the least - 4 in 2004. The data has an increasing trend.
 When looking into fire subcategories, the most incidents belonged to: Outside Fires (42.1%), and Structure Fires (38.4%).