Estimated zip code population in 2022: 2,066 Zip code population in 2010: 1,921 Zip code population in 2000: 2,037
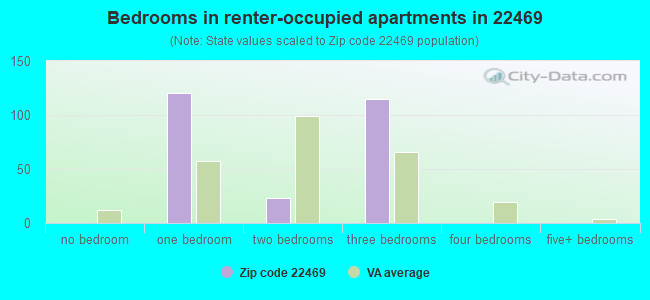
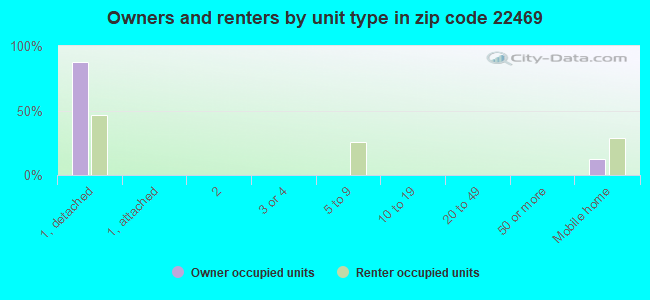
Houses and condos: 1,738 Renter-occupied apartments: 255
% of renters here:
25%
State:
33%
March 2022 cost of living index in zip code 22469: 87.8 (less than average, U.S. average is 100)
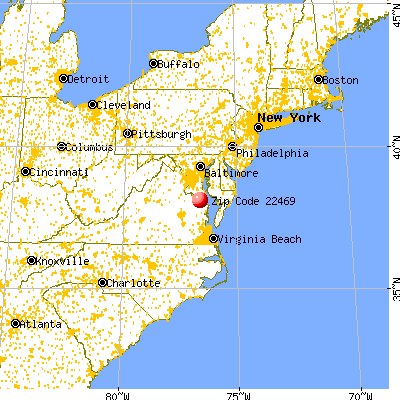
Land area: 31.1 sq. mi. Water area: 3.1 sq. mi.
Population density: 66 people per square mile
(very low).
OSM Map
General Map
Google Map
MSN Map
OSM Map
General Map
Google Map
MSN Map
OSM Map
General Map
Google Map
MSN Map
OSM Map
General Map
Google Map
MSN Map
Please wait while loading the map...
Real estate property taxes paid for housing units in 2022:
This zip code:
0.6% ($2,118)
Virginia:
0.7% ($2,617)
Median real estate property taxes paid for housing units with mortgages in 2022: $1,405 (0.6%) Median real estate property taxes paid for housing units with no mortgage in 2022: $2,581 (0.7%)
Business Search- 14 Million verified businesses
Males: 1,079
(52.3%)
Females: 986
(47.7%)
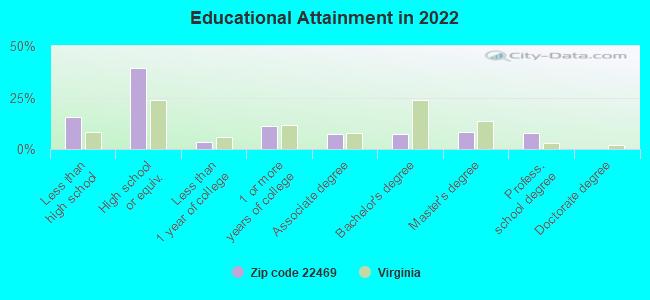
For population 25 years and over in 22469:
High school or higher: 83.4%
Bachelor's degree or higher: 22.7%
Graduate or professional degree: 15.7%
Unemployed: 1.0%
Mean travel time to work (commute): 48.6 minutes
For population 15 years and over in 22469:
Never married: 37.2%
Now married: 43.5%
Separated: 5.6%
Widowed: 5.1%
Divorced: 8.6%
Zip code 22469 compared to state average:
Median household income below state average.
Unemployed percentage significantly below state average.
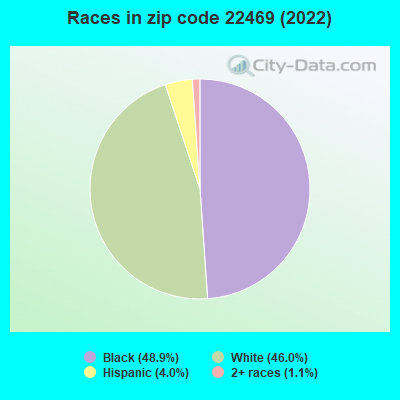
Black race population percentage above state average.
Hispanic race population percentage below state average.
Median age significantly above state average.
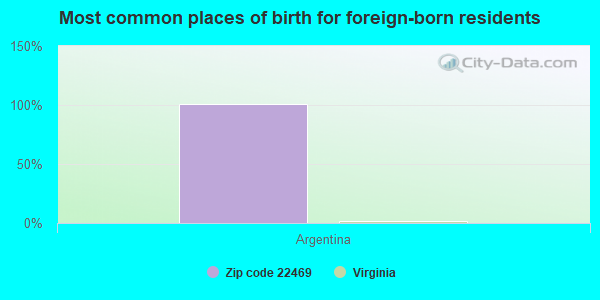
Foreign-born population percentage significantly below state average.
Length of stay since moving in below state average.
Number of college students significantly below state average.
Percentage of population with a bachelor's degree or higher below state average.
Averages for the 2020 tax year for zip code 22469, filed in 2021:
Average Adjusted Gross Income (AGI) in 2020: $52,276 (Individual Income Tax Returns)
Here:
$52,276
State:
$86,446
Salary/wage: $41,426 (reported on 77.7% of returns)
Here:
$41,426
State:
$71,185
(% of AGI for various income ranges: 1246.7% for AGIs below $25k, 3654.5% for AGIs $25k-50k, 5899.0% for AGIs $50k-75k, 7792.5% for AGIs $75k-100k, 10230.0% for AGIs $100k-200k)
Taxable interest for individuals: $1,205 (reported on 23.4% of returns)
This zip code:
$1,205
Virginia:
$1,805
(% of AGI for various income ranges: 11.5% for AGIs below $25k, 13.5% for AGIs $25k-50k, 78.0% for AGIs $50k-75k, 80.0% for AGIs $75k-100k, 161.7% for AGIs $100k-200k)
Ordinary dividends: $6,914 (reported on 14.9% of returns)
Here:
$6,914
State:
$8,327
(% of AGI for various income ranges: 9.6% for AGIs below $25k, 137.0% for AGIs $50k-75k, 550.0% for AGIs $75k-100k, 975.0% for AGIs $100k-200k)
Net capital gain/loss in AGI: +$13,100 (reported on 12.8% of returns)
Here:
+$13,100
State:
+$24,644
(% of AGI for various income ranges: 250.0% for AGIs $50k-75k, 2203.3% for AGIs $100k-200k)
Profit/loss from business: +$4,871 (reported on 14.9% of returns)
Here:
+$4,871
State:
+$12,836
(% of AGI for various income ranges: 58.9% for AGIs below $25k, 53.5% for AGIs $25k-50k, 785.0% for AGIs $100k-200k)
Taxable individual retirement arrangement distribution: $19,971 (reported on 7.4% of returns)
22469:
$19,971
Virginia:
$21,535
(% of AGI for various income ranges: 279.0% for AGIs $25k-50k, 1400.0% for AGIs $100k-200k)
Total itemized deductions: $32,978 (reported on 9.6% of returns)
Here:
$32,978
State:
$33,287
(% of AGI for various income ranges: 185.6% for AGIs below $25k, 946.0% for AGIs $50k-75k, 2535.0% for AGIs $100k-200k)
Charity contributions: $7,188 (reported on 8.5% of returns)
Here:
$7,188
State:
$10,381
(% of AGI for various income ranges: 208.0% for AGIs $50k-75k, 611.7% for AGIs $100k-200k)
Taxes paid: $6,578 (reported on 9.6% of returns)
22469:
$6,578
State:
$8,284
(% of AGI for various income ranges: 23.3% for AGIs below $25k, 144.0% for AGIs $50k-75k, 641.7% for AGIs $100k-200k)
Earned income credit: $2,495 (reported on 21.3% of returns)
Here:
$2,495
State:
$2,214
(% of AGI for various income ranges: 133.0% for AGIs below $25k, 70.0% for AGIs $25k-50k)
Percentage of individuals using paid preparers for their 2020 taxes: 92.6%
Here:
93%
State:
92%
(% for various income ranges: 91.7% for AGIs below $25k, 92.0% for AGIs $25k-50k, 92.9% for AGIs $50k-75k, 85.7% for AGIs $75k-100k, 100.0% for AGIs $100k-200k, 100.0% for AGIs over 200k)
Averages for the 2012 tax year for zip code 22469, filed in 2013:
Average Adjusted Gross Income (AGI) in 2012: $40,156 (Individual Income Tax Returns)
Here:
$40,156
State:
$71,192
Salary/wage: $31,425 (reported on 80.9% of returns)
Here:
$31,425
State:
$59,229
(% of AGI for various income ranges: 76.4% for AGIs below $25k, 79.7% for AGIs $25k-50k, 65.8% for AGIs $50k-75k, 61.4% for AGIs $75k-100k, 44.4% for AGIs $100k-200k)
Taxable interest for individuals: $1,130 (reported on 25.8% of returns)
This zip code:
$1,130
Virginia:
$1,600
(% of AGI for various income ranges: 1.4% for AGIs below $25k, 0.4% for AGIs $25k-50k, 0.9% for AGIs $50k-75k, 1.1% for AGIs $75k-100k, 0.3% for AGIs $100k-200k)
Ordinary dividends: $4,487 (reported on 16.9% of returns)
Here:
$4,487
State:
$6,959
(% of AGI for various income ranges: 1.3% for AGIs below $25k, 0.7% for AGIs $25k-50k, 0.6% for AGIs $50k-75k, 3.1% for AGIs $75k-100k, 3.1% for AGIs $100k-200k)
Net capital gain/loss in AGI: +$13,262 (reported on 9.0% of returns)
Here:
+$13,262
State:
+$16,672
(% of AGI for various income ranges: 10.3% for AGIs $100k-200k)
Profit/loss from business: +$7,075 (reported on 13.5% of returns)
Here:
+$7,075
State:
+$14,116
(% of AGI for various income ranges: 4.8% for AGIs below $25k, 1.5% for AGIs $25k-50k, 7.8% for AGIs $75k-100k)
Taxable individual retirement arrangement distribution: $9,814 (reported on 7.9% of returns)
22469:
$9,814
Virginia:
$16,667
Total itemized deductions: $20,442 (25% of AGI, reported on 27.0% of returns)
Here:
$20,442
State:
$26,596
Here:
25.2% of AGI
State:
20.1% of AGI
(% of AGI for various income ranges: 4.6% for AGIs below $25k, 12.3% for AGIs $25k-50k, 17.7% for AGIs $50k-75k, 17.7% for AGIs $75k-100k, 15.4% for AGIs $100k-200k)
Charity contributions: $4,145 (reported on 22.5% of returns)
Here:
$4,145
State:
$4,443
(% of AGI for various income ranges: 2.4% for AGIs $25k-50k, 3.3% for AGIs $50k-75k, 3.9% for AGIs $75k-100k, 2.1% for AGIs $100k-200k)
Taxes paid: $5,292 (reported on 27.0% of returns)
22469:
$5,292
State:
$9,951
(% of AGI for various income ranges: 0.7% for AGIs below $25k, 2.0% for AGIs $25k-50k, 3.5% for AGIs $50k-75k, 4.2% for AGIs $75k-100k, 6.0% for AGIs $100k-200k)
Earned income credit: $2,320 (reported on 28.1% of returns)
Here:
$2,320
State:
$2,211
(% of AGI for various income ranges: 8.0% for AGIs below $25k, 1.4% for AGIs $25k-50k)
Percentage of individuals using paid preparers for their 2012 taxes: 53.9%
Here:
54%
State:
46%
(% for various income ranges: 54.3% for AGIs below $25k, 50.0% for AGIs $25k-50k, 50.0% for AGIs $50k-75k, 57.1% for AGIs $75k-100k, 66.7% for AGIs $100k-200k)
Averages for the 2004 tax year for zip code 22469, filed in 2005:
Average Adjusted Gross Income (AGI) in 2004: $34,068 (Individual Income Tax Returns)
Here:
$34,068
State:
$56,704
Salary/wage: $29,050 (reported on 83.4% of returns)
Here:
$29,050
State:
$48,441
(% of AGI for various income ranges: 85.8% for AGIs below $10k, 83.2% for AGIs $10k-25k, 76.6% for AGIs $25k-50k, 70.4% for AGIs $50k-75k, 63.0% for AGIs $75k-100k, 60.3% for AGIs over 100k)
Taxable interest for individuals: $1,364 (reported on 30.4% of returns)
This zip code:
$1,364
Virginia:
$1,688
(% of AGI for various income ranges: 4.2% for AGIs below $10k, 2.0% for AGIs $10k-25k, 1.1% for AGIs $25k-50k, 1.0% for AGIs $50k-75k, 0.8% for AGIs $75k-100k, 0.8% for AGIs over 100k)
Taxable dividends: $2,300 (reported on 14.5% of returns)
Here:
$2,300
State:
$4,028
(% of AGI for various income ranges: 1.6% for AGIs below $10k, 0.4% for AGIs $10k-25k, 0.7% for AGIs $25k-50k, 1.9% for AGIs $50k-75k, 0.5% for AGIs $75k-100k, 1.0% for AGIs over 100k)
Net capital gain/loss: +$5,639 (reported on 10.9% of returns)
Here:
+$5,639
State:
+$14,375
(% of AGI for various income ranges: -0.3% for AGIs below $10k, 1.7% for AGIs $25k-50k, 1.9% for AGIs $50k-75k, 1.9% for AGIs $75k-100k, 3.3% for AGIs over 100k)
Profit/loss from business: +$6,434 (reported on 13.0% of returns)
Here:
+$6,434
State:
+$13,342
(% of AGI for various income ranges: 7.9% for AGIs below $10k, 2.6% for AGIs $10k-25k, 0.6% for AGIs $25k-50k, 1.6% for AGIs $50k-75k, 5.3% for AGIs over 100k)
Profit/loss from farming: +$154 (reported on 1.7% of returns)
Here:
+$154
State:
-$5,267
Total itemized deductions: $16,523 (24% of AGI, reported on 26.2% of returns)
Here:
$16,523
State:
$21,492
Here:
23.9% of AGI
State:
21.0% of AGI
(% of AGI for various income ranges: 7.3% for AGIs $10k-25k, 13.2% for AGIs $25k-50k, 17.8% for AGIs $50k-75k, 18.1% for AGIs $75k-100k, 10.9% for AGIs over 100k)
Charity contributions deductions: $3,497 (5% of AGI, reported on 22.5% of returns)
Here:
$3,497
State:
$3,794
Here:
4.8% of AGI
State:
3.5% of AGI
(% of AGI for various income ranges: 0.6% for AGIs $10k-25k, 2.3% for AGIs $25k-50k, 3.3% for AGIs $50k-75k, 5.2% for AGIs $75k-100k, 1.6% for AGIs over 100k)
Total tax: $5,331 (reported on 63.7% of returns)
22469:
$5,331
State:
$9,537
(% of AGI for various income ranges: 2.2% for AGIs below $10k, 3.4% for AGIs $10k-25k, 6.3% for AGIs $25k-50k, 8.4% for AGIs $50k-75k, 10.1% for AGIs $75k-100k, 20.2% for AGIs over 100k)
Earned income credit: $1,916 (reported on 29.7% of returns)
Here:
$1,916
State:
$1,734
Percentage of individuals using paid preparers for their 2004 taxes: 60.7%
Here:
61%
State:
52%
(% for various income ranges: 55.4% for AGIs below $10k, 66.8% for AGIs $10k-25k, 58.7% for AGIs $25k-50k, 63.0% for AGIs $50k-75k, 60.0% for AGIs $75k-100k, 52.8% for AGIs over 100k)
Household received Food Stamps/SNAP in the past 12 months: 312 Household did not receive Food Stamps/SNAP in the past 12 months: 751
Women who had a birth in the past 12 months: 88 (0 now married, 82 unmarried) Women who did not have a birth in the past 12 months: 303 (147 now married, 154 unmarried)
Housing units in zip code 22469 with a mortgage: 475 (49 second mortgage, 49 both second mortgage and home equity loan) Houses without a mortgage: 28
Median monthly owner costs for units with a mortgage: $1,272 Median monthly owner costs for units without a mortgage: $328
Residents with income below the poverty level in 2022:
This zip code:
22.4%
Whole state:
10.6%
Residents with income below 50% of the poverty level in 2022:
This zip code:
2.2%
Whole state:
5.2%
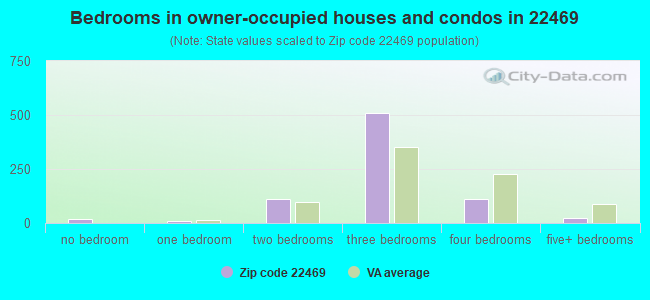
Median number of rooms in houses and condos:
Here:
6.5
State:
7.0
Median number of rooms in apartments:
Here:
3.9
State:
4.3
Notable locations in this zip code not listed on our city pages
Notable locations in zip code 22469: Pond-A-River Marina (A), Mount Pleasant Farm (B), Devils Corner (C), Kinsale Fire Department Meeting Hall (D), Nomini Hall (E), Cople District Volunteer Fire Department Engine Company 32 - Coles Point Substation (F). Display/hide their locations on the map
Churches in zip code 22469 include: Potomac Church (A), Bible Way Church (B), Saint Pauls Church (C), Coles Point United Methodist Church (D), Jerusalem Church (E). Display/hide their locations on the map
Lakes, reservoirs, and swamps: Long Pond (A), Cherry Grove Pond (B), Blackbeard Pond (C), Beales Millpond (D), Newtons Pond (E), Drum Bay Marsh (F), Grannys Bar (G). Display/hide their locations on the map
Streams, rivers, and creeks: Thompson Branch (A), Tavern Run (B), Oldham Run (C), Newtons Mill Run (D), Mount Pleasant Branch (E), Bull Neck Run (F), Lee Creek (G), Jones Branch (H), Jackson Creek (I). Display/hide their locations on the map
Facilities with environmental interests located in this zip code:
COPLE ELEM. (7114 COPLE HIGHWAY in HAGUE, VA)
(National Center for Education Statistics) - STATE ID-0950210 Organizations: WESTMORELAND COUNTY PUBLIC SCHOOLS (SCHOOL DISTRICT)
Housing units lacking complete plumbing facilities: 1.9% Housing units lacking complete kitchen facilities: 1.4%
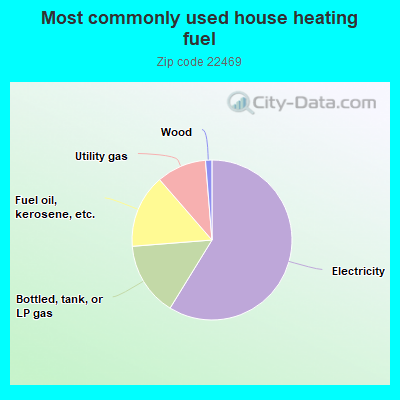
58.9%Electricity
15.0%Bottled, tank, or LP gas
14.9%Fuel oil, kerosene, etc.
10.1%Utility gas
1.3%Wood
Population in 1990: 2,243.
Place of birth for U.S.-born residents:
This state: 1,363
Northeast: 129
Midwest: 45
South: 340
West: 97
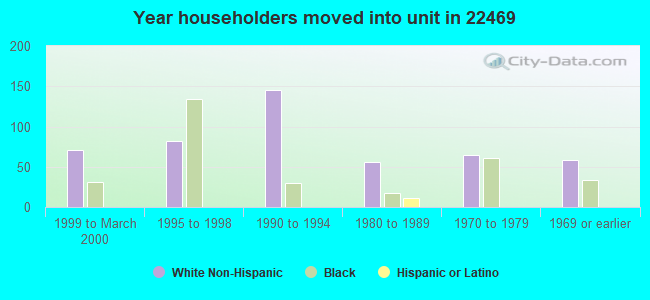
62% of the 22469 zip code residents lived in the same house 5 years ago. Out of people who lived in different houses, 50% lived in this county. Out of people who lived in different counties, 50% lived in Virginia.
82% of the 22469 zip code residents lived in the same house 1 year ago. Out of people who lived in different houses, 24% moved from this county. Out of people who lived in different houses, 68% moved from different county within same state. Out of people who lived in different houses, 7% moved from different state.
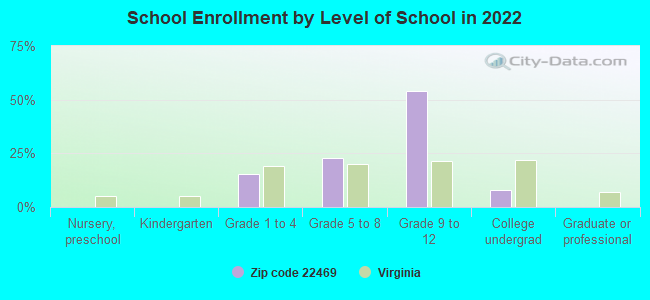
Private vs. public school enrollment:
Students in private schools in grades 1 to 8 (elementary and middle school):
Here:
0.0%
Virginia:
13.2%
Students in private schools in grades 9 to 12 (high school):
Here:
0.0%
Virginia:
10.2%
Students in private undergraduate colleges:
Here:
0.0%
Virginia:
18.7%
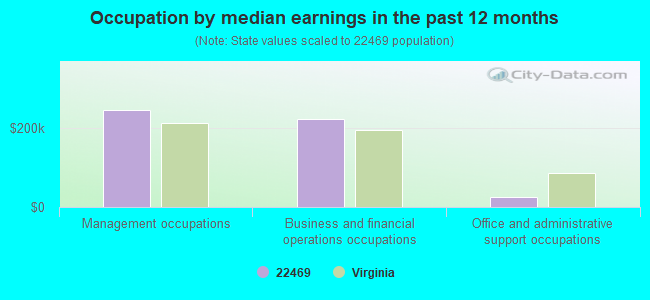
Occupation by median earnings in the past 12 months ($)
245,373Management occupations
221,608Business and financial operations occupations
24,537Office and administrative support occupations
Top industries in this zip code by the number of employees in 2005:
Construction: Highway, Street, and Bridge Construction (20-49 employees: 1 establishment)
Accommodation and Food Services: Full-Service Restaurants (10-19: 1, 1-4: 2)
Administrative and Support and Waste Management and Remediation Services: Exterminating and Pest Control Services (10-19: 1)
Construction: Residential Remodelers (10-19: 1)
Information: Libraries and Archives (5-9: 1)
Finance and Insurance: Commercial Banking (5-9: 1)
Other Services (except Public Administration): Religious Organizations (1-4: 3)
Fatal accident statistics in 2014:
Fatal accident count: 1
Vehicles involved in fatal accidents: 2
Fatal accidents caused by drunken drivers: 0
Fatalities: 1
Persons involved in fatal accidents: 2
Pedestrians involved in fatal accidents: 0
2004 - 2018 National Fire Incident Reporting System (NFIRS) incidents
Based on the data from the years 2004 - 2018 the average number of fire incidents per year is 12. The highest number of fires - 26 took place in 2009, and the least - 1 in 2012. The data has a declining trend.
When looking into fire subcategories, the most incidents belonged to: Outside Fires (43.2%), and Structure Fires (40.0%).
Fire incident types reported to NFIRS in Zip Code 22469


+$154
-$5,267
 Nearest zip codes: 22488, 22529, 22435, 20690, 20674, 22520.


 (Students: 443, Location: 7114 COPLE HIGHWAY, Grades: PK-5)

 Based on the data from the years 2004 - 2018 the average number of fire incidents per year is 12. The highest number of fires - 26 took place in 2009, and the least - 1 in 2012. The data has a declining trend.
 When looking into fire subcategories, the most incidents belonged to: Outside Fires (43.2%), and Structure Fires (40.0%).