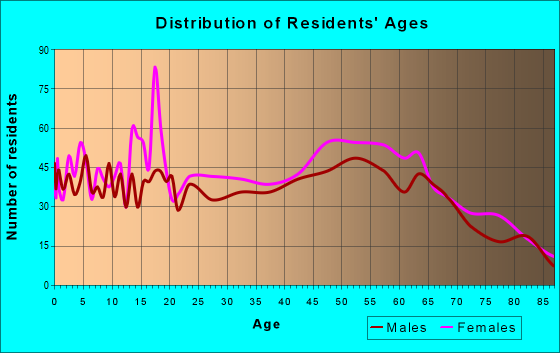
Estimated zip code population in 2022: 6,722 Zip code population in 2010: 6,704 Zip code population in 2000: 5,664
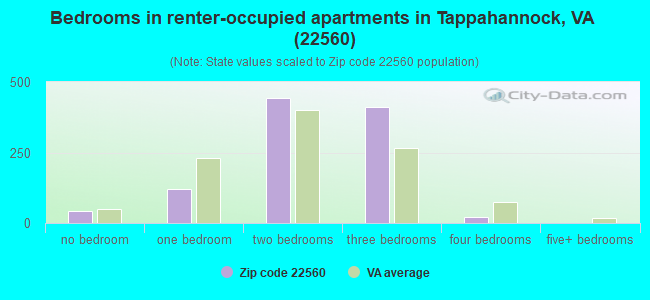
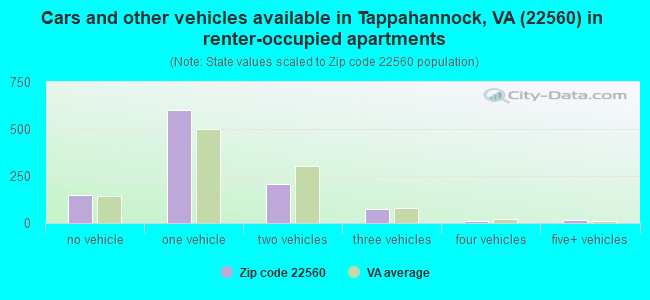
Houses and condos: 3,448 Renter-occupied apartments: 1,045
% of renters here:
38%
State:
33%
March 2022 cost of living index in zip code 22560: 85.9 (less than average, U.S. average is 100)
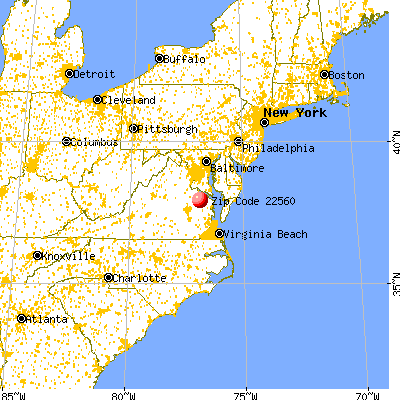
Land area: 91.2 sq. mi. Water area: 7.8 sq. mi.
Population density: 74 people per square mile
(very low).
OSM Map
General Map
Google Map
MSN Map
OSM Map
General Map
Google Map
MSN Map
OSM Map
General Map
Google Map
MSN Map
OSM Map
General Map
Google Map
MSN Map
Please wait while loading the map...
Real estate property taxes paid for housing units in 2022:
This zip code:
0.6% ($1,417)
Virginia:
0.7% ($2,617)
Median real estate property taxes paid for housing units with mortgages in 2022: $1,662 (0.8%) Median real estate property taxes paid for housing units with no mortgage in 2022: $1,258 (0.5%)
Averages for the 2020 tax year for zip code 22560, filed in 2021:
Average Adjusted Gross Income (AGI) in 2020: $54,594 (Individual Income Tax Returns)
Here:
$54,594
State:
$86,446
Salary/wage: $44,325 (reported on 82.1% of returns)
Here:
$44,325
State:
$71,185
(% of AGI for various income ranges: 1239.6% for AGIs below $25k, 3655.7% for AGIs $25k-50k, 6703.8% for AGIs $50k-75k, 8980.6% for AGIs $75k-100k, 15313.3% for AGIs $100k-200k, 85095.0% for AGIs over 200k)
Taxable interest for individuals: $1,520 (reported on 27.6% of returns)
This zip code:
$1,520
Virginia:
$1,805
(% of AGI for various income ranges: 14.1% for AGIs below $25k, 17.5% for AGIs $25k-50k, 67.4% for AGIs $50k-75k, 95.9% for AGIs $75k-100k, 203.3% for AGIs $100k-200k, 1860.0% for AGIs over 200k)
Ordinary dividends: $5,969 (reported on 16.7% of returns)
Here:
$5,969
State:
$8,327
(% of AGI for various income ranges: 20.7% for AGIs below $25k, 30.1% for AGIs $25k-50k, 136.2% for AGIs $50k-75k, 254.7% for AGIs $75k-100k, 568.3% for AGIs $100k-200k, 4805.0% for AGIs over 200k)
Net capital gain/loss in AGI: +$11,952 (reported on 12.7% of returns)
Here:
+$11,952
State:
+$24,644
(% of AGI for various income ranges: 17.0% for AGIs below $25k, 22.8% for AGIs $25k-50k, 69.1% for AGIs $50k-75k, 161.8% for AGIs $75k-100k, 507.2% for AGIs $100k-200k, 16400.0% for AGIs over 200k)
Profit/loss from business: +$7,335 (reported on 14.8% of returns)
Here:
+$7,335
State:
+$12,836
(% of AGI for various income ranges: 71.6% for AGIs below $25k, 46.5% for AGIs $25k-50k, 140.0% for AGIs $50k-75k, 168.8% for AGIs $75k-100k, 1028.9% for AGIs $100k-200k)
Taxable individual retirement arrangement distribution: $15,433 (reported on 9.1% of returns)
22560:
$15,433
Virginia:
$21,535
(% of AGI for various income ranges: 42.2% for AGIs below $25k, 59.7% for AGIs $25k-50k, 158.5% for AGIs $50k-75k, 384.7% for AGIs $75k-100k, 984.4% for AGIs $100k-200k, 4275.0% for AGIs over 200k)
Total itemized deductions: $27,334 (reported on 8.8% of returns)
Here:
$27,334
State:
$33,287
(% of AGI for various income ranges: 208.1% for AGIs $25k-50k, 370.9% for AGIs $50k-75k, 556.5% for AGIs $75k-100k, 1125.6% for AGIs $100k-200k, 10980.0% for AGIs over 200k)
Charity contributions: $11,243 (reported on 6.4% of returns)
Here:
$11,243
State:
$10,381
(% of AGI for various income ranges: 38.5% for AGIs $25k-50k, 97.9% for AGIs $50k-75k, 191.2% for AGIs $75k-100k, 250.0% for AGIs $100k-200k, 4880.0% for AGIs over 200k)
Taxes paid: $6,134 (reported on 8.8% of returns)
22560:
$6,134
State:
$8,284
(% of AGI for various income ranges: 36.5% for AGIs $25k-50k, 85.0% for AGIs $50k-75k, 137.6% for AGIs $75k-100k, 314.4% for AGIs $100k-200k, 2135.0% for AGIs over 200k)
Earned income credit: $2,268 (reported on 22.1% of returns)
Here:
$2,268
State:
$2,214
(% of AGI for various income ranges: 117.9% for AGIs below $25k, 82.6% for AGIs $25k-50k)
Percentage of individuals using paid preparers for their 2020 taxes: 90.3%
Here:
90%
State:
92%
(% for various income ranges: 90.7% for AGIs below $25k, 90.3% for AGIs $25k-50k, 90.0% for AGIs $50k-75k, 88.5% for AGIs $75k-100k, 90.9% for AGIs $100k-200k, 90.0% for AGIs over 200k)
Averages for the 2012 tax year for zip code 22560, filed in 2013:
Average Adjusted Gross Income (AGI) in 2012: $48,661 (Individual Income Tax Returns)
Here:
$48,661
State:
$71,192
Salary/wage: $37,357 (reported on 85.0% of returns)
Here:
$37,357
State:
$59,229
(% of AGI for various income ranges: 81.1% for AGIs below $25k, 81.6% for AGIs $25k-50k, 72.6% for AGIs $50k-75k, 66.2% for AGIs $75k-100k, 64.7% for AGIs $100k-200k, 29.1% for AGIs over 200k)
Taxable interest for individuals: $1,595 (reported on 31.3% of returns)
This zip code:
$1,595
Virginia:
$1,600
(% of AGI for various income ranges: 1.3% for AGIs below $25k, 0.8% for AGIs $25k-50k, 0.7% for AGIs $50k-75k, 1.0% for AGIs $75k-100k, 1.2% for AGIs $100k-200k, 1.2% for AGIs over 200k)
Ordinary dividends: $5,749 (reported on 16.3% of returns)
Here:
$5,749
State:
$6,959
(% of AGI for various income ranges: 1.3% for AGIs below $25k, 0.8% for AGIs $25k-50k, 1.9% for AGIs $50k-75k, 2.1% for AGIs $75k-100k, 2.5% for AGIs $100k-200k, 2.7% for AGIs over 200k)
Net capital gain/loss in AGI: +$8,738 (reported on 12.0% of returns)
Here:
+$8,738
State:
+$16,672
(% of AGI for various income ranges: 0.1% for AGIs below $25k, 0.3% for AGIs $25k-50k, 0.9% for AGIs $50k-75k, 1.3% for AGIs $75k-100k, 3.6% for AGIs $100k-200k, 5.6% for AGIs over 200k)
Profit/loss from business: +$8,216 (reported on 13.8% of returns)
Here:
+$8,216
State:
+$14,116
(% of AGI for various income ranges: 5.0% for AGIs below $25k, 1.4% for AGIs $25k-50k, 1.6% for AGIs $50k-75k, 1.5% for AGIs $75k-100k, 4.7% for AGIs $100k-200k)
Taxable individual retirement arrangement distribution: $14,256 (reported on 9.8% of returns)
22560:
$14,256
Virginia:
$16,667
(% of AGI for various income ranges: 2.2% for AGIs below $25k, 2.1% for AGIs $25k-50k, 3.5% for AGIs $50k-75k, 2.7% for AGIs $75k-100k, 5.9% for AGIs $100k-200k)
Total itemized deductions: $21,631 (23% of AGI, reported on 30.4% of returns)
Here:
$21,631
State:
$26,596
Here:
22.9% of AGI
State:
20.1% of AGI
(% of AGI for various income ranges: 10.4% for AGIs below $25k, 11.0% for AGIs $25k-50k, 15.6% for AGIs $50k-75k, 15.1% for AGIs $75k-100k, 16.0% for AGIs $100k-200k, 12.2% for AGIs over 200k)
Charity contributions: $4,054 (reported on 24.2% of returns)
Here:
$4,054
State:
$4,443
(% of AGI for various income ranges: 0.8% for AGIs below $25k, 1.2% for AGIs $25k-50k, 2.4% for AGIs $50k-75k, 2.1% for AGIs $75k-100k, 3.3% for AGIs $100k-200k, 1.7% for AGIs over 200k)
Taxes paid: $6,983 (reported on 30.1% of returns)
22560:
$6,983
State:
$9,951
(% of AGI for various income ranges: 1.6% for AGIs below $25k, 2.3% for AGIs $25k-50k, 4.1% for AGIs $50k-75k, 4.2% for AGIs $75k-100k, 5.8% for AGIs $100k-200k, 6.9% for AGIs over 200k)
Earned income credit: $2,371 (reported on 25.5% of returns)
Here:
$2,371
State:
$2,211
(% of AGI for various income ranges: 8.8% for AGIs below $25k, 1.1% for AGIs $25k-50k)
Percentage of individuals using paid preparers for their 2012 taxes: 49.4%
Here:
49%
State:
46%
(% for various income ranges: 45.7% for AGIs below $25k, 48.3% for AGIs $25k-50k, 52.4% for AGIs $50k-75k, 50.0% for AGIs $75k-100k, 61.5% for AGIs $100k-200k, 80.0% for AGIs over 200k)
Averages for the 2004 tax year for zip code 22560, filed in 2005:
Average Adjusted Gross Income (AGI) in 2004: $38,794 (Individual Income Tax Returns)
Here:
$38,794
State:
$56,704
Salary/wage: $32,729 (reported on 85.5% of returns)
Here:
$32,729
State:
$48,441
(% of AGI for various income ranges: 124.1% for AGIs below $10k, 81.9% for AGIs $10k-25k, 80.9% for AGIs $25k-50k, 77.6% for AGIs $50k-75k, 77.2% for AGIs $75k-100k, 52.1% for AGIs over 100k)
Taxable interest for individuals: $2,061 (reported on 39.3% of returns)
This zip code:
$2,061
Virginia:
$1,688
(% of AGI for various income ranges: 5.7% for AGIs below $10k, 2.0% for AGIs $10k-25k, 1.4% for AGIs $25k-50k, 1.6% for AGIs $50k-75k, 1.7% for AGIs $75k-100k, 2.9% for AGIs over 100k)
Taxable dividends: $3,528 (reported on 22.3% of returns)
Here:
$3,528
State:
$4,028
(% of AGI for various income ranges: 6.8% for AGIs below $10k, 1.6% for AGIs $10k-25k, 1.7% for AGIs $25k-50k, 1.7% for AGIs $50k-75k, 1.3% for AGIs $75k-100k, 2.7% for AGIs over 100k)
Net capital gain/loss: +$13,113 (reported on 16.4% of returns)
Here:
+$13,113
State:
+$14,375
(% of AGI for various income ranges: -1.9% for AGIs below $10k, 1.1% for AGIs $10k-25k, 1.2% for AGIs $25k-50k, 2.0% for AGIs $50k-75k, 4.6% for AGIs $75k-100k, 14.0% for AGIs over 100k)
Profit/loss from business: +$11,353 (reported on 12.7% of returns)
Here:
+$11,353
State:
+$13,342
(% of AGI for various income ranges: -9.3% for AGIs below $10k, 4.4% for AGIs $10k-25k, 2.2% for AGIs $25k-50k, 2.7% for AGIs $50k-75k, 2.5% for AGIs $75k-100k, 6.7% for AGIs over 100k)
IRA payment deduction: $2,947 (reported on 3.1% of returns)
22560:
$2,947
Virginia:
$2,943
(% of AGI for various income ranges: 0.2% for AGIs $10k-25k, 0.3% for AGIs $25k-50k, 0.3% for AGIs $50k-75k, 0.2% for AGIs $75k-100k, 0.2% for AGIs over 100k)
Self-employed pension: $15,143 (reported on 0.5% of returns)
Here:
$15,143
Virginia:
$17,430
Total itemized deductions: $17,638 (23% of AGI, reported on 28.0% of returns)
Here:
$17,638
State:
$21,492
Here:
23.4% of AGI
State:
21.0% of AGI
(% of AGI for various income ranges: 9.6% for AGIs below $10k, 8.4% for AGIs $10k-25k, 11.5% for AGIs $25k-50k, 15.3% for AGIs $50k-75k, 15.0% for AGIs $75k-100k, 13.4% for AGIs over 100k)
Charity contributions deductions: $3,277 (4% of AGI, reported on 24.6% of returns)
Here:
$3,277
State:
$3,794
Here:
4.2% of AGI
State:
3.5% of AGI
(% of AGI for various income ranges: 0.7% for AGIs below $10k, 0.8% for AGIs $10k-25k, 1.7% for AGIs $25k-50k, 2.1% for AGIs $50k-75k, 2.9% for AGIs $75k-100k, 2.7% for AGIs over 100k)
Total tax: $5,752 (reported on 69.9% of returns)
22560:
$5,752
State:
$9,537
(% of AGI for various income ranges: 4.1% for AGIs below $10k, 3.8% for AGIs $10k-25k, 6.7% for AGIs $25k-50k, 9.0% for AGIs $50k-75k, 10.2% for AGIs $75k-100k, 17.4% for AGIs over 100k)
Earned income credit: $1,801 (reported on 23.3% of returns)
Here:
$1,801
State:
$1,734
Percentage of individuals using paid preparers for their 2004 taxes: 54.6%
Here:
55%
State:
52%
(% for various income ranges: 47.9% for AGIs below $10k, 56.5% for AGIs $10k-25k, 53.3% for AGIs $25k-50k, 54.0% for AGIs $50k-75k, 60.3% for AGIs $75k-100k, 68.0% for AGIs over 100k)
Likely homosexual households (counted as self-reported same-sex unmarried-partner households)
Lesbian couples: 0.0% of all households
Gay men: 0.3% of all households
Household received Food Stamps/SNAP in the past 12 months: 576 Household did not receive Food Stamps/SNAP in the past 12 months: 2,228
Women who had a birth in the past 12 months: 90 (0 now married, 84 unmarried) Women who did not have a birth in the past 12 months: 1,311 (518 now married, 794 unmarried)
Housing units in zip code 22560 with a mortgage: 892 (56 second mortgage, 15 home equity loan, 34 both second mortgage and home equity loan) Houses without a mortgage: 1
Median monthly owner costs for units with a mortgage: $1,208 Median monthly owner costs for units without a mortgage: $470
Residents with income below the poverty level in 2022:
This zip code:
18.0%
Whole state:
10.6%
Residents with income below 50% of the poverty level in 2022:
This zip code:
10.7%
Whole state:
5.2%
Median number of rooms in houses and condos:
Here:
6.3
State:
7.0
Median number of rooms in apartments:
Here:
4.6
State:
4.3
Notable locations in this zip code not listed on our city pages
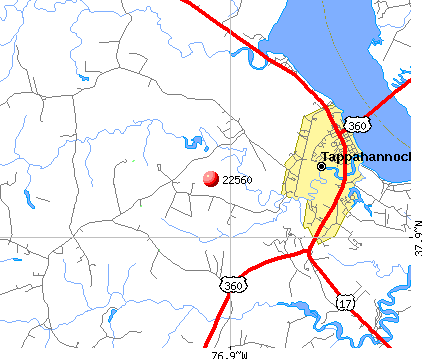
Notable locations in zip code 22560: Gram Landing (A), Persimmon Tree Landing (B), Baker Landing (C), Salt Bank Landing (D), Mose Landing (E), Hickory Landing (F), Bakers Landing (G), Gram Landing (H), Hickory Landing (I), Mose Landing (J), Persimmon Tree Landing (K), Salt Bank Landing (L), Hobbs Hole Golf Course (M), Woodside Country Club (N), Tappahannock Volunteer Rescue Squad (O), Brockenbrough House (P), Upper King and Queen Rescue Squad (Q), Essex County Sheriff's Office (R), Tappahannock Police Department (S), Tappahannock - Essex Volunteer Fire Department Station 1 (T). Display/hide their locations on the map
Churches in zip code 22560 include: Rappahannock Indian Church (A), Rock of Ages Church (B), Beulah Church (C), Saint Johns Church (D), Saint Pauls Church (E), Rappahannock Christian Center (F), Tappahannock Seventh Day Adventist Church (G), Faith Baptist Church (H), First Union Church (I). Display/hide their locations on the map
Reservoirs and swamps: Millers Pond (A), Cheatwood Millpond (B), Scotts Millpond (C), Wrights Millpond (D), Criddlin Swamp (E), Church Swamp (F). Display/hide their locations on the map
Streams, rivers, and creeks: Sturgeon Swamp (A), Quioccasin Creek (B), Mount Landing Creek (C), Hoskins Creek (D), Broad Creek (E), Harry Lane Swamp (F), Mariners Branch (G), Merryvayle Creek (H), Ticknors Creek (I). Display/hide their locations on the map
In group quarters: 126 (-1 institutionalized population)
Size of family households: 1,062 2-persons, 411 3-persons, 150 4-persons, 73 5-persons, 96 6-persons, 6 7-or-more-persons
Size of nonfamily households: 857 1-person, 95 2-persons, 11 3-persons
400 married couples with children.
597 single-parent households (71 men, 526 women).
95.8% of residents of 22560 zip code speak English at home.
1.8% of residents speak Spanish at home (87% very well, 4% well, 1% not well, 9% not at all).
1.5% of residents speak other Indo-European language at home (66% very well, 21% well, 13% not well).
0.8% of residents speak Asian or Pacific Island language at home (36% very well, 46% well, 18% not well).
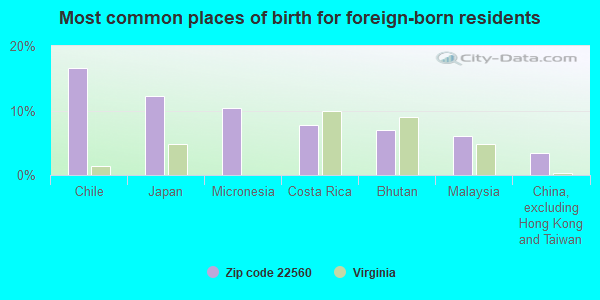
Foreign born population: 118 (1.8%) (79.1% of them are naturalized citizens)
This zip code:
1.8%
Whole state:
12.7%
17%Chile
12%Japan
10%Micronesia
8%Costa Rica
7%Bhutan
6%Malaysia
3%China, excluding Hong Kong and Taiwan
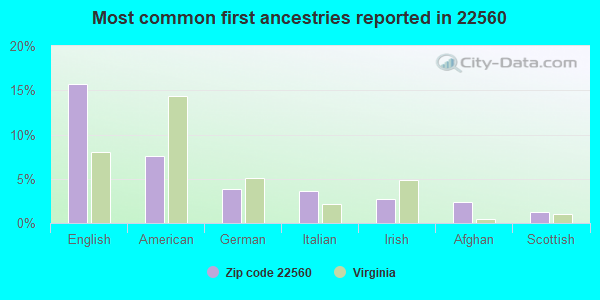
16%English
8%American
4%German
4%Italian
3%Irish
2%Afghan
1%Scottish
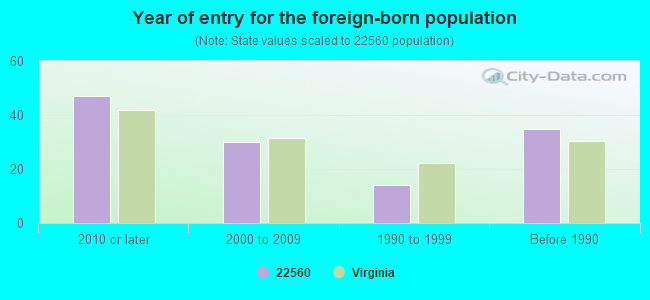
Year of entry for the foreign-born population
472010 or later
302000 to 2009
141990 to 1999
35Before 1990
Facilities with environmental interests located in this zip code:
CHESAPEAKE BAY GOV SCH (109 NORTH CROSS ST in TAPPAHANNOCK, VA)
(National Center for Education Statistics) - STATE ID-2690010
CMH LUMBER CORPORATION (RT 706 BEHIND AIRPORT in TAPPAHANNOCK, VA)
AIR MINOR (AIRS/AFS) Business SIC classification: SAWMILLS AND PLANING MILLS, GENERAL
COASTAL MART INC #888 (928 CHURCH ST in TAPPAHANNOCK, VA)
Small Quantity Generators, between 100 kg and 1000 kg of hazardous waste/month (Resource Conservation and Recovery Act (tracking hazardous waste)) - notification Organizations: OPERNAME (CONTACT/OPERATOR)
, L M HUGHEY CO (CONTACT/OWNER)
CHANDLER CHEVROLET OLD INC (1250 TAPPAHANNOCK BLVD in TAPPAHANNOCK, VA)
Conditionally Exempt Small Quantity Generators, less than 100 kg/month of hazardous waste (Resource Conservation and Recovery Act (tracking hazardous waste))
Housing units lacking complete plumbing facilities: 4.1% Housing units lacking complete kitchen facilities: 2.5%
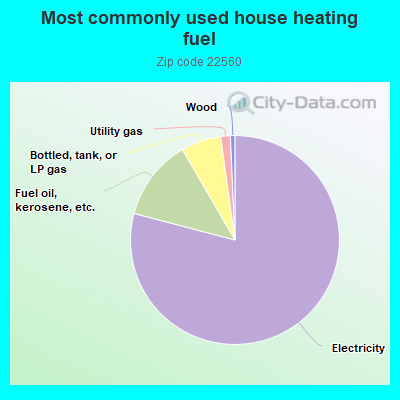
79.1%Electricity
12.5%Fuel oil, kerosene, etc.
6.2%Bottled, tank, or LP gas
1.5%Utility gas
0.7%Wood
Population in 1990: 4,270. Population change in the 1990s: +1,394 (+32.6%).
Place of birth for U.S.-born residents:
This state: 5,000
Northeast: 683
Midwest: 103
South: 723
West: 44
60% of the 22560 zip code residents lived in the same house 5 years ago. Out of people who lived in different houses, 49% lived in this county. Out of people who lived in different counties, 50% lived in Virginia.
91% of the 22560 zip code residents lived in the same house 1 year ago. Out of people who lived in different houses, 21% moved from this county. Out of people who lived in different houses, 46% moved from different county within same state. Out of people who lived in different houses, 36% moved from different state. Out of people who lived in different houses, 0% moved from abroad.
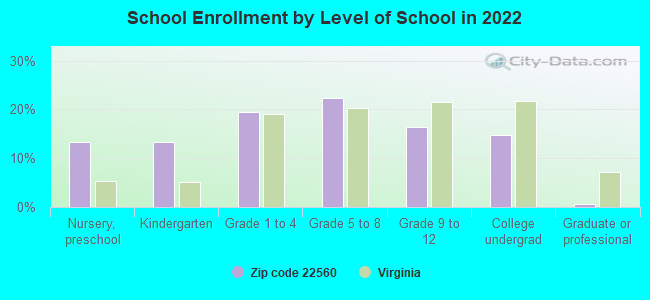
Private vs. public school enrollment:
Students in private schools in grades 1 to 8 (elementary and middle school): 97
Here:
18.0%
Virginia:
13.2%
Students in private schools in grades 9 to 12 (high school): 28
Here:
13.6%
Virginia:
10.2%
Students in private undergraduate colleges: 14
Here:
7.5%
Virginia:
18.7%
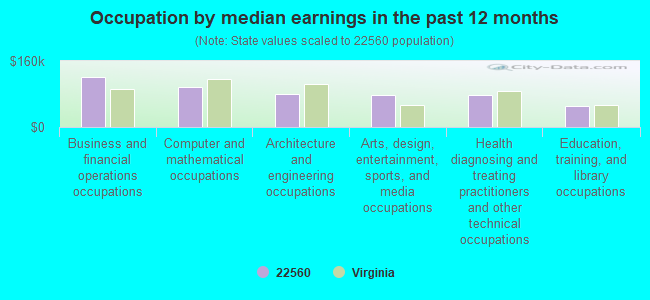
Occupation by median earnings in the past 12 months ($)
121,516Business and financial operations occupations
97,966Computer and mathematical occupations
78,812Architecture and engineering occupations
77,923Arts, design, entertainment, sports, and media occupations
77,748Health diagnosing and treating practitioners and other technical occupations
50,619Education, training, and library occupations
Top industries in this zip code by the number of employees in 2005:
Health Care and Social Assistance: General Medical and Surgical Hospitals (250-499 employees: 1 establishment)
112 people in workers' group living quarters and job corps centers
78 people in nursing facilities/skilled-nursing facilities
People in group quarters in 2000:
143 people in nursing homes
14 people in other noninstitutional group quarters
3 people in homes for the mentally retarded
Fatal accident statistics in 2014:
Fatal accident count: 4
Vehicles involved in fatal accidents: 8
Fatal accidents caused by drunken drivers: 1
Fatalities: 4
Persons involved in fatal accidents: 9
Pedestrians involved in fatal accidents: 0
Fatal accident statistics in 2013:
Fatal accident count: 1
Vehicles involved in fatal accidents: 2
Fatal accidents caused by drunken drivers: 0
Fatalities: 1
Persons involved in fatal accidents: 4
Pedestrians involved in fatal accidents: 0
2004 - 2018 National Fire Incident Reporting System (NFIRS) incidents
Based on the data from the years 2004 - 2018 the average number of fire incidents per year is 28. The highest number of reported fires - 42 took place in 2008, and the least - 17 in 2004. The data has an increasing trend.
When looking into fire subcategories, the most reports belonged to: Structure Fires (45.5%), and Outside Fires (31.0%).
Fire incident types reported to NFIRS in Zip Code 22560


 Nearest zip codes: 23115, 23148, 22438, 23023, 22454, 23177.
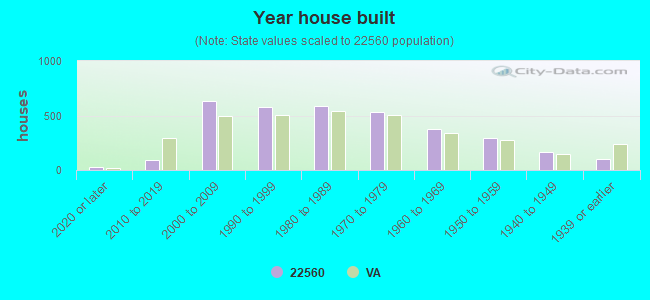


 Based on the data from the years 2004 - 2018 the average number of fire incidents per year is 28. The highest number of reported fires - 42 took place in 2008, and the least - 17 in 2004. The data has an increasing trend.
 When looking into fire subcategories, the most reports belonged to: Structure Fires (45.5%), and Outside Fires (31.0%).