Estimated zip code population in 2022: 4,244 Zip code population in 2010: 4,661 Zip code population in 2000: 3,801
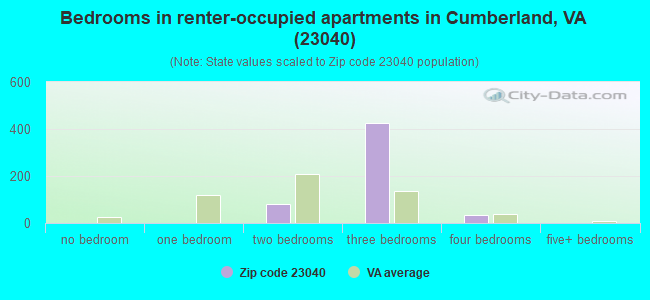
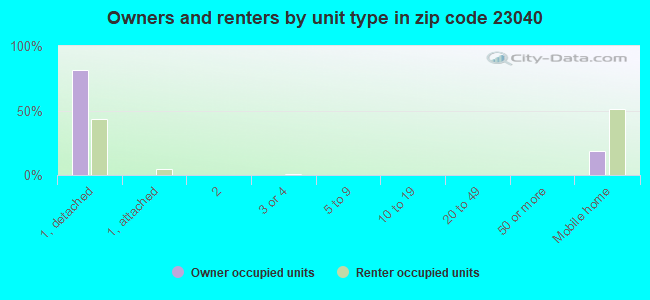
Houses and condos: 2,059 Renter-occupied apartments: 549
% of renters here:
29%
State:
33%
March 2022 cost of living index in zip code 23040: 84.1 (less than average, U.S. average is 100)
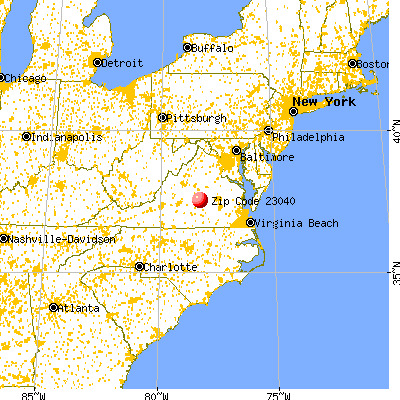
Land area: 147.3 sq. mi. Water area: 1.0 sq. mi.
Population density: 29 people per square mile
(very low).
OSM Map
General Map
Google Map
MSN Map
OSM Map
General Map
Google Map
MSN Map
OSM Map
General Map
Google Map
MSN Map
OSM Map
General Map
Google Map
MSN Map
Please wait while loading the map...
Real estate property taxes paid for housing units in 2022:
This zip code:
0.7% ($1,241)
Virginia:
0.7% ($2,617)
Median real estate property taxes paid for housing units with mortgages in 2022: $1,217 (0.7%) Median real estate property taxes paid for housing units with no mortgage in 2022: $1,285 (0.8%)
Business Search- 14 Million verified businesses
Males: 1,985
(46.8%)
Females: 2,259
(53.2%)
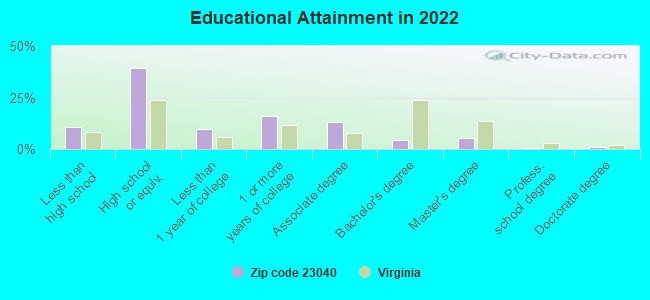
For population 25 years and over in 23040:
High school or higher: 87.9%
Bachelor's degree or higher: 10.8%
Graduate or professional degree: 6.7%
Unemployed: 4.7%
Mean travel time to work (commute): 47.9 minutes
For population 15 years and over in 23040:
Never married: 31.7%
Now married: 45.2%
Separated: 1.5%
Widowed: 8.3%
Divorced: 13.4%
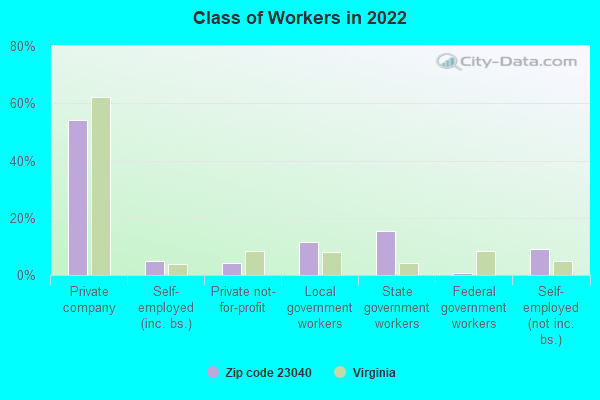
Zip code 23040 compared to state average:
Median household income below state average.
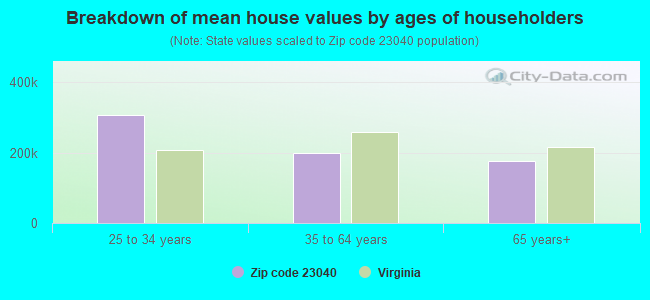
Median house value below state average.
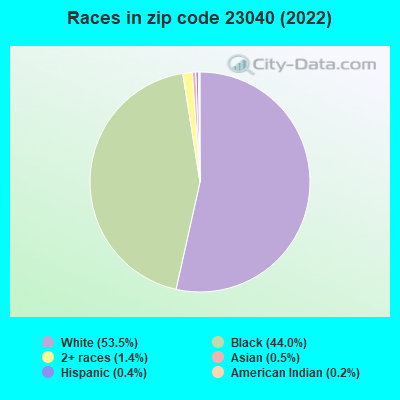
Black race population percentage above state average.
Hispanic race population percentage significantly below state average.
Median age significantly above state average.
Foreign-born population percentage significantly below state average.
Length of stay since moving in significantly above state average.
Number of college students significantly below state average.
Percentage of population with a bachelor's degree or higher significantly below state average.
Averages for the 2020 tax year for zip code 23040, filed in 2021:
Average Adjusted Gross Income (AGI) in 2020: $46,013 (Individual Income Tax Returns)
Here:
$46,013
State:
$86,446
Salary/wage: $39,751 (reported on 84.6% of returns)
Here:
$39,751
State:
$71,185
(% of AGI for various income ranges: 1179.2% for AGIs below $25k, 3728.4% for AGIs $25k-50k, 6999.1% for AGIs $50k-75k, 9972.7% for AGIs $75k-100k, 21407.8% for AGIs $100k-200k)
Taxable interest for individuals: $1,150 (reported on 19.9% of returns)
This zip code:
$1,150
Virginia:
$1,805
(% of AGI for various income ranges: 10.2% for AGIs below $25k, 19.5% for AGIs $25k-50k, 48.2% for AGIs $50k-75k, 60.9% for AGIs $75k-100k, 176.7% for AGIs $100k-200k)
Ordinary dividends: $4,583 (reported on 10.9% of returns)
Here:
$4,583
State:
$8,327
(% of AGI for various income ranges: 17.2% for AGIs below $25k, 11.9% for AGIs $25k-50k, 62.7% for AGIs $50k-75k, 190.0% for AGIs $75k-100k, 645.6% for AGIs $100k-200k)
Net capital gain/loss in AGI: +$10,395 (reported on 9.0% of returns)
Here:
+$10,395
State:
+$24,644
(% of AGI for various income ranges: 5.8% for AGIs below $25k, 18.4% for AGIs $25k-50k, 119.5% for AGIs $50k-75k, 190.0% for AGIs $75k-100k, 1627.8% for AGIs $100k-200k)
Profit/loss from business: +$7,476 (reported on 13.1% of returns)
Here:
+$7,476
State:
+$12,836
(% of AGI for various income ranges: 92.8% for AGIs below $25k, 92.8% for AGIs $25k-50k, 96.8% for AGIs $50k-75k, 162.7% for AGIs $75k-100k, 756.7% for AGIs $100k-200k)
Taxable individual retirement arrangement distribution: $11,271 (reported on 7.7% of returns)
23040:
$11,271
Virginia:
$21,535
(% of AGI for various income ranges: 37.2% for AGIs below $25k, 35.7% for AGIs $25k-50k, 183.6% for AGIs $50k-75k, 423.6% for AGIs $75k-100k, 684.4% for AGIs $100k-200k)
Total itemized deductions: $26,800 (reported on 5.4% of returns)
Here:
$26,800
State:
$33,287
(% of AGI for various income ranges: 167.1% for AGIs $25k-50k, 560.0% for AGIs $50k-75k, 1127.8% for AGIs $100k-200k)
Charity contributions: $7,433 (reported on 4.1% of returns)
Here:
$7,433
State:
$10,381
(% of AGI for various income ranges: 23.4% for AGIs $25k-50k, 109.5% for AGIs $50k-75k, 324.4% for AGIs $100k-200k)
Taxes paid: $5,958 (reported on 5.4% of returns)
23040:
$5,958
State:
$8,284
(% of AGI for various income ranges: 19.0% for AGIs $25k-50k, 114.5% for AGIs $50k-75k, 392.2% for AGIs $100k-200k)
Earned income credit: $2,263 (reported on 23.1% of returns)
Here:
$2,263
State:
$2,214
(% of AGI for various income ranges: 114.2% for AGIs below $25k, 80.9% for AGIs $25k-50k)
Percentage of individuals using paid preparers for their 2020 taxes: 93.2%
Here:
93%
State:
92%
(% for various income ranges: 93.6% for AGIs below $25k, 91.8% for AGIs $25k-50k, 93.9% for AGIs $50k-75k, 94.4% for AGIs $75k-100k, 94.1% for AGIs $100k-200k, 100.0% for AGIs over 200k)
Averages for the 2012 tax year for zip code 23040, filed in 2013:
Average Adjusted Gross Income (AGI) in 2012: $38,080 (Individual Income Tax Returns)
Here:
$38,080
State:
$71,192
Salary/wage: $33,823 (reported on 86.8% of returns)
Here:
$33,823
State:
$59,229
(% of AGI for various income ranges: 80.5% for AGIs below $25k, 85.7% for AGIs $25k-50k, 74.5% for AGIs $50k-75k, 79.0% for AGIs $75k-100k, 63.7% for AGIs $100k-200k)
Taxable interest for individuals: $1,004 (reported on 24.4% of returns)
This zip code:
$1,004
Virginia:
$1,600
(% of AGI for various income ranges: 1.3% for AGIs below $25k, 0.6% for AGIs $25k-50k, 0.6% for AGIs $50k-75k, 0.3% for AGIs $75k-100k, 0.6% for AGIs $100k-200k)
Ordinary dividends: $2,338 (reported on 12.2% of returns)
Here:
$2,338
State:
$6,959
(% of AGI for various income ranges: 1.1% for AGIs below $25k, 0.6% for AGIs $25k-50k, 1.0% for AGIs $50k-75k, 0.3% for AGIs $75k-100k, 0.8% for AGIs $100k-200k)
Net capital gain/loss in AGI: +$4,123 (reported on 6.6% of returns)
Here:
+$4,123
State:
+$16,672
(% of AGI for various income ranges: 0.9% for AGIs $50k-75k, 2.7% for AGIs $100k-200k)
Profit/loss from business: +$7,096 (reported on 12.7% of returns)
Here:
+$7,096
State:
+$14,116
(% of AGI for various income ranges: 4.7% for AGIs below $25k, 2.4% for AGIs $25k-50k, 1.9% for AGIs $50k-75k, 3.7% for AGIs $75k-100k)
Taxable individual retirement arrangement distribution: $9,533 (reported on 7.6% of returns)
23040:
$9,533
Virginia:
$16,667
(% of AGI for various income ranges: 2.2% for AGIs below $25k, 1.2% for AGIs $25k-50k, 1.6% for AGIs $50k-75k, 5.9% for AGIs $75k-100k)
Total itemized deductions: $17,778 (26% of AGI, reported on 25.4% of returns)
Here:
$17,778
State:
$26,596
Here:
26.3% of AGI
State:
20.1% of AGI
(% of AGI for various income ranges: 8.8% for AGIs below $25k, 10.1% for AGIs $25k-50k, 12.8% for AGIs $50k-75k, 14.5% for AGIs $75k-100k, 13.6% for AGIs $100k-200k)
Charity contributions: $3,289 (reported on 19.3% of returns)
Here:
$3,289
State:
$4,443
(% of AGI for various income ranges: 0.7% for AGIs below $25k, 1.2% for AGIs $25k-50k, 1.9% for AGIs $50k-75k, 2.2% for AGIs $75k-100k, 2.3% for AGIs $100k-200k)
Taxes paid: $4,876 (reported on 25.4% of returns)
23040:
$4,876
State:
$9,951
(% of AGI for various income ranges: 1.2% for AGIs below $25k, 2.1% for AGIs $25k-50k, 3.2% for AGIs $50k-75k, 4.5% for AGIs $75k-100k, 5.5% for AGIs $100k-200k)
Earned income credit: $2,291 (reported on 28.9% of returns)
Here:
$2,291
State:
$2,211
(% of AGI for various income ranges: 8.5% for AGIs below $25k, 1.7% for AGIs $25k-50k)
Percentage of individuals using paid preparers for their 2012 taxes: 45.7%
Here:
46%
State:
46%
(% for various income ranges: 43.7% for AGIs below $25k, 41.7% for AGIs $25k-50k, 51.9% for AGIs $50k-75k, 53.8% for AGIs $75k-100k, 60.0% for AGIs $100k-200k)
Averages for the 2004 tax year for zip code 23040, filed in 2005:
Average Adjusted Gross Income (AGI) in 2004: $32,160 (Individual Income Tax Returns)
Here:
$32,160
State:
$56,704
Salary/wage: $29,338 (reported on 87.3% of returns)
Here:
$29,338
State:
$48,441
(% of AGI for various income ranges: 107.2% for AGIs below $10k, 85.2% for AGIs $10k-25k, 83.2% for AGIs $25k-50k, 83.9% for AGIs $50k-75k, 79.3% for AGIs $75k-100k, 49.8% for AGIs over 100k)
Taxable interest for individuals: $913 (reported on 33.3% of returns)
This zip code:
$913
Virginia:
$1,688
(% of AGI for various income ranges: 4.7% for AGIs below $10k, 1.3% for AGIs $10k-25k, 0.8% for AGIs $25k-50k, 0.7% for AGIs $50k-75k, 0.6% for AGIs $75k-100k, 0.9% for AGIs over 100k)
Taxable dividends: $1,816 (reported on 13.7% of returns)
Here:
$1,816
State:
$4,028
(% of AGI for various income ranges: 1.3% for AGIs below $10k, 0.7% for AGIs $10k-25k, 0.7% for AGIs $25k-50k, 0.4% for AGIs $50k-75k, 0.6% for AGIs $75k-100k, 1.9% for AGIs over 100k)
Net capital gain/loss: +$4,990 (reported on 10.5% of returns)
Here:
+$4,990
State:
+$14,375
(% of AGI for various income ranges: -0.4% for AGIs below $10k, 0.4% for AGIs $10k-25k, 1.1% for AGIs $25k-50k, 0.5% for AGIs $50k-75k, 2.4% for AGIs $75k-100k, 6.3% for AGIs over 100k)
Profit/loss from business: +$5,476 (reported on 13.6% of returns)
Here:
+$5,476
State:
+$13,342
(% of AGI for various income ranges: -10.8% for AGIs below $10k, 3.7% for AGIs $10k-25k, 4.1% for AGIs $25k-50k, 1.3% for AGIs $50k-75k, 2.0% for AGIs $75k-100k, 0.4% for AGIs over 100k)
IRA payment deduction: $2,000 (reported on 1.5% of returns)
23040:
$2,000
Virginia:
$2,943
Total itemized deductions: $14,881 (26% of AGI, reported on 25.7% of returns)
Here:
$14,881
State:
$21,492
Here:
26.2% of AGI
State:
21.0% of AGI
(% of AGI for various income ranges: 11.1% for AGIs below $10k, 7.9% for AGIs $10k-25k, 12.5% for AGIs $25k-50k, 13.1% for AGIs $50k-75k, 14.9% for AGIs $75k-100k, 10.2% for AGIs over 100k)
Charity contributions deductions: $2,814 (5% of AGI, reported on 19.8% of returns)
Here:
$2,814
State:
$3,794
Here:
4.8% of AGI
State:
3.5% of AGI
(% of AGI for various income ranges: 0.9% for AGIs $10k-25k, 2.0% for AGIs $25k-50k, 2.0% for AGIs $50k-75k, 2.2% for AGIs $75k-100k, 1.5% for AGIs over 100k)
Total tax: $3,788 (reported on 68.0% of returns)
23040:
$3,788
State:
$9,537
(% of AGI for various income ranges: 2.5% for AGIs below $10k, 3.6% for AGIs $10k-25k, 5.9% for AGIs $25k-50k, 7.9% for AGIs $50k-75k, 10.4% for AGIs $75k-100k, 18.1% for AGIs over 100k)
Earned income credit: $1,947 (reported on 25.2% of returns)
Here:
$1,947
State:
$1,734
Percentage of individuals using paid preparers for their 2004 taxes: 55.3%
Here:
55%
State:
52%
(% for various income ranges: 46.6% for AGIs below $10k, 59.4% for AGIs $10k-25k, 54.6% for AGIs $25k-50k, 57.4% for AGIs $50k-75k, 59.4% for AGIs $75k-100k, 61.4% for AGIs over 100k)
Likely homosexual households (counted as self-reported same-sex unmarried-partner households)
Lesbian couples: 0.1% of all households
Gay men: 0.0% of all households
Household received Food Stamps/SNAP in the past 12 months: 623 Household did not receive Food Stamps/SNAP in the past 12 months: 1,312
Women who had a birth in the past 12 months: 40 (25 now married, 14 unmarried) Women who did not have a birth in the past 12 months: 1,005 (250 now married, 762 unmarried)
Housing units in zip code 23040 with a mortgage: 621 (22 second mortgage, 21 home equity loan, 5 both second mortgage and home equity loan) Houses without a mortgage: 10
Median monthly owner costs for units with a mortgage: $1,096 Median monthly owner costs for units without a mortgage: $473
Residents with income below the poverty level in 2022:
This zip code:
10.5%
Whole state:
10.6%
Residents with income below 50% of the poverty level in 2022:
This zip code:
8.1%
Whole state:
5.2%
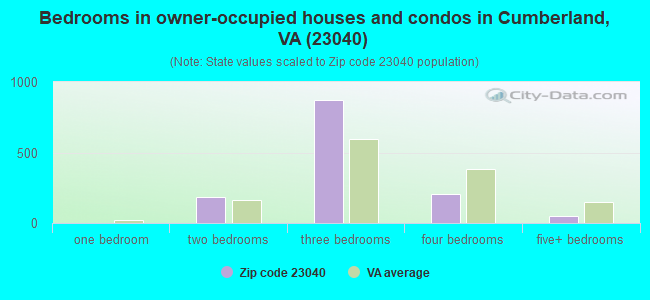
Median number of rooms in houses and condos:
Here:
6.0
State:
7.0
Median number of rooms in apartments:
Here:
5.1
State:
4.3
Notable locations in this zip code not listed on our city pages
Notable locations in zip code 23040: Stony Point Mills (A), Grays Siding (B), Ca Ira (C), Browns Store (D), Cumberland Volunteer Rescue Squad (E), Kenbridge Fire Rescue Squad (F), Cumberland County Courthouse (G), Cumberland Rescue Squad (H), Cumberland Fire Department (I), Cumberland County Sheriff's Office (J). Display/hide their locations on the map
Churches in zip code 23040 include: Rising Zion Church (A), Bethlehem Baptist Church (B), Rocky Mount Church (C), Salem Church (D), Center Church (E), Center Union Church (F), Tear Wallet Church (G), Fitzgerald Church (H), Grace Church (I). Display/hide their locations on the map
Cemeteries: Oak Grove Cemetery (1), Meador Cemetery (2), Jenkins Cemetery (3), Hill Cemetery (4), Hendricks Cemetery (5), Grove Cemetery (6), Bethlehem Cemetery (7). Display/hide their locations on the map
Reservoirs and swamps: Tom Rogers Farm Pond (A), Swans Lake (B), Ca Ira Lake (C), Flippen Lake (D), Garrett Lake (E), Clements Lake (F), Fleming Lake (G), Collins Lake (H). Display/hide their locations on the map
Streams, rivers, and creeks: Whispering Creek (A), Tear Wallet Creek (B), Rock Point Creek (C), Rock Creek (D), Reynolds Creek (E), Payne Creek (F), Little Willis River (G), Little Guinea Creek (H), Ivy Branch (I). Display/hide their locations on the map
Size of family households: 862 2-persons, 239 3-persons, 167 4-persons, 28 5-persons, 35 6-persons, 15 7-or-more-persons
Size of nonfamily households: 432 1-person, 89 2-persons
450 married couples with children.
143 single-parent households (143 women).
98.1% of residents of 23040 zip code speak English at home.
0.5% of residents speak Spanish at home (100% very well).
0.8% of residents speak other Indo-European language at home (100% very well).
0.2% of residents speak Asian or Pacific Island language at home (100% not well).
0.2% of residents speak other language at home (100% very well).
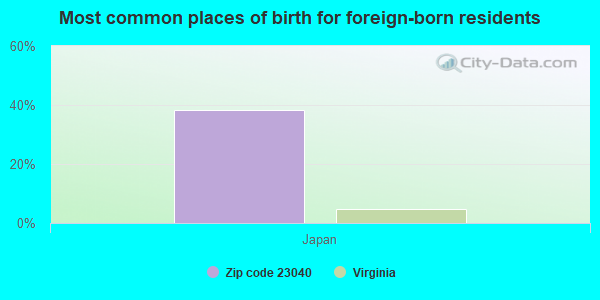
Foreign born population: 13 (0.3%) (100.0% of them are naturalized citizens)
This zip code:
0.3%
Whole state:
12.7%
38%Japan
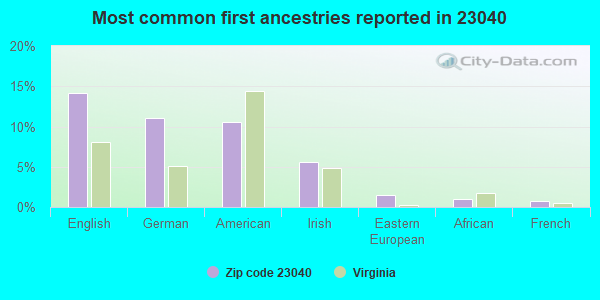
14%English
11%German
11%American
6%Irish
1%Eastern European
1%African
1%French
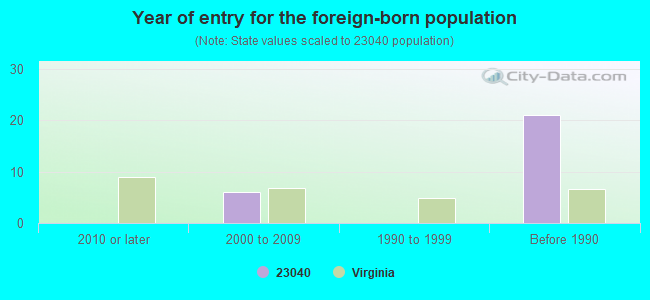
Year of entry for the foreign-born population
02010 or later
62000 to 2009
01990 to 1999
21Before 1990
Facilities with environmental interests located in this zip code:
CHESAPEAKE & POTOMAC TELEPHONE CO (STATE HIGHWAY 60 in CUMBERLAND, VA)
(Resource Conservation and Recovery Act (tracking hazardous waste)) Organizations: OPERNAME (CONTACT/OPERATOR)
, CHESAPEAKE & POTOMAC TELEPHONE COMPANY (CONTACT/OWNER)
Housing units lacking complete kitchen facilities: 2.4%
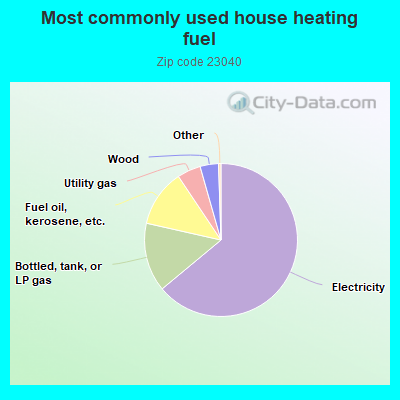
64.1%Electricity
14.6%Bottled, tank, or LP gas
12.1%Fuel oil, kerosene, etc.
5.0%Utility gas
3.9%Wood
Population in 1990: 3,429. Population change in the 1990s: +372 (+10.8%).
Place of birth for U.S.-born residents:
This state: 3,414
Northeast: 351
Midwest: 108
South: 272
West: 38
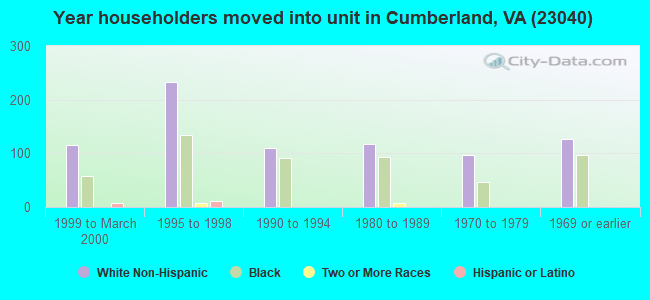
65% of the 23040 zip code residents lived in the same house 5 years ago. Out of people who lived in different houses, 41% lived in this county. Out of people who lived in different counties, 50% lived in Virginia.
96% of the 23040 zip code residents lived in the same house 1 year ago. Out of people who lived in different houses, 39% moved from this county. Out of people who lived in different houses, 38% moved from different county within same state. Out of people who lived in different houses, 33% moved from different state.
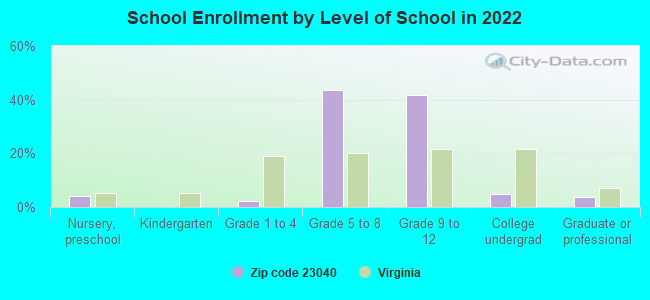
Private vs. public school enrollment:
Students in private schools in grades 1 to 8 (elementary and middle school):
Here:
0.0%
Virginia:
13.2%
Students in private schools in grades 9 to 12 (high school): 15
Here:
5.5%
Virginia:
10.2%
Students in private undergraduate colleges:
Here:
0.0%
Virginia:
18.7%
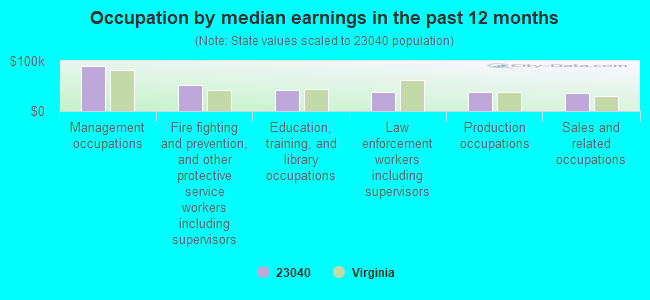
Occupation by median earnings in the past 12 months ($)
89,017Management occupations
51,288Fire fighting and prevention, and other protective service workers including supervisors
42,697Education, training, and library occupations
38,038Law enforcement workers including supervisors
37,864Production occupations
35,924Sales and related occupations
Top industries in this zip code by the number of employees in 2005:
Educational Services: Elementary and Secondary Schools (50-99 employees: 1 establishment)
Health Care and Social Assistance: Services for the Elderly and Persons with Disabilities (20-49: 1, 5-9: 1)
Health Care and Social Assistance: Other Individual and Family Services (20-49: 1, 1-4: 1)
Health Care and Social Assistance: Other Residential Care Facilities (20-49: 1)
People in group quarters in 2010:
18 people in group homes intended for adults
People in group quarters in 2000:
18 people in other noninstitutional group quarters
4 people in agriculture workers' dormitories on farms
Fatal accident statistics in 2014:
Fatal accident count: 3
Vehicles involved in fatal accidents: 6
Fatal accidents caused by drunken drivers: 0
Fatalities: 3
Persons involved in fatal accidents: 6
Pedestrians involved in fatal accidents: 0
Fatal accident statistics in 2013:
Fatal accident count: 4
Vehicles involved in fatal accidents: 5
Fatal accidents caused by drunken drivers: 1
Fatalities: 5
Persons involved in fatal accidents: 8
Pedestrians involved in fatal accidents: 0
2002 - 2018 National Fire Incident Reporting System (NFIRS) incidents
According to the data from the years 2002 - 2018 the average number of fires per year is 19. The highest number of fires - 50 took place in 2017, and the least - 0 in 2012. The data has an increasing trend.
When looking into fire subcategories, the most reports belonged to: Structure Fires (43.7%), and Outside Fires (38.7%).
Fire incident types reported to NFIRS in Zip Code 23040


 Nearest zip codes: 23123, 23027, 23966, 23022, 23083, 23936.


 According to the data from the years 2002 - 2018 the average number of fires per year is 19. The highest number of fires - 50 took place in 2017, and the least - 0 in 2012. The data has an increasing trend.
 When looking into fire subcategories, the most reports belonged to: Structure Fires (43.7%), and Outside Fires (38.7%).