Estimated zip code population in 2022: 2,466 Zip code population in 2010: 1,732 Zip code population in 2000: 1,802
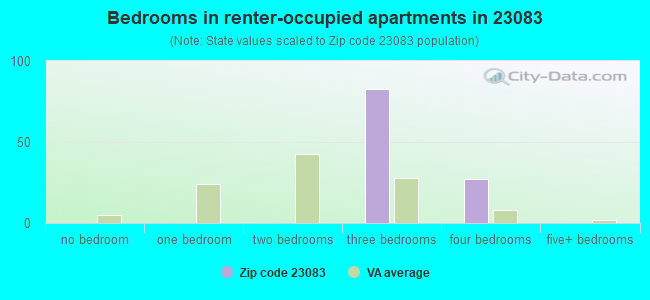
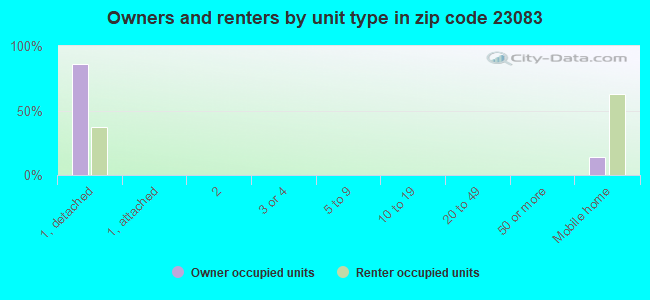
Houses and condos: 991 Renter-occupied apartments: 111
% of renters here:
12%
State:
33%
March 2022 cost of living index in zip code 23083: 84.2 (less than average, U.S. average is 100)
Land area: 56.8 sq. mi. Water area: 0.1 sq. mi.
Population density: 43 people per square mile
(very low).
OSM Map
General Map
Google Map
MSN Map
OSM Map
General Map
Google Map
MSN Map
OSM Map
General Map
Google Map
MSN Map
OSM Map
General Map
Google Map
MSN Map
Please wait while loading the map...
Real estate property taxes paid for housing units in 2022:
This zip code:
0.4% ($1,090)
Virginia:
0.7% ($2,617)
Median real estate property taxes paid for housing units with mortgages in 2022: $1,369 (0.5%) Median real estate property taxes paid for housing units with no mortgage in 2022: $806 (0.2%)
Business Search- 14 Million verified businesses
Males: 1,211
(49.1%)
Females: 1,255
(50.9%)
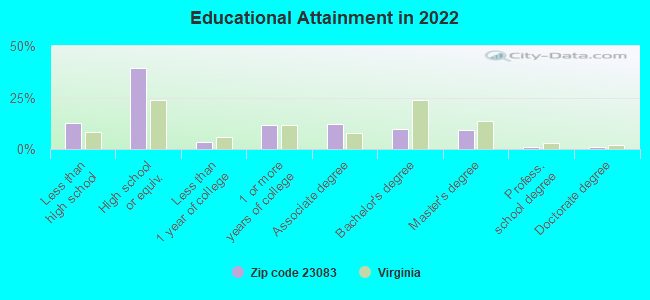
For population 25 years and over in 23083:
High school or higher: 86.6%
Bachelor's degree or higher: 20.8%
Graduate or professional degree: 11.1%
Unemployed: 0.9%
Mean travel time to work (commute): 37.3 minutes
For population 15 years and over in 23083:
Never married: 28.6%
Now married: 61.1%
Separated: 0.5%
Widowed: 1.2%
Divorced: 8.5%
Zip code 23083 compared to state average:
Unemployed percentage significantly below state average.
Median age above state average.
Foreign-born population percentage significantly below state average.
Renting percentage significantly below state average.
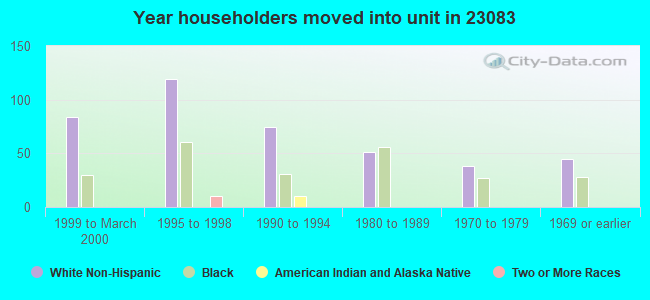
Length of stay since moving in significantly above state average.
Percentage of population with a bachelor's degree or higher below state average.
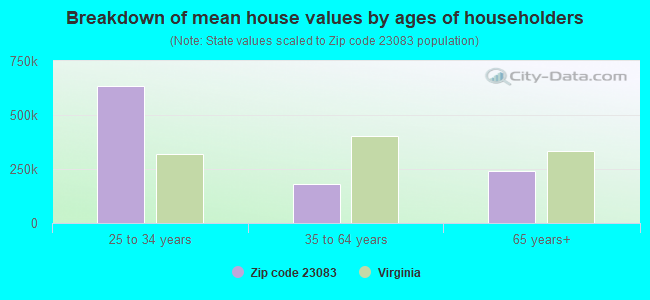
Estimated median house/condo value in 2022: $300,804
23083:
$300,804
Virginia:
$365,700
According to our research of Virginia and other state lists, there were 7 registered sex offenders living in 23083 zip code as of April 27, 2024. The ratio of all residents to sex offenders in zip code 23083 is 321 to 1. The ratio of registered sex offenders to all residents in this zip code is near the state average.
Median resident age:
This zip code:
46.9 years
Virginia median age:
39.0 years
Average household size:
This zip code:
2.7 people
Virginia:
2.5 people
Averages for the 2020 tax year for zip code 23083, filed in 2021:
Average Adjusted Gross Income (AGI) in 2020: $56,955 (Individual Income Tax Returns)
Here:
$56,955
State:
$86,446
Salary/wage: $50,020 (reported on 84.2% of returns)
Here:
$50,020
State:
$71,185
(% of AGI for various income ranges: 1186.7% for AGIs below $25k, 3508.3% for AGIs $25k-50k, 6625.5% for AGIs $50k-75k, 9362.9% for AGIs $75k-100k, 21802.9% for AGIs $100k-200k)
Taxable interest for individuals: $586 (reported on 23.2% of returns)
This zip code:
$586
Virginia:
$1,805
(% of AGI for various income ranges: 11.9% for AGIs below $25k, 6.7% for AGIs $25k-50k, 13.6% for AGIs $50k-75k, 8.6% for AGIs $75k-100k, 95.7% for AGIs $100k-200k)
Ordinary dividends: $2,520 (reported on 10.5% of returns)
Here:
$2,520
State:
$8,327
(% of AGI for various income ranges: 20.0% for AGIs below $25k, 31.8% for AGIs $50k-75k, 250.0% for AGIs $100k-200k)
Net capital gain/loss in AGI: +$13,410 (reported on 10.5% of returns)
Here:
+$13,410
State:
+$24,644
(% of AGI for various income ranges: 2.9% for AGIs below $25k, 109.1% for AGIs $50k-75k, 1735.7% for AGIs $100k-200k)
Profit/loss from business: +$4,500 (reported on 15.8% of returns)
Here:
+$4,500
State:
+$12,836
(% of AGI for various income ranges: 75.2% for AGIs below $25k, 62.9% for AGIs $25k-50k, 203.6% for AGIs $50k-75k, 202.9% for AGIs $75k-100k)
Taxable individual retirement arrangement distribution: $16,633 (reported on 6.3% of returns)
23083:
$16,633
Virginia:
$21,535
(% of AGI for various income ranges: 170.4% for AGIs $25k-50k, 841.4% for AGIs $75k-100k)
Total itemized deductions: $23,880 (reported on 5.3% of returns)
Here:
$23,880
State:
$33,287
(% of AGI for various income ranges: 538.2% for AGIs $50k-75k, 860.0% for AGIs $100k-200k)
Charity contributions: $7,467 (reported on 3.2% of returns)
Here:
$7,467
State:
$10,381
(% of AGI for various income ranges: 320.0% for AGIs $75k-100k)
Taxes paid: $6,560 (reported on 5.3% of returns)
23083:
$6,560
State:
$8,284
(% of AGI for various income ranges: 126.4% for AGIs $50k-75k, 270.0% for AGIs $100k-200k)
Earned income credit: $2,394 (reported on 16.8% of returns)
Here:
$2,394
State:
$2,214
(% of AGI for various income ranges: 101.9% for AGIs below $25k, 70.4% for AGIs $25k-50k)
Percentage of individuals using paid preparers for their 2020 taxes: 90.5%
Here:
91%
State:
92%
(% for various income ranges: 89.3% for AGIs below $25k, 89.3% for AGIs $25k-50k, 93.8% for AGIs $50k-75k, 100.0% for AGIs $75k-100k, 100.0% for AGIs $100k-200k, 0.0% for AGIs over 200k)
Averages for the 2012 tax year for zip code 23083, filed in 2013:
Average Adjusted Gross Income (AGI) in 2012: $42,761 (Individual Income Tax Returns)
Here:
$42,761
State:
$71,192
Salary/wage: $39,258 (reported on 83.9% of returns)
Here:
$39,258
State:
$59,229
(% of AGI for various income ranges: 76.0% for AGIs below $25k, 80.1% for AGIs $25k-50k, 78.5% for AGIs $50k-75k, 77.9% for AGIs $75k-100k, 73.1% for AGIs $100k-200k)
Taxable interest for individuals: $614 (reported on 25.3% of returns)
This zip code:
$614
Virginia:
$1,600
(% of AGI for various income ranges: 0.8% for AGIs below $25k, 0.4% for AGIs $25k-50k, 0.3% for AGIs $50k-75k, 0.4% for AGIs $75k-100k, 0.2% for AGIs $100k-200k)
Ordinary dividends: $1,125 (reported on 9.2% of returns)
Here:
$1,125
State:
$6,959
(% of AGI for various income ranges: 0.5% for AGIs below $25k, 0.4% for AGIs $25k-50k, 0.4% for AGIs $75k-100k)
Net capital gain/loss in AGI: +$4,314 (reported on 8.0% of returns)
Here:
+$4,314
State:
+$16,672
Profit/loss from business: +$5,233 (reported on 13.8% of returns)
Here:
+$5,233
State:
+$14,116
(% of AGI for various income ranges: 6.7% for AGIs below $25k, 1.0% for AGIs $25k-50k, 2.5% for AGIs $50k-75k, 0.4% for AGIs $75k-100k)
Taxable individual retirement arrangement distribution: $12,133 (reported on 6.9% of returns)
23083:
$12,133
Virginia:
$16,667
Total itemized deductions: $17,708 (24% of AGI, reported on 29.9% of returns)
Here:
$17,708
State:
$26,596
Here:
24.0% of AGI
State:
20.1% of AGI
(% of AGI for various income ranges: 6.6% for AGIs below $25k, 9.4% for AGIs $25k-50k, 13.9% for AGIs $50k-75k, 15.2% for AGIs $75k-100k, 14.7% for AGIs $100k-200k)
Charity contributions: $2,810 (reported on 23.0% of returns)
Here:
$2,810
State:
$4,443
(% of AGI for various income ranges: 1.2% for AGIs $25k-50k, 1.8% for AGIs $50k-75k, 1.7% for AGIs $75k-100k, 2.2% for AGIs $100k-200k)
Taxes paid: $4,769 (reported on 29.9% of returns)
23083:
$4,769
State:
$9,951
(% of AGI for various income ranges: 0.8% for AGIs below $25k, 1.9% for AGIs $25k-50k, 3.0% for AGIs $50k-75k, 4.5% for AGIs $75k-100k, 5.3% for AGIs $100k-200k)
Earned income credit: $2,200 (reported on 21.8% of returns)
Here:
$2,200
State:
$2,211
(% of AGI for various income ranges: 6.7% for AGIs below $25k, 1.2% for AGIs $25k-50k)
Percentage of individuals using paid preparers for their 2012 taxes: 51.7%
Here:
52%
State:
46%
(% for various income ranges: 51.4% for AGIs below $25k, 43.5% for AGIs $25k-50k, 53.8% for AGIs $50k-75k, 71.4% for AGIs $75k-100k, 57.1% for AGIs $100k-200k)
Averages for the 2004 tax year for zip code 23083, filed in 2005:
Average Adjusted Gross Income (AGI) in 2004: $35,076 (Individual Income Tax Returns)
Here:
$35,076
State:
$56,704
Salary/wage: $33,250 (reported on 88.4% of returns)
Here:
$33,250
State:
$48,441
(% of AGI for various income ranges: 109.7% for AGIs below $10k, 79.7% for AGIs $10k-25k, 81.3% for AGIs $25k-50k, 86.1% for AGIs $50k-75k, 84.8% for AGIs $75k-100k, 83.6% for AGIs over 100k)
Taxable interest for individuals: $790 (reported on 31.9% of returns)
This zip code:
$790
Virginia:
$1,688
(% of AGI for various income ranges: 4.6% for AGIs below $10k, 1.7% for AGIs $10k-25k, 0.6% for AGIs $25k-50k, 0.6% for AGIs $50k-75k, 0.2% for AGIs $75k-100k, 0.3% for AGIs over 100k)
Taxable dividends: $1,327 (reported on 12.4% of returns)
Here:
$1,327
State:
$4,028
(% of AGI for various income ranges: 1.3% for AGIs below $10k, 0.4% for AGIs $10k-25k, 0.6% for AGIs $25k-50k, 0.5% for AGIs $50k-75k, 0.2% for AGIs $75k-100k, 0.3% for AGIs over 100k)
Net capital gain/loss: +$5,978 (reported on 11.5% of returns)
Here:
+$5,978
State:
+$14,375
(% of AGI for various income ranges: -2.9% for AGIs below $10k, 1.2% for AGIs $25k-50k, 2.3% for AGIs $50k-75k, 3.3% for AGIs $75k-100k, 3.9% for AGIs over 100k)
Profit/loss from business: +$3,441 (reported on 14.0% of returns)
Here:
+$3,441
State:
+$13,342
(% of AGI for various income ranges: 14.0% for AGIs below $10k, 3.5% for AGIs $10k-25k, 1.7% for AGIs $25k-50k, -1.2% for AGIs $50k-75k, 2.6% for AGIs $75k-100k)
Total itemized deductions: $15,153 (25% of AGI, reported on 28.1% of returns)
Here:
$15,153
State:
$21,492
Here:
24.6% of AGI
State:
21.0% of AGI
(% of AGI for various income ranges: 9.1% for AGIs $10k-25k, 11.7% for AGIs $25k-50k, 14.0% for AGIs $50k-75k, 14.4% for AGIs $75k-100k, 11.4% for AGIs over 100k)
Charity contributions deductions: $2,544 (4% of AGI, reported on 24.7% of returns)
Here:
$2,544
State:
$3,794
Here:
4.1% of AGI
State:
3.5% of AGI
(% of AGI for various income ranges: 1.4% for AGIs $10k-25k, 2.0% for AGIs $25k-50k, 2.1% for AGIs $50k-75k, 2.1% for AGIs $75k-100k, 1.1% for AGIs over 100k)
Total tax: $4,169 (reported on 69.7% of returns)
23083:
$4,169
State:
$9,537
(% of AGI for various income ranges: 3.1% for AGIs below $10k, 3.6% for AGIs $10k-25k, 6.3% for AGIs $25k-50k, 7.6% for AGIs $50k-75k, 10.2% for AGIs $75k-100k, 16.3% for AGIs over 100k)
Earned income credit: $1,673 (reported on 20.5% of returns)
Here:
$1,673
State:
$1,734
Percentage of individuals using paid preparers for their 2004 taxes: 56.3%
Here:
56%
State:
52%
(% for various income ranges: 49.0% for AGIs below $10k, 53.9% for AGIs $10k-25k, 57.1% for AGIs $25k-50k, 64.3% for AGIs $50k-75k, 60.0% for AGIs $75k-100k, 65.5% for AGIs over 100k)
Household received Food Stamps/SNAP in the past 12 months: 79 Household did not receive Food Stamps/SNAP in the past 12 months: 832
Women who did not have a birth in the past 12 months: 621 (222 now married, 400 unmarried)
Housing units in zip code 23083 with a mortgage: 310 (28 second mortgage, 23 home equity loan) Median monthly owner costs for units with a mortgage: $1,637 Median monthly owner costs for units without a mortgage: $408
Residents with income below the poverty level in 2022:
This zip code:
5.8%
Whole state:
10.6%
Residents with income below 50% of the poverty level in 2022:
This zip code:
2.4%
Whole state:
5.2%
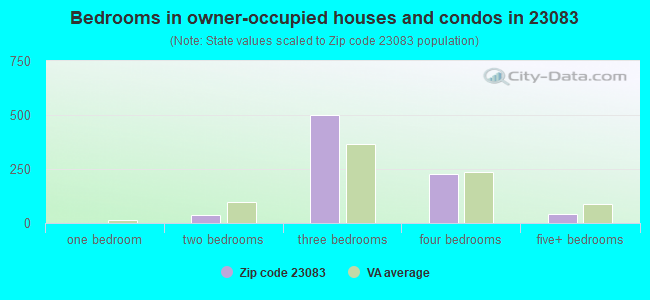
Median number of rooms in houses and condos:
Here:
6.6
State:
7.0
Median number of rooms in apartments:
Here:
5.0
State:
4.3
Notable locations in this zip code not listed on our city pages
Notable locations in zip code 23083: Amelia County Volunteer Fire Department Company 3 Jetersville (A), Hillsman House (B), Jetersville Company 3 (C). Display/hide their locations on the map
Churches in zip code 23083 include: Bethel Church (A), Saint James Church (B), Sandy Creek Church (C), Zion Hill Church (D), Ebenezer Church (E), Gravel Hill Church (F), Ebenezer Church (G), Pilgrim Church (H). Display/hide their locations on the map
Cemeteries: Sandy Creek Cemetery (1), Pilgrim Cemetery (2), Good Hope Cemetery (3), Bethel Cemetery (4), Southall Cemetery (5). Display/hide their locations on the map
Streams, rivers, and creeks: Walnut Branch (A), Vaughns Creek (B), South Buckskin Creek (C), North Buckskin Creek (D), Neals Creek (E), Maplewood Branch (F), Websters Creek (G). Display/hide their locations on the map
In group quarters: 18 (-1 institutionalized population)
Size of family households: 329 2-persons, 223 3-persons, 109 4-persons, 62 5-persons, 9 6-persons
Size of nonfamily households: 134 1-person, 19 2-persons, 18 3-persons
260 married couples with children.
77 single-parent households (77 men).
91.8% of residents of 23083 zip code speak English at home.
7.6% of residents speak Spanish at home (58% very well, 23% well, 19% not well).
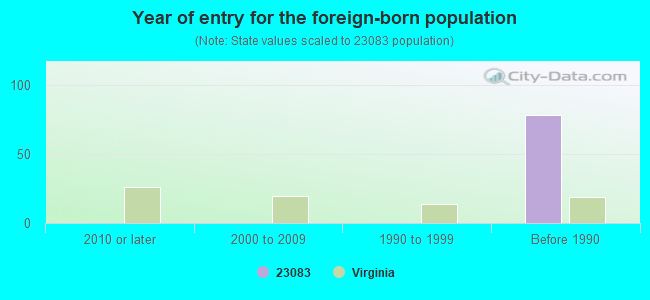
Foreign born population: 0 (0.0%)
:
0.0%
Whole state:
12.7%
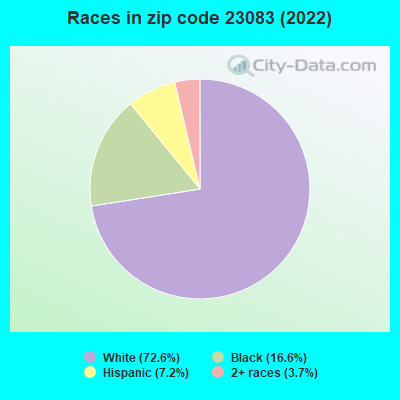
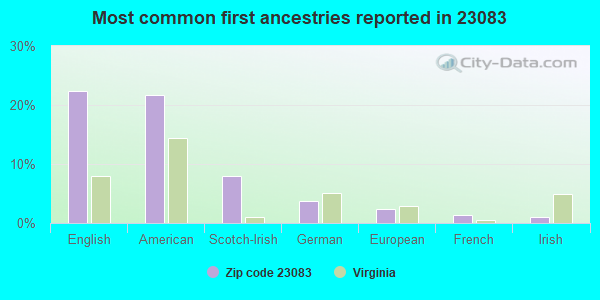
22%English
22%American
8%Scotch-Irish
4%German
2%European
1%French
1%Irish
Year of entry for the foreign-born population
02010 or later
02000 to 2009
01990 to 1999
78Before 1990
Facilities with environmental interests located in this zip code:
AMELIA-NOTTOWAY VOC CTR (HWY. 360 WEST in JETERSVILLE, VA)
(National Center for Education Statistics) - STATE ID-3110380 Organizations: AMELIA-NOTTOWAY VOCATIONAL-TECHNICAL CENTER (SCHOOL DISTRICT)
Housing units lacking complete plumbing facilities: 3.4% Housing units lacking complete kitchen facilities: 6.2%
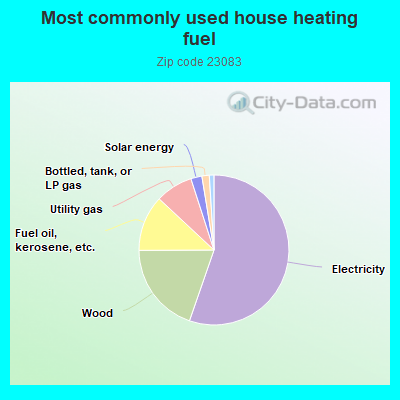
55.6%Electricity
19.7%Wood
12.1%Fuel oil, kerosene, etc.
8.1%Utility gas
2.4%Solar energy
1.6%Bottled, tank, or LP gas
1.0%No fuel used
Population in 1990: 1,396. Population change in the 1990s: +406 (+29.1%).
Place of birth for U.S.-born residents:
This state: 1,647
Northeast: 246
Midwest: 90
South: 295
West: 94
50% of the 23083 zip code residents lived in the same house 5 years ago. Out of people who lived in different houses, 49% lived in this county. Out of people who lived in different counties, 50% lived in Virginia.
97% of the 23083 zip code residents lived in the same house 1 year ago. Out of people who lived in different houses, 121% moved from different county within same state.
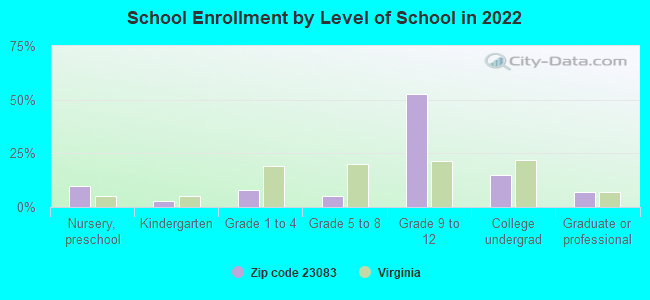
Private vs. public school enrollment:
Students in private schools in grades 1 to 8 (elementary and middle school): 59
Here:
77.9%
Virginia:
13.2%
Students in private schools in grades 9 to 12 (high school):
Here:
0.0%
Virginia:
10.2%
Students in private undergraduate colleges:
Here:
0.0%
Virginia:
18.7%
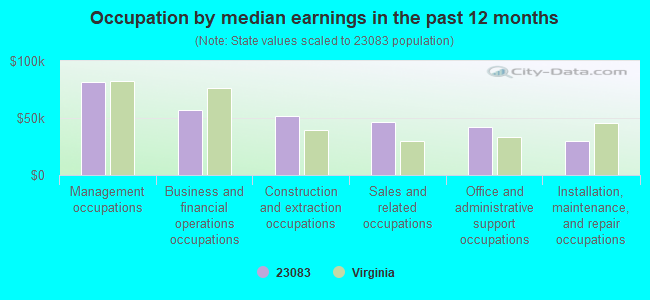
Occupation by median earnings in the past 12 months ($)
81,161Management occupations
56,919Business and financial operations occupations
51,972Construction and extraction occupations
46,377Sales and related occupations
41,826Office and administrative support occupations
29,614Installation, maintenance, and repair occupations
Top industries in this zip code by the number of employees in 2005:
Administrative and Support and Waste Management and Remediation Services: Solid Waste Landfill (20-49: 1)
Health Care and Social Assistance: Home Health Care Services (10-19: 1, 1-4: 1)
Other Services (except Public Administration): General Automotive Repair (10-19: 1, 1-4: 1)
Health Care and Social Assistance: Residential Mental Retardation Facilities (10-19: 1)
Other Services (except Public Administration): Religious Organizations (5-9: 1, 1-4: 2)
Construction: Commercial and Institutional Building Construction (5-9: 1)
Construction: Power and Communication Line and Related Structures Construction (5-9: 1)
People in group quarters in 2010:
9 people in group homes intended for adults
Fatal accident statistics in 2012:
Fatal accident count: 2
Vehicles involved in fatal accidents: 3
Fatal accidents caused by drunken drivers: 1
Fatalities: 2
Persons involved in fatal accidents: 3
Pedestrians involved in fatal accidents: 0
Fatal accident statistics in 2010:
Fatal accident count: 1
Vehicles involved in fatal accidents: 1
Fatal accidents caused by drunken drivers: 1
Fatalities: 1
Persons involved in fatal accidents: 1
Pedestrians involved in fatal accidents: 0
2005 - 2018 National Fire Incident Reporting System (NFIRS) incidents
Based on the data from the years 2005 - 2018 the average number of fire incidents per year is 10. The highest number of fires - 25 took place in 2010, and the least - 1 in 2006. The data has an increasing trend.
When looking into fire subcategories, the most reports belonged to: Outside Fires (45.2%), and Structure Fires (33.3%).
Fire incident types reported to NFIRS in Zip Code 23083

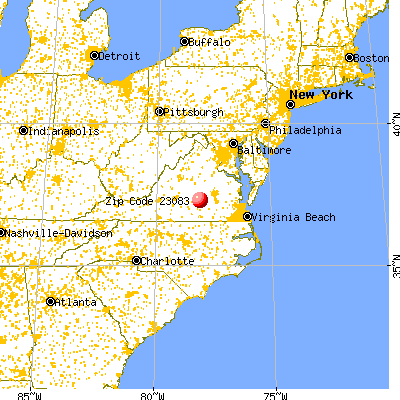


 Nearest zip codes: 23930, 23966, 23922, 23002, 23040, 23942.
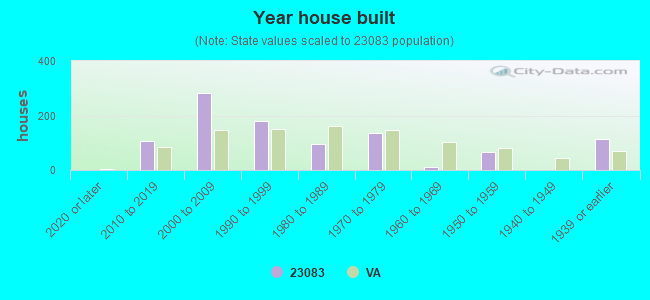


 Based on the data from the years 2005 - 2018 the average number of fire incidents per year is 10. The highest number of fires - 25 took place in 2010, and the least - 1 in 2006. The data has an increasing trend.
 When looking into fire subcategories, the most reports belonged to: Outside Fires (45.2%), and Structure Fires (33.3%).