Estimated zip code population in 2022: 1,459 Zip code population in 2010: 1,683 Zip code population in 2000: 2,019
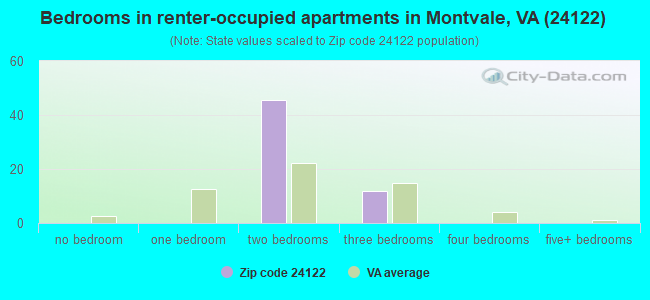
Houses and condos: 677 Renter-occupied apartments: 58
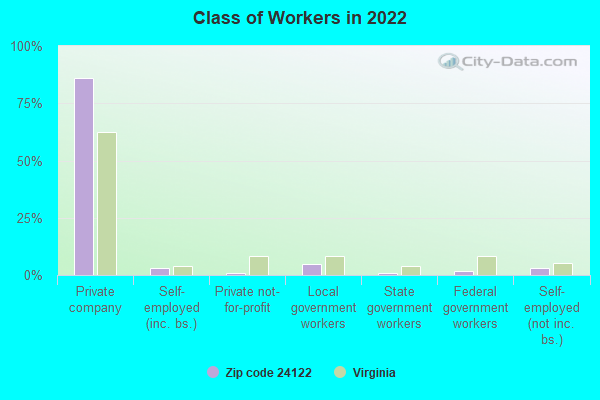
% of renters here:
9%
State:
33%
March 2022 cost of living index in zip code 24122: 82.3 (low, U.S. average is 100)
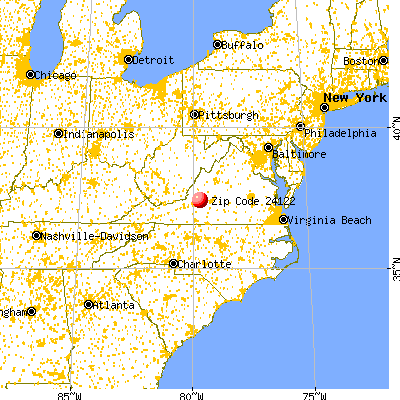
Land area: 28.7 sq. mi. Water area: 0.0 sq. mi.
Population density: 51 people per square mile
(very low).
OSM Map
General Map
Google Map
MSN Map
OSM Map
General Map
Google Map
MSN Map
OSM Map
General Map
Google Map
MSN Map
OSM Map
General Map
Google Map
MSN Map
Please wait while loading the map...
Real estate property taxes paid for housing units in 2022:
This zip code:
0.5% ($768)
Virginia:
0.7% ($2,617)
Median real estate property taxes paid for housing units with mortgages in 2022: $710 (0.5%) Median real estate property taxes paid for housing units with no mortgage in 2022: $902 (0.5%)
Business Search- 14 Million verified businesses
Males: 723
(49.5%)
Females: 736
(50.5%)
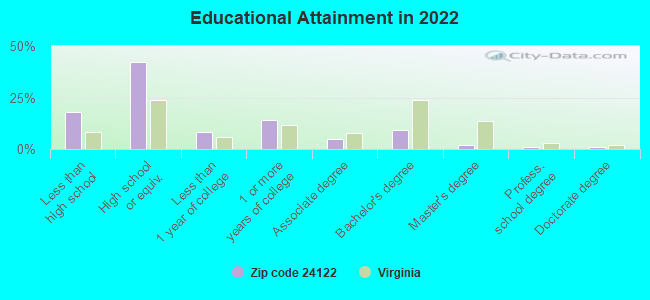
For population 25 years and over in 24122:
High school or higher: 79.7%
Bachelor's degree or higher: 12.4%
Graduate or professional degree: 3.3%
Unemployed: 6.2%
Mean travel time to work (commute): 27.1 minutes
For population 15 years and over in 24122:
Never married: 27.1%
Now married: 54.0%
Separated: 0.1%
Widowed: 7.9%
Divorced: 10.9%
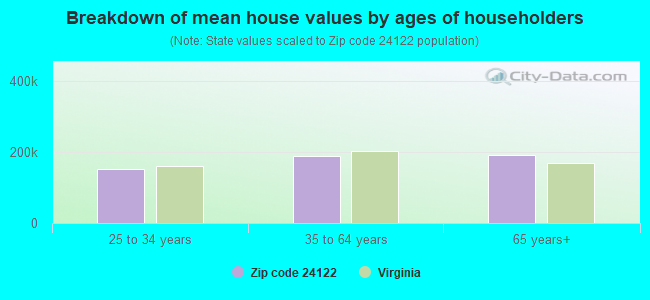
Zip code 24122 compared to state average:
Median house value below state average.
Unemployed percentage above state average.
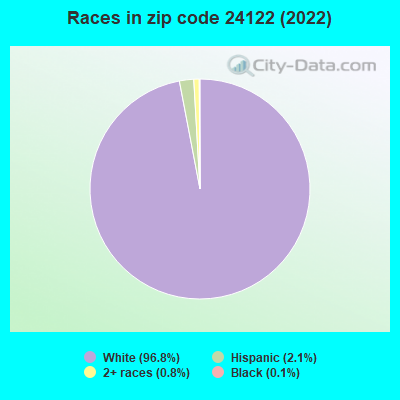
Black race population percentage significantly below state average.
Hispanic race population percentage significantly below state average.
Median age significantly above state average.
Foreign-born population percentage significantly below state average.
Renting percentage significantly below state average.
Length of stay since moving in significantly above state average.
Percentage of population with a bachelor's degree or higher significantly below state average.
Averages for the 2020 tax year for zip code 24122, filed in 2021:
Average Adjusted Gross Income (AGI) in 2020: $49,706 (Individual Income Tax Returns)
Here:
$49,706
State:
$86,446
Salary/wage: $44,326 (reported on 82.5% of returns)
Here:
$44,326
State:
$71,185
(% of AGI for various income ranges: 1085.7% for AGIs below $25k, 3486.7% for AGIs $25k-50k, 6461.8% for AGIs $50k-75k, 10090.0% for AGIs $75k-100k, 17092.0% for AGIs $100k-200k)
Taxable interest for individuals: $716 (reported on 23.8% of returns)
This zip code:
$716
Virginia:
$1,805
(% of AGI for various income ranges: 9.0% for AGIs below $25k, 20.0% for AGIs $25k-50k, 10.0% for AGIs $50k-75k, 36.0% for AGIs $75k-100k, 104.0% for AGIs $100k-200k)
Ordinary dividends: $2,382 (reported on 13.8% of returns)
Here:
$2,382
State:
$8,327
(% of AGI for various income ranges: 51.1% for AGIs $25k-50k, 61.8% for AGIs $50k-75k, 140.0% for AGIs $75k-100k, 64.0% for AGIs $100k-200k)
Net capital gain/loss in AGI: +$5,067 (reported on 11.2% of returns)
Here:
+$5,067
State:
+$24,644
(% of AGI for various income ranges: 11.0% for AGIs below $25k, 81.8% for AGIs $50k-75k, 686.0% for AGIs $100k-200k)
Profit/loss from business: +$7,714 (reported on 8.8% of returns)
Here:
+$7,714
State:
+$12,836
(% of AGI for various income ranges: 90.5% for AGIs below $25k, 318.2% for AGIs $50k-75k)
Taxable individual retirement arrangement distribution: $12,562 (reported on 10.0% of returns)
24122:
$12,562
Virginia:
$21,535
(% of AGI for various income ranges: 343.9% for AGIs $25k-50k, 772.0% for AGIs $75k-100k)
Total itemized deductions: $29,567 (reported on 3.8% of returns)
Here:
$29,567
State:
$33,287
(% of AGI for various income ranges: 1774.0% for AGIs $75k-100k)
Charity contributions: $10,350 (reported on 2.5% of returns)
Here:
$10,350
State:
$10,381
(% of AGI for various income ranges: 98.6% for AGIs below $25k)
Taxes paid: $6,667 (reported on 3.8% of returns)
24122:
$6,667
State:
$8,284
(% of AGI for various income ranges: 400.0% for AGIs $75k-100k)
Earned income credit: $1,743 (reported on 17.5% of returns)
Here:
$1,743
State:
$2,214
(% of AGI for various income ranges: 78.1% for AGIs below $25k, 44.4% for AGIs $25k-50k)
Percentage of individuals using paid preparers for their 2020 taxes: 93.8%
Here:
94%
State:
92%
(% for various income ranges: 92.6% for AGIs below $25k, 95.5% for AGIs $25k-50k, 92.9% for AGIs $50k-75k, 100.0% for AGIs $75k-100k, 88.9% for AGIs $100k-200k)
Averages for the 2012 tax year for zip code 24122, filed in 2013:
Average Adjusted Gross Income (AGI) in 2012: $45,775 (Individual Income Tax Returns)
Here:
$45,775
State:
$71,192
Salary/wage: $38,882 (reported on 88.8% of returns)
Here:
$38,882
State:
$59,229
(% of AGI for various income ranges: 77.7% for AGIs below $25k, 82.1% for AGIs $25k-50k, 78.4% for AGIs $50k-75k, 74.2% for AGIs $75k-100k, 65.4% for AGIs $100k-200k)
Taxable interest for individuals: $564 (reported on 31.2% of returns)
This zip code:
$564
Virginia:
$1,600
(% of AGI for various income ranges: 0.8% for AGIs below $25k, 0.4% for AGIs $25k-50k, 0.5% for AGIs $50k-75k, 0.3% for AGIs $75k-100k, 0.1% for AGIs $100k-200k)
Ordinary dividends: $2,327 (reported on 13.8% of returns)
Here:
$2,327
State:
$6,959
(% of AGI for various income ranges: 0.9% for AGIs $25k-50k, 0.9% for AGIs $50k-75k, 0.4% for AGIs $75k-100k, 1.0% for AGIs $100k-200k)
Net capital gain/loss in AGI: +$1,933 (reported on 11.2% of returns)
Here:
+$1,933
State:
+$16,672
(% of AGI for various income ranges: 3.3% for AGIs $75k-100k)
Profit/loss from business: +$7,844 (reported on 11.2% of returns)
Here:
+$7,844
State:
+$14,116
(% of AGI for various income ranges: 4.9% for AGIs below $25k, 1.6% for AGIs $25k-50k, 5.8% for AGIs $75k-100k)
Taxable individual retirement arrangement distribution: $11,500 (reported on 10.0% of returns)
24122:
$11,500
Virginia:
$16,667
Total itemized deductions: $19,383 (22% of AGI, reported on 22.5% of returns)
Here:
$19,383
State:
$26,596
Here:
22.2% of AGI
State:
20.1% of AGI
(% of AGI for various income ranges: 10.5% for AGIs $25k-50k, 8.0% for AGIs $50k-75k, 11.6% for AGIs $75k-100k, 13.6% for AGIs $100k-200k)
Charity contributions: $3,850 (reported on 17.5% of returns)
Here:
$3,850
State:
$4,443
(% of AGI for various income ranges: 1.3% for AGIs $25k-50k, 1.2% for AGIs $50k-75k, 1.1% for AGIs $75k-100k, 2.9% for AGIs $100k-200k)
Taxes paid: $5,139 (reported on 22.5% of returns)
24122:
$5,139
State:
$9,951
(% of AGI for various income ranges: 1.6% for AGIs $25k-50k, 2.1% for AGIs $50k-75k, 3.6% for AGIs $75k-100k, 4.4% for AGIs $100k-200k)
Earned income credit: $1,936 (reported on 17.5% of returns)
Here:
$1,936
State:
$2,211
(% of AGI for various income ranges: 4.7% for AGIs below $25k, 0.8% for AGIs $25k-50k)
Percentage of individuals using paid preparers for their 2012 taxes: 51.2%
Here:
51%
State:
46%
(% for various income ranges: 48.4% for AGIs below $25k, 45.5% for AGIs $25k-50k, 53.3% for AGIs $50k-75k, 71.4% for AGIs $75k-100k, 60.0% for AGIs $100k-200k)
Averages for the 2004 tax year for zip code 24122, filed in 2005:
Average Adjusted Gross Income (AGI) in 2004: $34,738 (Individual Income Tax Returns)
Here:
$34,738
State:
$56,704
Salary/wage: $32,644 (reported on 88.1% of returns)
Here:
$32,644
State:
$48,441
(% of AGI for various income ranges: 88.7% for AGIs below $10k, 78.6% for AGIs $10k-25k, 85.0% for AGIs $25k-50k, 85.5% for AGIs $50k-75k, 89.0% for AGIs $75k-100k, 60.1% for AGIs over 100k)
Taxable interest for individuals: $948 (reported on 33.8% of returns)
This zip code:
$948
Virginia:
$1,688
(% of AGI for various income ranges: 4.7% for AGIs below $10k, 2.2% for AGIs $10k-25k, 0.7% for AGIs $25k-50k, 0.7% for AGIs $50k-75k, 0.4% for AGIs $75k-100k, 0.1% for AGIs over 100k)
Taxable dividends: $587 (reported on 16.8% of returns)
Here:
$587
State:
$4,028
(% of AGI for various income ranges: 0.3% for AGIs below $10k, 0.8% for AGIs $10k-25k, 0.3% for AGIs $25k-50k, 0.1% for AGIs $50k-75k, 0.3% for AGIs $75k-100k)
Net capital gain/loss: +$1,342 (reported on 9.3% of returns)
Here:
+$1,342
State:
+$14,375
(% of AGI for various income ranges: 0.5% for AGIs $10k-25k, -0.1% for AGIs $25k-50k, 0.1% for AGIs $50k-75k, 1.8% for AGIs $75k-100k)
Profit/loss from business: +$8,152 (reported on 11.6% of returns)
Here:
+$8,152
State:
+$13,342
(% of AGI for various income ranges: -0.7% for AGIs below $10k, 3.7% for AGIs $10k-25k, 3.1% for AGIs $25k-50k, 4.2% for AGIs $50k-75k, 0.6% for AGIs $75k-100k)
IRA payment deduction: $2,267 (reported on 1.8% of returns)
24122:
$2,267
Virginia:
$2,943
Total itemized deductions: $14,985 (25% of AGI, reported on 23.5% of returns)
Here:
$14,985
State:
$21,492
Here:
25.3% of AGI
State:
21.0% of AGI
(% of AGI for various income ranges: 8.8% for AGIs $10k-25k, 6.9% for AGIs $25k-50k, 12.9% for AGIs $50k-75k, 11.8% for AGIs $75k-100k, 14.0% for AGIs over 100k)
Charity contributions deductions: $2,549 (4% of AGI, reported on 19.3% of returns)
Here:
$2,549
State:
$3,794
Here:
4.1% of AGI
State:
3.5% of AGI
(% of AGI for various income ranges: 0.9% for AGIs $10k-25k, 0.9% for AGIs $25k-50k, 1.7% for AGIs $50k-75k, 1.9% for AGIs $75k-100k, 2.6% for AGIs over 100k)
Total tax: $3,615 (reported on 75.4% of returns)
24122:
$3,615
State:
$9,537
(% of AGI for various income ranges: 2.7% for AGIs below $10k, 3.8% for AGIs $10k-25k, 6.5% for AGIs $25k-50k, 8.3% for AGIs $50k-75k, 10.2% for AGIs $75k-100k, 14.8% for AGIs over 100k)
Earned income credit: $1,638 (reported on 17.9% of returns)
Here:
$1,638
State:
$1,734
Percentage of individuals using paid preparers for their 2004 taxes: 54.9%
Here:
55%
State:
52%
(% for various income ranges: 48.1% for AGIs below $10k, 51.5% for AGIs $10k-25k, 58.4% for AGIs $25k-50k, 57.2% for AGIs $50k-75k, 60.7% for AGIs $75k-100k, 71.4% for AGIs over 100k)
Notable locations in zip code 24122: Montvale Overlook (A), Pine Tree Overlook (B), Porters Mountain Overlook (C), Goose Creek Valley Overlook (D), Sharp Top Overlook (E), Montvale Rescue Squad Number 9 (F), Montvale Fire Station Company Number 9 (G). Display/hide their locations on the map
In group quarters: 3 (-1 institutionalized population)
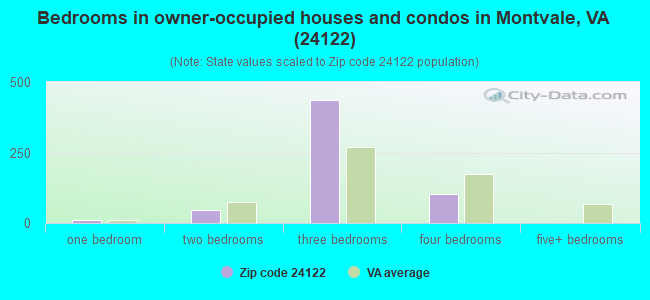
Size of family households: 226 2-persons, 88 3-persons, 81 4-persons, 10 5-persons, 13 7-or-more-persons
Size of nonfamily households: 191 1-person, 37 2-persons
58 married couples with children.
33 single-parent households (8 men, 25 women).
97.5% of residents of 24122 zip code speak English at home.
1.6% of residents speak Spanish at home (43% very well, 13% well, 39% not well, 4% not at all).
0.6% of residents speak other Indo-European language at home (100% well).
0.1% of residents speak Asian or Pacific Island language at home (100% well).
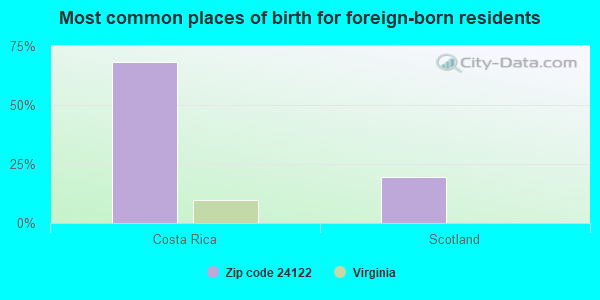
Foreign born population: 41 (2.8%) (49.1% of them are naturalized citizens)
This zip code:
2.8%
Whole state:
12.7%
68%Costa Rica
20%Scotland
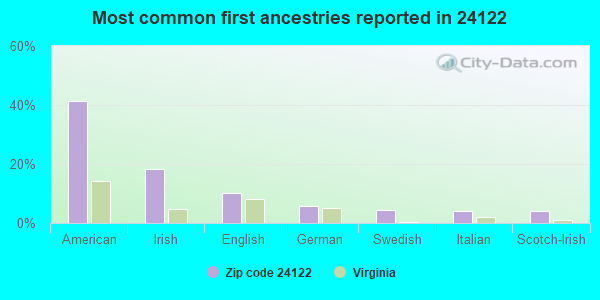
42%American
18%Irish
10%English
6%German
4%Swedish
4%Italian
4%Scotch-Irish
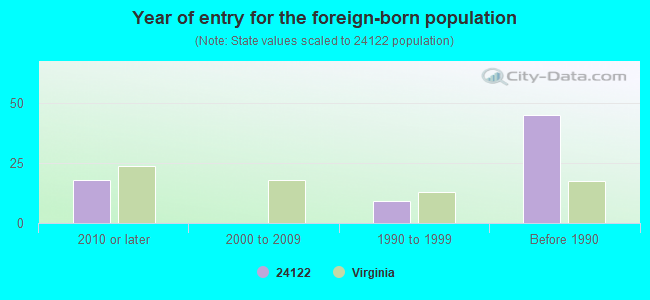
Year of entry for the foreign-born population
182010 or later
02000 to 2009
91990 to 1999
45Before 1990
Facilities with environmental interests located in this zip code:
CITGO PETROLEUM CORP (1070 OIL TERMINAL RD in MONTVALE, VA)
AIR SYNTHETIC MINOR (AIRS/AFS) AIR MINOR (AIRS/AFS) STATE MASTER (Virginia pollutants databases) - CEDS-30264, AIR PROGRAM CRITERIA AND HAZARDOUS AIR POLLUTANT INVENTORY (Inventory of air pollution sources) Business SIC and NAICS classification: PETROLEUM BULK STATIONS AND TERMINALS Alternative names: BP PRODUCTS MONTVALE TERMINAL
BP PRODUCTS NORTH AMERICA INCORPORATED (1070 OIL TERMINAL RD in MONTVALE, VA)
STATE MASTER (Virginia pollutants databases) - CEDS-30232, AIR PROGRAM National Pollutant Discharge Elimination System NON-MAJOR (Tracking pollutant discharge elimination systems) - permit Business SIC and NAICS classification: PETROLEUM BULK STATIONS AND TERMINALS Alternative names: AMOCO OIL CO -OIL TERMINAL, BP PRODUCTS, MONTVALE TERMINAL
CHESAPEAKE & POTOMAC TELEPHONE CO (US HIGHWAY 460 in MONTVALE, VA)
(Resource Conservation and Recovery Act (tracking hazardous waste)) Organizations: OPERNAME (CONTACT/OPERATOR)
, CHESAPEAKE & POTOMAC TELEPHONE COMPANY (CONTACT/OWNER)
AMOCO OIL CO (US RT 460 & RT 607 in MONTVALE, VA)
HAZARDOUS WASTE BIENNIAL REPORTER (Resource Conservation and Recovery Act (tracking hazardous waste)) Small Quantity Generators, between 100 kg and 1000 kg of hazardous waste/month (Resource Conservation and Recovery Act (tracking hazardous waste)) Organizations: OPERNAME (CONTACT/OPERATOR)
BUTTERFIELD'S INC (RT 460 in MONTVALE, VA)
Small Quantity Generators, between 100 kg and 1000 kg of hazardous waste/month (Resource Conservation and Recovery Act (tracking hazardous waste)) - notification Organizations: ROLAND L & JEAN R HELMS (CONTACT/OWNER)
CITGO PETROLEUM TERMINAL (RT 460 E & RT 607 in MONTVALE, VA)
Conditionally Exempt Small Quantity Generators, less than 100 kg/month of hazardous waste (Resource Conservation and Recovery Act (tracking hazardous waste)) - notification Organizations: CITGO PETROLEUM CORP (CONTACT/OWNER)
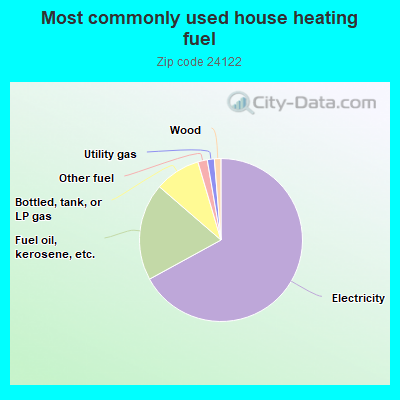
67.3%Electricity
19.4%Fuel oil, kerosene, etc.
9.1%Bottled, tank, or LP gas
1.9%Other fuel
1.4%Utility gas
1.3%Wood
Population in 1990: 1,747. Population change in the 1990s: +272 (+15.6%).
Place of birth for U.S.-born residents:
This state: 1,081
Northeast: 67
Midwest: 69
South: 149
West: 8
62% of the 24122 zip code residents lived in the same house 5 years ago. Out of people who lived in different houses, 33% lived in this county. Out of people who lived in different counties, 50% lived in Virginia.
92% of the 24122 zip code residents lived in the same house 1 year ago. Out of people who lived in different houses, 91% moved from this county. Out of people who lived in different houses, 1% moved from different county within same state.
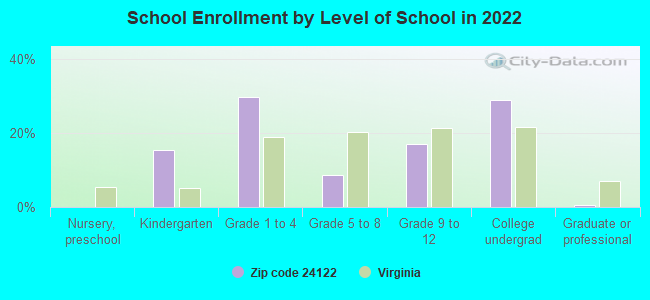
Private vs. public school enrollment:
Students in private schools in grades 1 to 8 (elementary and middle school):
Here:
0.0%
Virginia:
13.2%
Students in private schools in grades 9 to 12 (high school):
Here:
0.0%
Virginia:
10.2%
Students in private undergraduate colleges:
Here:
0.0%
Virginia:
18.7%
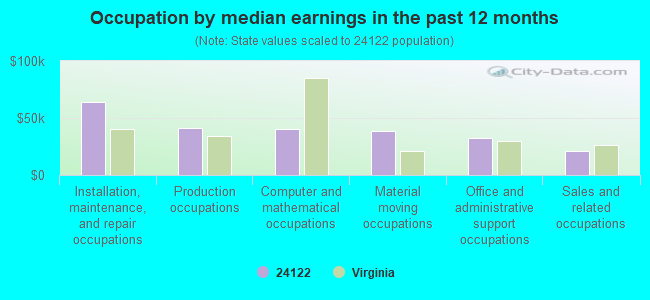
Occupation by median earnings in the past 12 months ($)
64,419Installation, maintenance, and repair occupations
40,826Production occupations
40,210Computer and mathematical occupations
38,989Material moving occupations
32,557Office and administrative support occupations
20,770Sales and related occupations
Companies with federal contracts located in this zip code:
ART REED EQUIPMENT (11081 W LYNCHBURG in MONTVALE, VA; small business)
$24,000 with Soil Conservation Service (disused code) for Maintenance, Repair or Alteration of Real Property -- Other Conservation and Development Facilities. Signed on 2001-05-15. Completion date: 2001-07-15.
MONTVALE CONSTRUCTION INC (5108 GOOSE CREEK VLY RD in MONTVALE, VA; small business) 7 employees, $1000000 revenue.
$14,600 with Forest Service for Water Services. Signed on 2003-08-15. Completion date: 2003-09-15.
Top industries in this zip code by the number of employees in 2005:
Health Care and Social Assistance: Nursing Care Facilities (20-49 employees: 1 establishment)
Construction: Roofing Contractors (10-19: 1)
Wholesale Trade: Petroleum and Petroleum Products Merchant Wholesalers (except Bulk Stations and Terminals) (5-9: 1, 1-4: 2)
Accommodation and Food Services: Full-Service Restaurants (5-9: 1, 1-4: 1)
People in group quarters in 2010:
2 people in workers' group living quarters and job corps centers
People in group quarters in 2000:
32 people in nursing homes
Fatal accident statistics in 2012:
Fatal accident count: 1
Vehicles involved in fatal accidents: 2
Fatal accidents caused by drunken drivers: 1
Fatalities: 1
Persons involved in fatal accidents: 3
Pedestrians involved in fatal accidents: 0
Fatal accident statistics in 2010:
Fatal accident count: 1
Vehicles involved in fatal accidents: 1
Fatal accidents caused by drunken drivers: 0
Fatalities: 1
Persons involved in fatal accidents: 1
Pedestrians involved in fatal accidents: 0
Home Mortgage Disclosure Act Aggregated Statistics For Year 2009 (Based on 2 partial tracts)
A) FHA, FSA/RHS & VA Home Purchase Loans
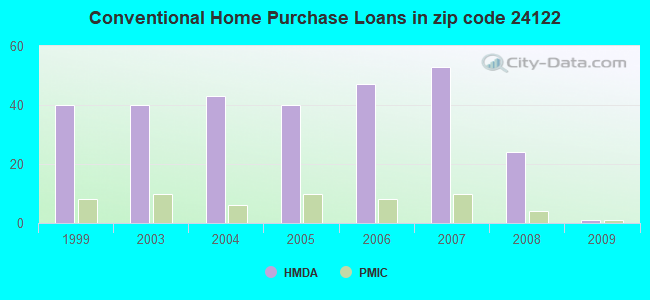
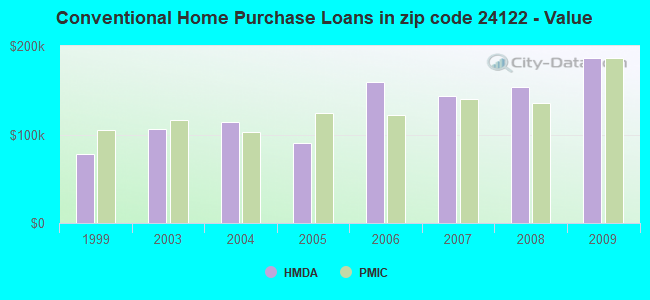
B) Conventional Home Purchase Loans
C) Refinancings
D) Home Improvement Loans
F) Non-occupant Loans on < 5 Family Dwellings (A B C & D)
G) Loans On Manufactured Home Dwelling (A B C & D)
Number
Average Value
Number
Average Value
Number
Average Value
Number
Average Value
Number
Average Value
Number
Average Value
LOANS ORIGINATED
14
$109,249
1
$186,920
66
$157,741
9
$18,383
1
$186,920
5
$120,742
APPLICATIONS APPROVED, NOT ACCEPTED
1
$77,040
0
$0
9
$230,989
0
$0
0
$0
5
$87,146
APPLICATIONS DENIED
3
$83,780
3
$94,303
33
$182,676
5
$37,890
1
$188,190
6
$99,777
APPLICATIONS WITHDRAWN
6
$135,983
4
$149,980
23
$157,546
0
$0
0
$0
6
$103,987
FILES CLOSED FOR INCOMPLETENESS
1
$186,920
0
$0
5
$204,100
1
$103,570
1
$37,890
1
$186,920
Aggregated Statistics For Year 2008 (Based on 2 partial tracts)
A) FHA, FSA/RHS & VA Home Purchase Loans
B) Conventional Home Purchase Loans
C) Refinancings
D) Home Improvement Loans
F) Non-occupant Loans on < 5 Family Dwellings (A B C & D)
G) Loans On Manufactured Home Dwelling (A B C & D)
Number
Average Value
Number
Average Value
Number
Average Value
Number
Average Value
Number
Average Value
Number
Average Value
LOANS ORIGINATED
13
$121,151
24
$154,139
72
$134,141
20
$37,196
5
$59,614
29
$77,304
APPLICATIONS APPROVED, NOT ACCEPTED
0
$0
3
$166,717
11
$145,015
3
$31,997
0
$0
0
$0
APPLICATIONS DENIED
3
$96,830
3
$112,827
43
$159,079
11
$39,038
0
$0
14
$90,485
APPLICATIONS WITHDRAWN
0
$0
8
$97,566
24
$180,398
8
$78,464
3
$75,780
5
$114,176
FILES CLOSED FOR INCOMPLETENESS
0
$0
0
$0
3
$228,183
1
$126,300
0
$0
0
$0
Aggregated Statistics For Year 2007 (Based on 2 partial tracts)
A) FHA, FSA/RHS & VA Home Purchase Loans
B) Conventional Home Purchase Loans
C) Refinancings
D) Home Improvement Loans
F) Non-occupant Loans on < 5 Family Dwellings (A B C & D)
G) Loans On Manufactured Home Dwelling (A B C & D)
Number
Average Value
Number
Average Value
Number
Average Value
Number
Average Value
Number
Average Value
Number
Average Value
LOANS ORIGINATED
13
$111,922
53
$143,458
71
$124,646
28
$47,272
0
$0
30
$90,010
APPLICATIONS APPROVED, NOT ACCEPTED
1
$151,560
5
$225,320
19
$110,479
3
$17,260
1
$219,760
3
$63,150
APPLICATIONS DENIED
3
$91,357
9
$99,216
69
$138,893
21
$54,008
4
$74,200
11
$55,916
APPLICATIONS WITHDRAWN
1
$65,680
11
$174,868
39
$134,007
6
$63,360
4
$149,035
10
$67,949
FILES CLOSED FOR INCOMPLETENESS
0
$0
1
$245,020
18
$189,731
0
$0
0
$0
0
$0
Aggregated Statistics For Year 2006 (Based on 2 partial tracts)
A) FHA, FSA/RHS & VA Home Purchase Loans
B) Conventional Home Purchase Loans
C) Refinancings
D) Home Improvement Loans
F) Non-occupant Loans on < 5 Family Dwellings (A B C & D)
G) Loans On Manufactured Home Dwelling (A B C & D)
Number
Average Value
Number
Average Value
Number
Average Value
Number
Average Value
Number
Average Value
Number
Average Value
LOANS ORIGINATED
13
$87,535
47
$159,649
81
$129,824
14
$51,512
3
$35,363
28
$83,448
APPLICATIONS APPROVED, NOT ACCEPTED
1
$44,200
9
$46,310
27
$139,631
3
$122,510
1
$55,570
10
$36,627
APPLICATIONS DENIED
3
$58,097
14
$81,644
82
$122,711
32
$24,471
3
$110,303
35
$61,995
APPLICATIONS WITHDRAWN
4
$120,932
6
$90,515
38
$149,167
4
$67,885
1
$161,660
8
$78,148
FILES CLOSED FOR INCOMPLETENESS
0
$0
0
$0
8
$108,460
0
$0
0
$0
0
$0
Aggregated Statistics For Year 2005 (Based on 2 partial tracts)
A) FHA, FSA/RHS & VA Home Purchase Loans
B) Conventional Home Purchase Loans
C) Refinancings
D) Home Improvement Loans
F) Non-occupant Loans on < 5 Family Dwellings (A B C & D)
G) Loans On Manufactured Home Dwelling (A B C & D)
Number
Average Value
Number
Average Value
Number
Average Value
Number
Average Value
Number
Average Value
Number
Average Value
LOANS ORIGINATED
13
$89,867
40
$90,904
82
$110,651
16
$84,148
3
$21,893
30
$72,749
APPLICATIONS APPROVED, NOT ACCEPTED
3
$55,573
18
$54,941
14
$67,841
3
$34,100
3
$69,887
18
$51,081
APPLICATIONS DENIED
3
$89,253
15
$129,584
73
$125,677
11
$61,084
1
$141,460
27
$91,544
APPLICATIONS WITHDRAWN
0
$0
1
$101,040
45
$113,838
4
$69,465
0
$0
14
$82,185
FILES CLOSED FOR INCOMPLETENESS
0
$0
1
$37,890
8
$117,301
1
$36,630
0
$0
1
$107,350
Aggregated Statistics For Year 2004 (Based on 2 partial tracts)
A) FHA, FSA/RHS & VA Home Purchase Loans
B) Conventional Home Purchase Loans
C) Refinancings
D) Home Improvement Loans
F) Non-occupant Loans on < 5 Family Dwellings (A B C & D)
G) Loans On Manufactured Home Dwelling (A B C & D)
Number
Average Value
Number
Average Value
Number
Average Value
Number
Average Value
Number
Average Value
Number
Average Value
LOANS ORIGINATED
20
$78,622
43
$114,199
92
$92,213
23
$19,055
8
$79,726
34
$66,122
APPLICATIONS APPROVED, NOT ACCEPTED
0
$0
13
$88,118
34
$99,926
4
$35,680
0
$0
11
$65,676
APPLICATIONS DENIED
1
$103,570
23
$94,176
77
$97,333
9
$25,961
3
$54,730
28
$73,840
APPLICATIONS WITHDRAWN
0
$0
8
$92,356
51
$96,013
6
$46,732
0
$0
14
$80,201
FILES CLOSED FOR INCOMPLETENESS
0
$0
0
$0
8
$135,299
0
$0
0
$0
0
$0
Aggregated Statistics For Year 2003 (Based on 2 partial tracts)
A) FHA, FSA/RHS & VA Home Purchase Loans
B) Conventional Home Purchase Loans
C) Refinancings
D) Home Improvement Loans
F) Non-occupant Loans on < 5 Family Dwellings (A B C & D)
Number
Average Value
Number
Average Value
Number
Average Value
Number
Average Value
Number
Average Value
LOANS ORIGINATED
16
$100,882
40
$106,692
155
$100,201
19
$66,873
6
$94,093
APPLICATIONS APPROVED, NOT ACCEPTED
0
$0
5
$100,282
25
$66,737
0
$0
0
$0
APPLICATIONS DENIED
3
$61,467
37
$58,644
72
$91,269
11
$41,335
4
$89,988
APPLICATIONS WITHDRAWN
4
$91,252
3
$70,727
39
$104,246
3
$65,253
1
$117,460
FILES CLOSED FOR INCOMPLETENESS
0
$0
3
$25,260
5
$121,500
0
$0
0
$0
Aggregated Statistics For Year 1999 (Based on 1 partial tract)
A) FHA, FSA/RHS & VA Home Purchase Loans
B) Conventional Home Purchase Loans
C) Refinancings
D) Home Improvement Loans
F) Non-occupant Loans on < 5 Family Dwellings (A B C & D)
Detailed PMIC statistics for the following Tracts:0306.05
2002 - 2018 National Fire Incident Reporting System (NFIRS) incidents
According to the data from the years 2002 - 2018 the average number of fires per year is 14. The highest number of reported fire incidents - 30 took place in 2008, and the least - 5 in 2011. The data has a rising trend.
When looking into fire subcategories, the most incidents belonged to: Structure Fires (46.2%), and Outside Fires (32.2%).
Fire incident types reported to NFIRS in Zip Code 24122


 Nearest zip codes: 24174, 24064, 24066, 24179, 24523, 24095.


 According to the data from the years 2002 - 2018 the average number of fires per year is 14. The highest number of reported fire incidents - 30 took place in 2008, and the least - 5 in 2011. The data has a rising trend.
 When looking into fire subcategories, the most incidents belonged to: Structure Fires (46.2%), and Outside Fires (32.2%).