Estimated zip code population in 2022: 21,276 Zip code population in 2010: 18,952 Zip code population in 2000: 18,024
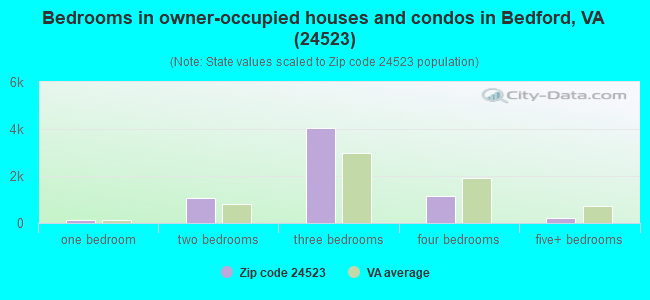
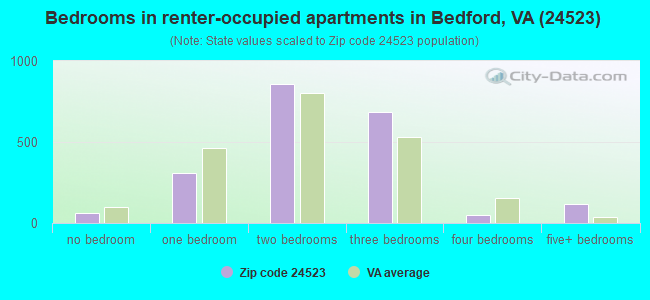
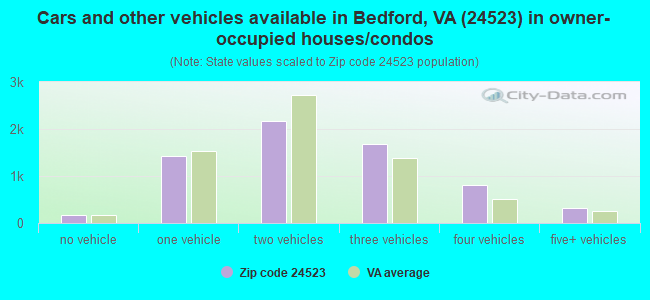
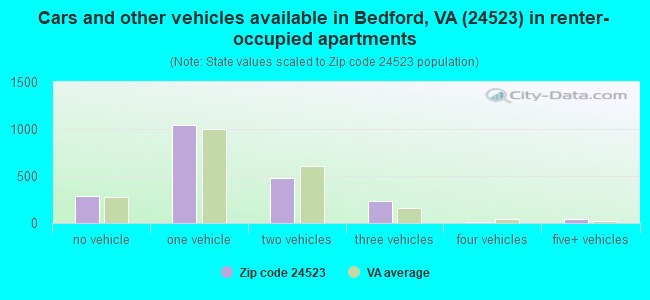
Houses and condos: 9,781 Renter-occupied apartments: 2,088
% of renters here:
24%
State:
33%
March 2022 cost of living index in zip code 24523: 84.7 (less than average, U.S. average is 100)
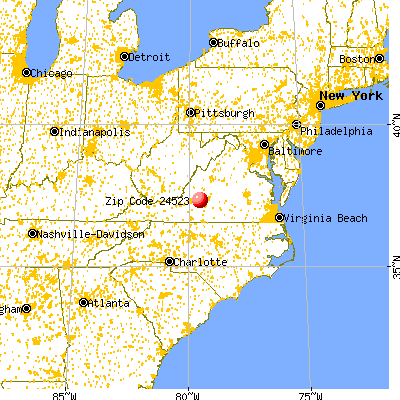
Land area: 225.3 sq. mi. Water area: 0.7 sq. mi.
Population density: 94 people per square mile
(very low).
OSM Map
General Map
Google Map
MSN Map
OSM Map
General Map
Google Map
MSN Map
OSM Map
General Map
Google Map
MSN Map
OSM Map
General Map
Google Map
MSN Map
Please wait while loading the map...
Real estate property taxes paid for housing units in 2022:
This zip code:
0.5% ($1,084)
Virginia:
0.7% ($2,617)
Median real estate property taxes paid for housing units with mortgages in 2022: $1,151 (0.4%) Median real estate property taxes paid for housing units with no mortgage in 2022: $1,009 (0.5%)
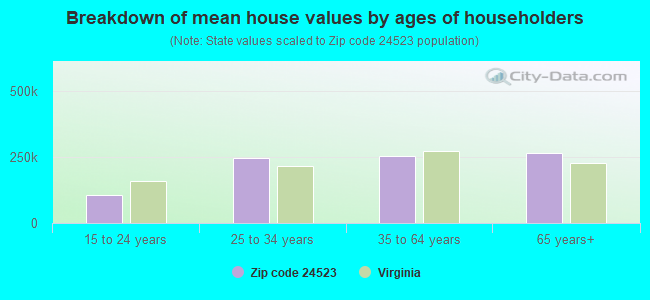
Estimated median house/condo value in 2022: $226,867
24523:
$226,867
Virginia:
$365,700
According to our research of Virginia and other state lists, there were 64 registered sex offenders living in 24523 zip code as of April 27, 2024. The ratio of all residents to sex offenders in zip code 24523 is 311 to 1. The ratio of registered sex offenders to all residents in this zip code is near the state average.
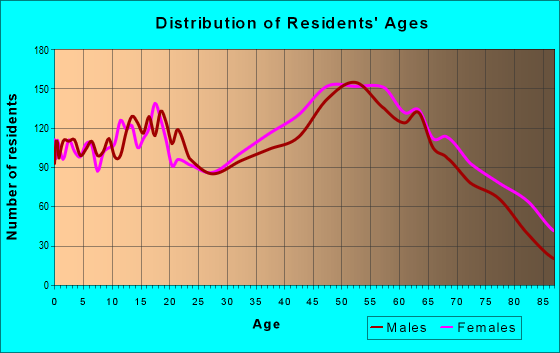
Median resident age:
This zip code:
46.1 years
Virginia median age:
39.0 years
Average household size:
This zip code:
2.4 people
Virginia:
2.5 people
Averages for the 2020 tax year for zip code 24523, filed in 2021:
Average Adjusted Gross Income (AGI) in 2020: $53,095 (Individual Income Tax Returns)
Here:
$53,095
State:
$86,446
Salary/wage: $45,443 (reported on 80.8% of returns)
Here:
$45,443
State:
$71,185
(% of AGI for various income ranges: 1214.1% for AGIs below $25k, 3512.4% for AGIs $25k-50k, 6013.5% for AGIs $50k-75k, 8825.6% for AGIs $75k-100k, 15728.4% for AGIs $100k-200k, 44155.7% for AGIs over 200k)
Taxable interest for individuals: $1,741 (reported on 28.3% of returns)
This zip code:
$1,741
Virginia:
$1,805
(% of AGI for various income ranges: 20.8% for AGIs below $25k, 26.8% for AGIs $25k-50k, 60.8% for AGIs $50k-75k, 77.0% for AGIs $75k-100k, 172.1% for AGIs $100k-200k, 1942.9% for AGIs over 200k)
Ordinary dividends: $5,496 (reported on 18.0% of returns)
Here:
$5,496
State:
$8,327
(% of AGI for various income ranges: 33.4% for AGIs below $25k, 46.8% for AGIs $25k-50k, 109.0% for AGIs $50k-75k, 141.1% for AGIs $75k-100k, 407.5% for AGIs $100k-200k, 4181.4% for AGIs over 200k)
Net capital gain/loss in AGI: +$10,030 (reported on 15.6% of returns)
Here:
+$10,030
State:
+$24,644
(% of AGI for various income ranges: 11.3% for AGIs below $25k, 34.5% for AGIs $25k-50k, 113.6% for AGIs $50k-75k, 145.2% for AGIs $75k-100k, 741.6% for AGIs $100k-200k, 9614.3% for AGIs over 200k)
Profit/loss from business: +$9,918 (reported on 12.5% of returns)
Here:
+$9,918
State:
+$12,836
(% of AGI for various income ranges: 86.4% for AGIs below $25k, 80.8% for AGIs $25k-50k, 168.0% for AGIs $50k-75k, 195.7% for AGIs $75k-100k, 347.0% for AGIs $100k-200k, 3930.0% for AGIs over 200k)
Taxable individual retirement arrangement distribution: $15,573 (reported on 10.8% of returns)
24523:
$15,573
Virginia:
$21,535
(% of AGI for various income ranges: 73.0% for AGIs below $25k, 97.1% for AGIs $25k-50k, 259.7% for AGIs $50k-75k, 411.6% for AGIs $75k-100k, 742.8% for AGIs $100k-200k, 3191.4% for AGIs over 200k)
Total itemized deductions: $33,175 (reported on 5.0% of returns)
Here:
$33,175
State:
$33,287
(% of AGI for various income ranges: 46.1% for AGIs below $25k, 104.0% for AGIs $25k-50k, 170.5% for AGIs $50k-75k, 340.3% for AGIs $75k-100k, 785.6% for AGIs $100k-200k, 4861.4% for AGIs over 200k)
Charity contributions: $11,841 (reported on 4.2% of returns)
Here:
$11,841
State:
$10,381
(% of AGI for various income ranges: 4.1% for AGIs below $25k, 12.5% for AGIs $25k-50k, 33.4% for AGIs $50k-75k, 86.2% for AGIs $75k-100k, 293.9% for AGIs $100k-200k, 2185.7% for AGIs over 200k)
Taxes paid: $6,334 (reported on 5.0% of returns)
24523:
$6,334
State:
$8,284
(% of AGI for various income ranges: 2.5% for AGIs below $25k, 10.9% for AGIs $25k-50k, 27.1% for AGIs $50k-75k, 66.9% for AGIs $75k-100k, 189.3% for AGIs $100k-200k, 1111.4% for AGIs over 200k)
Earned income credit: $2,205 (reported on 17.0% of returns)
Here:
$2,205
State:
$2,214
(% of AGI for various income ranges: 93.5% for AGIs below $25k, 64.1% for AGIs $25k-50k, 1.4% for AGIs $50k-75k)
Percentage of individuals using paid preparers for their 2020 taxes: 93.8%
Here:
94%
State:
92%
(% for various income ranges: 93.8% for AGIs below $25k, 94.6% for AGIs $25k-50k, 92.6% for AGIs $50k-75k, 94.2% for AGIs $75k-100k, 93.9% for AGIs $100k-200k, 89.5% for AGIs over 200k)
Averages for the 2012 tax year for zip code 24523, filed in 2013:
Average Adjusted Gross Income (AGI) in 2012: $43,915 (Individual Income Tax Returns)
Here:
$43,915
State:
$71,192
Salary/wage: $38,392 (reported on 83.0% of returns)
Here:
$38,392
State:
$59,229
(% of AGI for various income ranges: 74.9% for AGIs below $25k, 77.3% for AGIs $25k-50k, 75.5% for AGIs $50k-75k, 72.2% for AGIs $75k-100k, 71.2% for AGIs $100k-200k, 53.5% for AGIs over 200k)
Taxable interest for individuals: $1,595 (reported on 33.5% of returns)
This zip code:
$1,595
Virginia:
$1,600
(% of AGI for various income ranges: 2.0% for AGIs below $25k, 1.1% for AGIs $25k-50k, 0.9% for AGIs $50k-75k, 1.2% for AGIs $75k-100k, 1.1% for AGIs $100k-200k, 1.4% for AGIs over 200k)
Ordinary dividends: $3,275 (reported on 19.4% of returns)
Here:
$3,275
State:
$6,959
(% of AGI for various income ranges: 2.0% for AGIs below $25k, 1.0% for AGIs $25k-50k, 1.1% for AGIs $50k-75k, 1.2% for AGIs $75k-100k, 1.7% for AGIs $100k-200k, 2.4% for AGIs over 200k)
Net capital gain/loss in AGI: +$4,144 (reported on 14.1% of returns)
Here:
+$4,144
State:
+$16,672
(% of AGI for various income ranges: 0.5% for AGIs $25k-50k, 1.0% for AGIs $50k-75k, 0.8% for AGIs $75k-100k, 1.4% for AGIs $100k-200k, 7.5% for AGIs over 200k)
Profit/loss from business: +$7,867 (reported on 12.7% of returns)
Here:
+$7,867
State:
+$14,116
(% of AGI for various income ranges: 5.4% for AGIs below $25k, 2.6% for AGIs $25k-50k, 1.4% for AGIs $50k-75k, 1.3% for AGIs $75k-100k, 2.6% for AGIs $100k-200k)
Taxable individual retirement arrangement distribution: $12,125 (reported on 12.2% of returns)
24523:
$12,125
Virginia:
$16,667
(% of AGI for various income ranges: 3.8% for AGIs below $25k, 2.4% for AGIs $25k-50k, 3.0% for AGIs $50k-75k, 3.9% for AGIs $75k-100k, 4.0% for AGIs $100k-200k, 3.6% for AGIs over 200k)
Total itemized deductions: $19,237 (24% of AGI, reported on 25.4% of returns)
Here:
$19,237
State:
$26,596
Here:
23.5% of AGI
State:
20.1% of AGI
(% of AGI for various income ranges: 8.4% for AGIs below $25k, 8.9% for AGIs $25k-50k, 10.5% for AGIs $50k-75k, 12.1% for AGIs $75k-100k, 13.6% for AGIs $100k-200k, 14.6% for AGIs over 200k)
Charity contributions: $4,359 (reported on 19.9% of returns)
Here:
$4,359
State:
$4,443
(% of AGI for various income ranges: 0.8% for AGIs below $25k, 1.2% for AGIs $25k-50k, 1.7% for AGIs $50k-75k, 1.9% for AGIs $75k-100k, 2.7% for AGIs $100k-200k, 4.5% for AGIs over 200k)
Taxes paid: $5,309 (reported on 25.4% of returns)
24523:
$5,309
State:
$9,951
(% of AGI for various income ranges: 1.0% for AGIs below $25k, 1.6% for AGIs $25k-50k, 2.5% for AGIs $50k-75k, 3.5% for AGIs $75k-100k, 4.9% for AGIs $100k-200k, 5.9% for AGIs over 200k)
Earned income credit: $2,176 (reported on 20.4% of returns)
Here:
$2,176
State:
$2,211
(% of AGI for various income ranges: 6.4% for AGIs below $25k, 1.1% for AGIs $25k-50k)
Percentage of individuals using paid preparers for their 2012 taxes: 51.4%
Here:
51%
State:
46%
(% for various income ranges: 48.0% for AGIs below $25k, 50.0% for AGIs $25k-50k, 53.7% for AGIs $50k-75k, 56.9% for AGIs $75k-100k, 59.3% for AGIs $100k-200k, 88.9% for AGIs over 200k)
Averages for the 2004 tax year for zip code 24523, filed in 2005:
Average Adjusted Gross Income (AGI) in 2004: $37,132 (Individual Income Tax Returns)
Here:
$37,132
State:
$56,704
Salary/wage: $32,774 (reported on 84.2% of returns)
Here:
$32,774
State:
$48,441
(% of AGI for various income ranges: 95.2% for AGIs below $10k, 76.0% for AGIs $10k-25k, 81.3% for AGIs $25k-50k, 79.4% for AGIs $50k-75k, 77.2% for AGIs $75k-100k, 54.2% for AGIs over 100k)
Taxable interest for individuals: $1,976 (reported on 41.9% of returns)
This zip code:
$1,976
Virginia:
$1,688
(% of AGI for various income ranges: 7.2% for AGIs below $10k, 3.0% for AGIs $10k-25k, 1.6% for AGIs $25k-50k, 1.4% for AGIs $50k-75k, 1.7% for AGIs $75k-100k, 3.2% for AGIs over 100k)
Taxable dividends: $3,055 (reported on 21.1% of returns)
Here:
$3,055
State:
$4,028
(% of AGI for various income ranges: 4.1% for AGIs below $10k, 1.4% for AGIs $10k-25k, 1.1% for AGIs $25k-50k, 0.9% for AGIs $50k-75k, 1.4% for AGIs $75k-100k, 3.6% for AGIs over 100k)
Net capital gain/loss: +$8,571 (reported on 16.7% of returns)
Here:
+$8,571
State:
+$14,375
(% of AGI for various income ranges: -0.5% for AGIs below $10k, 0.6% for AGIs $10k-25k, 0.8% for AGIs $25k-50k, 1.4% for AGIs $50k-75k, 1.3% for AGIs $75k-100k, 15.0% for AGIs over 100k)
Profit/loss from business: +$8,491 (reported on 13.1% of returns)
Here:
+$8,491
State:
+$13,342
(% of AGI for various income ranges: 0.7% for AGIs below $10k, 4.3% for AGIs $10k-25k, 2.7% for AGIs $25k-50k, 2.1% for AGIs $50k-75k, 3.1% for AGIs $75k-100k, 3.6% for AGIs over 100k)
IRA payment deduction: $2,810 (reported on 2.9% of returns)
24523:
$2,810
Virginia:
$2,943
(% of AGI for various income ranges: 0.2% for AGIs $10k-25k, 0.3% for AGIs $25k-50k, 0.2% for AGIs $50k-75k, 0.2% for AGIs $75k-100k, 0.1% for AGIs over 100k)
Self-employed pension: $10,480 (reported on 0.3% of returns)
Here:
$10,480
Virginia:
$17,430
Total itemized deductions: $15,854 (23% of AGI, reported on 25.0% of returns)
Here:
$15,854
State:
$21,492
Here:
23.0% of AGI
State:
21.0% of AGI
(% of AGI for various income ranges: 9.9% for AGIs below $10k, 6.8% for AGIs $10k-25k, 9.2% for AGIs $25k-50k, 11.2% for AGIs $50k-75k, 13.8% for AGIs $75k-100k, 12.5% for AGIs over 100k)
Charity contributions deductions: $3,627 (5% of AGI, reported on 21.0% of returns)
Here:
$3,627
State:
$3,794
Here:
5.0% of AGI
State:
3.5% of AGI
(% of AGI for various income ranges: 0.6% for AGIs below $10k, 0.8% for AGIs $10k-25k, 1.4% for AGIs $25k-50k, 1.9% for AGIs $50k-75k, 2.5% for AGIs $75k-100k, 3.7% for AGIs over 100k)
Total tax: $4,605 (reported on 73.8% of returns)
24523:
$4,605
State:
$9,537
(% of AGI for various income ranges: 2.4% for AGIs below $10k, 4.0% for AGIs $10k-25k, 6.6% for AGIs $25k-50k, 8.4% for AGIs $50k-75k, 10.6% for AGIs $75k-100k, 16.6% for AGIs over 100k)
Earned income credit: $1,702 (reported on 17.4% of returns)
Here:
$1,702
State:
$1,734
Percentage of individuals using paid preparers for their 2004 taxes: 56.5%
Here:
57%
State:
52%
(% for various income ranges: 50.7% for AGIs below $10k, 57.9% for AGIs $10k-25k, 55.4% for AGIs $25k-50k, 59.2% for AGIs $50k-75k, 56.0% for AGIs $75k-100k, 70.8% for AGIs over 100k)
Likely homosexual households (counted as self-reported same-sex unmarried-partner households)
Lesbian couples: 0.1% of all households
Gay men: 0.0% of all households
Household received Food Stamps/SNAP in the past 12 months: 1,024 Household did not receive Food Stamps/SNAP in the past 12 months: 7,669
Women who had a birth in the past 12 months: 429 (331 now married, 99 unmarried) Women who did not have a birth in the past 12 months: 3,894 (1,995 now married, 1,885 unmarried)
Housing units in zip code 24523 with a mortgage: 3,718 (301 second mortgage, 29 home equity loan, 274 both second mortgage and home equity loan) Houses without a mortgage: 107
Median monthly owner costs for units with a mortgage: $1,194 Median monthly owner costs for units without a mortgage: $363
Residents with income below the poverty level in 2022:
This zip code:
14.5%
Whole state:
10.6%
Residents with income below 50% of the poverty level in 2022:
This zip code:
9.8%
Whole state:
5.2%
Median number of rooms in houses and condos:
Here:
6.3
State:
7.0
Median number of rooms in apartments:
Here:
4.6
State:
4.3
Notable locations in this zip code not listed on our city pages
In group quarters: 381 (-1 institutionalized population)
Size of family households: 3,010 2-persons, 1,262 3-persons, 927 4-persons, 317 5-persons, 116 6-persons, 276 7-or-more-persons
Size of nonfamily households: 2,325 1-person, 432 2-persons, 15 3-persons
2,701 married couples with children.
1,036 single-parent households (350 men, 686 women).
95.7% of residents of 24523 zip code speak English at home.
2.3% of residents speak Spanish at home (67% very well, 27% well, 5% not well).
0.7% of residents speak other Indo-European language at home (100% very well).
1.0% of residents speak Asian or Pacific Island language at home (24% very well, 19% well, 38% not well, 19% not at all).
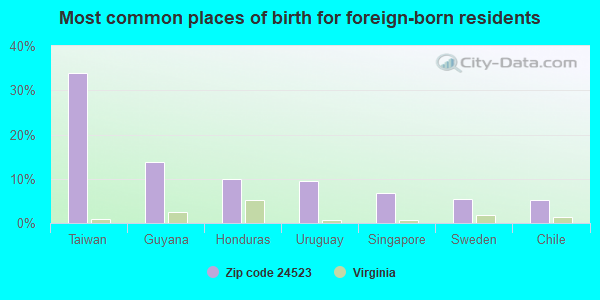
Foreign born population: 583 (2.7%) (35.9% of them are naturalized citizens)
This zip code:
2.7%
Whole state:
12.7%
34%Taiwan
14%Guyana
10%Honduras
10%Uruguay
7%Singapore
5%Sweden
5%Chile
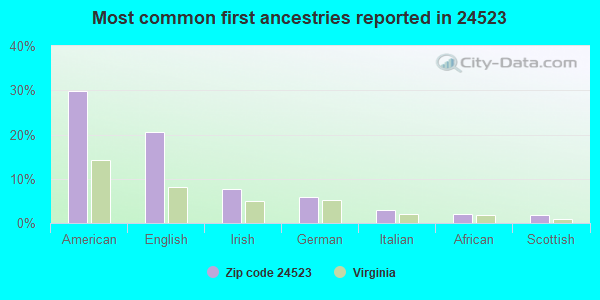
30%American
21%English
8%Irish
6%German
3%Italian
2%African
2%Scottish
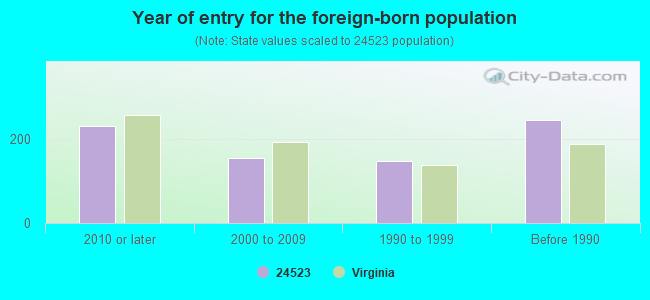
Year of entry for the foreign-born population
2322010 or later
1552000 to 2009
1481990 to 1999
246Before 1990
Major facilities with environmental interests located in this zip code:
BEDFORD CITY SCHOOLS - BEDFORD PRIMARY SCHOOL (807 COLLEGE STREET in BEDFORD, VA)
AIR MINOR (AIRS/AFS) STATE MASTER (Virginia pollutants databases) - CEDS-30192, AIR PROGRAM (Geographic Names Information System) (National Center for Education Statistics) - STATE ID-0101200 Business SIC and NAICS classification: ELEMENTARY AND SECONDARY SCHOOLS Organizations: BEDFORD COUNTY PUBLIC SCHOOLS (SCHOOL DISTRICT)
BEDFORD COUNTY SCHOOLS - LIBERTY HIGH SCHOOL (100 MINUTE MAN DR in BEDFORD, VA)
AIR MINOR (AIRS/AFS) AIR MONITORING SITE (Airborne pollution emission tracking) STATE MASTER (Virginia pollutants databases) - CEDS-30323, AIR PROGRAM (National Center for Education Statistics) - STATE ID-0101180 Business SIC and NAICS classification: ELEMENTARY AND SECONDARY SCHOOLS Organizations: BEDFORD COUNTY PUBLIC SCHOOLS (SCHOOL DISTRICT)
BEDFORD CITY SCHOOLS - BEDFORD MIDDLE SCHOOL (503 LONGWOOD AVENUE in BEDFORD, VA)
AIR MINOR (AIRS/AFS) STATE MASTER (Virginia pollutants databases) - CEDS-30191, AIR PROGRAM (National Center for Education Statistics) - STATE ID-0100490 Business SIC and NAICS classification: ELEMENTARY AND SECONDARY SCHOOLS Organizations: BEDFORD COUNTY PUBLIC SCHOOLS (SCHOOL DISTRICT)
BEDFORD CO - BODY CAMP ELEMENTARY (1051 ELEMENTARY WAY in BEDFORD, VA)
AIR MINOR (AIRS/AFS) STATE MASTER (Virginia pollutants databases) - CEDS-30203, AIR PROGRAM National Pollutant Discharge Elimination System NON-MAJOR (Tracking pollutant discharge elimination systems) - permit Business SIC classification: SEWERAGE SYSTEMS; ELEMENTARY AND SECONDARY SCHOOLS Business NAICS classification: ELEMENTARY AND SECONDARY SCHOOLS. Organizations: BEDFORD COUNTY SCHOOLS - BODY (CONTACT/OWNER)
Alternative names: BEDFORD COUNTY SCHOOLS - BODY, BODY CAMP ELEMENTARY SCHOOL
BEDFORD CO - BEDFORD SCIENCE AND TECH (600 EDMOND STREET in BEDFORD, VA)
AIR MINOR (AIRS/AFS) STATE MASTER (Virginia pollutants databases) - CEDS-30393, AIR PROGRAM Conditionally Exempt Small Quantity Generators, less than 100 kg/month of hazardous waste (Resource Conservation and Recovery Act (tracking hazardous waste)) Business SIC and NAICS classification: ELEMENTARY AND SECONDARY SCHOOLS Organizations: OPERNAME (CONTACT/OPERATOR)
Alternative names: BEDFORD COuntY EDUCATIONAL CENTER, BEDFORD EDUCATIONAL CENTER
BEDFORD READY MIX (802 RAILROAD AVENUE in BEDFORD, VA)
AIR MINOR (AIRS/AFS) STATE MASTER (Virginia pollutants databases) - CEDS-30007, AIR PROGRAM ENFORCEMENT/COMPLIANCE ACTIVITY (Integrated Compliance Information System) Business SIC classification: READY-MIXED CONCRETE Business NAICS classification: READY-MIX CONCRETE MANUFACTURING. Alternative names: BEDFORD READY MIX CONCRETE CO, LYNCHBURG REDI-MIX
AMOCO OIL CO BEDFORD (828 MACON STREET in BEDFORD, VA)
AIR MINOR (AIRS/AFS) STATE MASTER (Virginia pollutants databases) - CEDS-30331, AIR PROGRAM CRITERIA AND HAZARDOUS AIR POLLUTANT INVENTORY (Inventory of air pollution sources) Business SIC and NAICS classification: PETROLEUM BULK STATIONS AND TERMINALS
BEDFORD MANUFACTURING COMPANY (1556 DAWN DRIVE in BEDFORD, VA)
AIR MINOR (AIRS/AFS) STATE MASTER (Virginia pollutants databases) - CEDS-30598, AIR PROGRAM Business SIC classification: WOOD HOUSEHOLD FURNITURE, EXCEPT UPHOLSTERED Business NAICS classification: NONUPHOLSTERED WOOD HOUSEHOLD FURNITURE MANUFACTURING.
BUNKER HILL FOODS INCORPORATED (3678 MONETA ROAD in BEDFORD, VA)
AIR MINOR (AIRS/AFS) STATE MASTER (Virginia pollutants databases) - CEDS-30373, AIR PROGRAM Business SIC classification: SAUSAGES AND OTHER PREPARED MEAT PRODUCTS Business NAICS classification: MEAT PROCESSED FROM CARCASSES.
CARDER THARP FUNERAL HOME (320 NORTH BRIDGE STREET in BEDFORD, VA)
AIR MINOR (AIRS/AFS) STATE MASTER (Virginia pollutants databases) - CEDS-30789, AIR PROGRAM Business SIC classification: FUNERAL SERVICE AND CREMATORIES Business NAICS classification: FUNERAL HOMES AND FUNERAL SERVICES.
CARILION BEDFORD MEMORIAL HOSPITAL (1613 OAKWOOD ST in BEDFORD, VA)
AIR MINOR (AIRS/AFS) STATE MASTER (Virginia pollutants databases) - CEDS-30580, AIR PROGRAM CRITERIA AND HAZARDOUS AIR POLLUTANT INVENTORY (Inventory of air pollution sources) Business SIC and NAICS classification: GENERAL MEDICAL AND SURGICAL HOSPITALS Alternative names: BEDFORD CO MEMORIAL HOSPITAL
BEDFORD WEAVING MILLS INC (1211 MONROE STREET in BEDFORD, VA)
AIR MINOR (AIRS/AFS) STATE MASTER (Virginia pollutants databases) - CEDS-30634, AIR PROGRAM Business SIC classification: NARROW FABRIC AND OTHER SMALLWARES MILLS: COTTON, WOOL, SILK, AND MANMADE FIBER Business NAICS classification: NARROW FABRIC MILLS.
BONDTEX INC (1113 MONROE STREET in BEDFORD, VA)
AIR MINOR (AIRS/AFS) STATE MASTER (Virginia pollutants databases) - CEDS-30292, AIR PROGRAM Business SIC classification: FABRICATED RUBBER PRODUCTS Business NAICS classification: ALL OTHER RUBBER PRODUCT MANUFACTURING.
Housing units lacking complete plumbing facilities: 2.2% Housing units lacking complete kitchen facilities: 3.7%
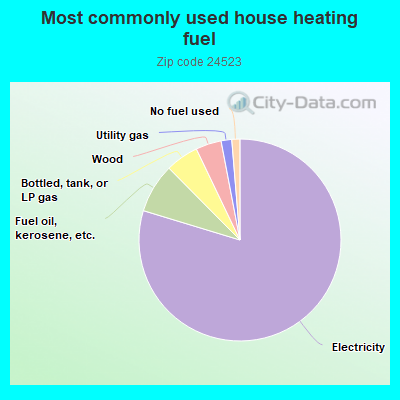
79.7%Electricity
7.9%Fuel oil, kerosene, etc.
5.3%Bottled, tank, or LP gas
4.1%Wood
1.7%Utility gas
1.3%No fuel used
Population in 1990: 16,245. Population change in the 1990s: +1,779 (+11.0%).
Place of birth for U.S.-born residents:
This state: 14,760
Northeast: 1,762
Midwest: 1,060
South: 2,201
West: 605
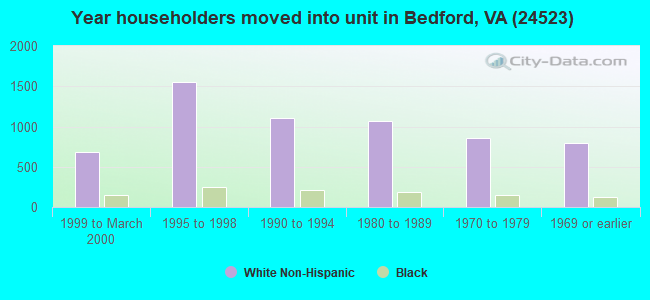
64% of the 24523 zip code residents lived in the same house 5 years ago. Out of people who lived in different houses, 34% lived in this county. Out of people who lived in different counties, 50% lived in Virginia.
91% of the 24523 zip code residents lived in the same house 1 year ago. Out of people who lived in different houses, 51% moved from this county. Out of people who lived in different houses, 38% moved from different county within same state. Out of people who lived in different houses, 10% moved from different state.
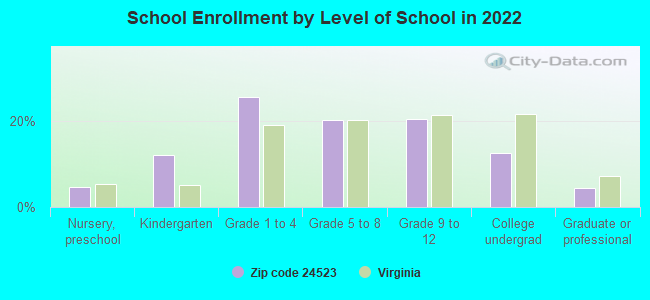
Private vs. public school enrollment:
Students in private schools in grades 1 to 8 (elementary and middle school): 388
Here:
18.8%
Virginia:
13.2%
Students in private schools in grades 9 to 12 (high school): 243
Here:
26.9%
Virginia:
10.2%
Students in private undergraduate colleges: 128
Here:
23.1%
Virginia:
18.7%
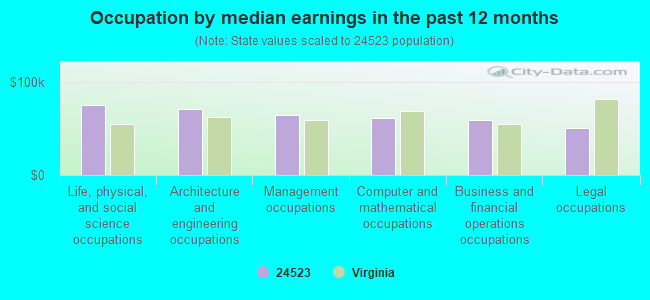
Occupation by median earnings in the past 12 months ($)
75,187Life, physical, and social science occupations
70,374Architecture and engineering occupations
64,116Management occupations
60,873Computer and mathematical occupations
58,556Business and financial operations occupations
49,839Legal occupations
Companies with federal contracts located in this zip code:
CAGAS PRECISION & RESEARCH COR (1193 YARROW ROAD in BEDFORD, VA; small business) : $573,423 in 7 contractsfrom 2000 to 2005
Contracts for Aircraft Landing Gear Components, Aircraft Hydraulic, Vacuum, and De-icing System Components, Miscellaneous Aircraft Accessories and Components by Air Force, Defense Logistics Agency Signed by year:2000: $29,260; 2001: $28,224; 2002: $321,737; 2003: $0; 2004: $0; 2005: $194,202; 2006: $0.
Biggest contracts:
$321,737 with Air Force for Aircraft Landing Gear Components. Signed on 2002-09-05. Completion date: 2003-12-31.
$125,904, same as above.Signed on 2005-03-23. Completion date: 2006-03-31.
$29,260, same as above.Signed on 2000-02-15. Completion date: 2000-03-15.
$28,224 with Defense Logistics Agency for Aircraft Hydraulic, Vacuum, and De-icing System Components. Signed on 2001-04-23. Completion date: 2001-10-20.
Top industries in this zip code by the number of employees in 2005:
2002 - 2018 National Fire Incident Reporting System (NFIRS) incidents
Based on the data from the years 2002 - 2018 the average number of fire incidents per year is 119. The highest number of reported fire incidents - 184 took place in 2007, and the least - 55 in 2002. The data has an increasing trend.
When looking into fire subcategories, the most reports belonged to: Structure Fires (54.7%), and Outside Fires (31.5%).
Fire incident types reported to NFIRS in Zip Code 24523


 Nearest zip codes: 24570, 24556, 24174, 24122, 24551, 24104.
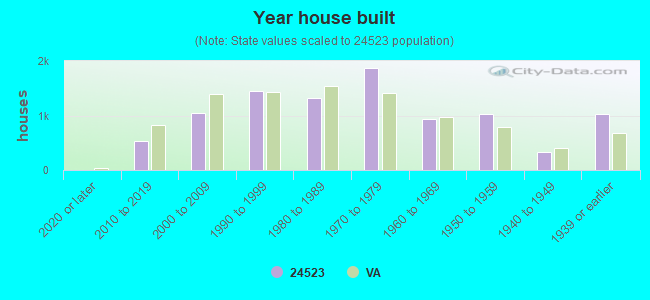


 Based on the data from the years 2002 - 2018 the average number of fire incidents per year is 119. The highest number of reported fire incidents - 184 took place in 2007, and the least - 55 in 2002. The data has an increasing trend.
 When looking into fire subcategories, the most reports belonged to: Structure Fires (54.7%), and Outside Fires (31.5%).