Estimated zip code population in 2022: 22,675 Zip code population in 2010: 21,902 Zip code population in 2000: 19,575
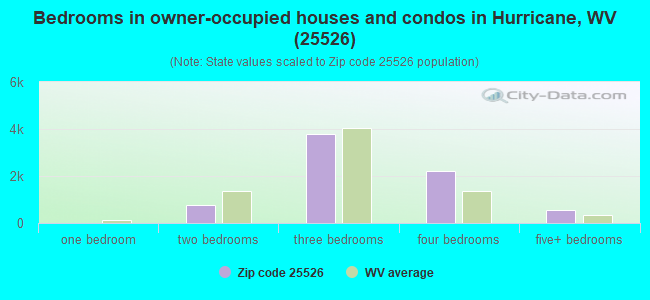
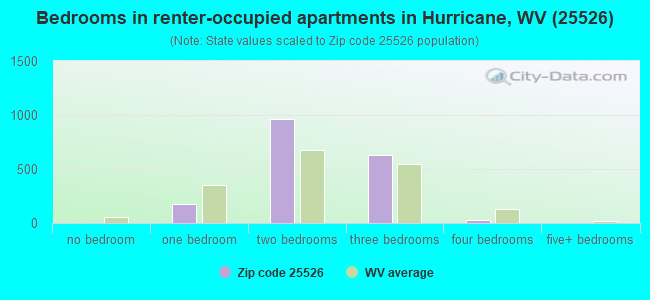
Houses and condos: 9,852 Renter-occupied apartments: 1,806
% of renters here:
20%
State:
26%
March 2022 cost of living index in zip code 25526: 86.1 (less than average, U.S. average is 100)
Land area: 91.9 sq. mi. Water area: 0.3 sq. mi.
Population density: 247 people per square mile
(very low).
OSM Map
General Map
Google Map
MSN Map
OSM Map
General Map
Google Map
MSN Map
OSM Map
General Map
Google Map
MSN Map
OSM Map
General Map
Google Map
MSN Map
Please wait while loading the map...
Real estate property taxes paid for housing units in 2022:
This zip code:
0.6% ($1,384)
West Virginia:
0.5% ($821)
Median real estate property taxes paid for housing units with mortgages in 2022: $1,604 (0.6%) Median real estate property taxes paid for housing units with no mortgage in 2022: $1,025 (0.6%)
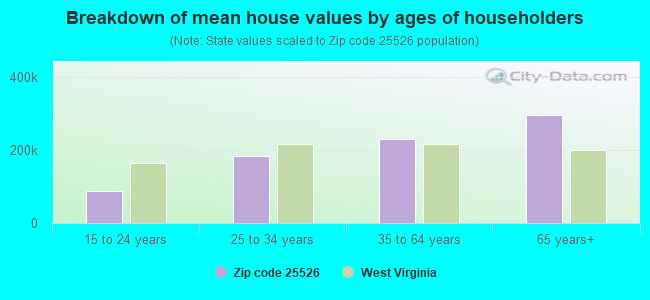
Estimated median house/condo value in 2022: $237,650
25526:
$237,650
West Virginia:
$155,100
According to our research of West Virginia and other state lists, there were 24 registered sex offenders living in 25526 zip code as of April 27, 2024. The ratio of all residents to sex offenders in zip code 25526 is 962 to 1. The ratio of registered sex offenders to all residents in this zip code is much lower than the state average.
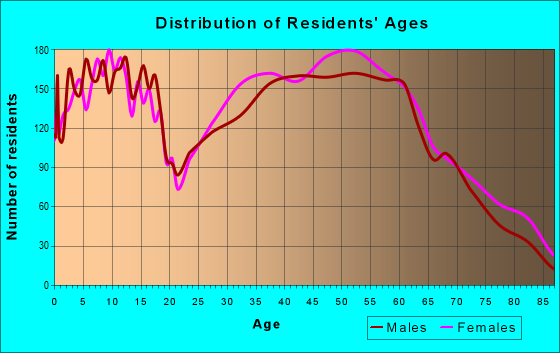
Median resident age:
This zip code:
39.8 years
West Virginia median age:
42.9 years
Average household size:
This zip code:
2.5 people
West Virginia:
2.3 people
Averages for the 2020 tax year for zip code 25526, filed in 2021:
Average Adjusted Gross Income (AGI) in 2020: $73,534 (Individual Income Tax Returns)
Here:
$73,534
State:
$56,292
Salary/wage: $64,689 (reported on 81.1% of returns)
Here:
$64,689
State:
$49,093
(% of AGI for various income ranges: 1018.8% for AGIs below $25k, 3165.3% for AGIs $25k-50k, 5926.5% for AGIs $50k-75k, 8639.8% for AGIs $75k-100k, 16298.6% for AGIs $100k-200k, 61334.0% for AGIs over 200k)
Taxable interest for individuals: $1,423 (reported on 30.7% of returns)
This zip code:
$1,423
West Virginia:
$1,141
(% of AGI for various income ranges: 18.3% for AGIs below $25k, 29.5% for AGIs $25k-50k, 73.5% for AGIs $50k-75k, 59.9% for AGIs $75k-100k, 100.7% for AGIs $100k-200k, 503.0% for AGIs over 200k)
Ordinary dividends: $4,507 (reported on 16.8% of returns)
Here:
$4,507
State:
$5,456
(% of AGI for various income ranges: 12.2% for AGIs below $25k, 30.9% for AGIs $25k-50k, 91.3% for AGIs $50k-75k, 88.1% for AGIs $75k-100k, 195.2% for AGIs $100k-200k, 1395.5% for AGIs over 200k)
Net capital gain/loss in AGI: +$10,400 (reported on 13.9% of returns)
Here:
+$10,400
State:
+$11,656
(% of AGI for various income ranges: 6.1% for AGIs below $25k, 20.8% for AGIs $25k-50k, 62.9% for AGIs $50k-75k, 64.1% for AGIs $75k-100k, 268.3% for AGIs $100k-200k, 4831.5% for AGIs over 200k)
Profit/loss from business: +$17,094 (reported on 11.5% of returns)
Here:
+$17,094
State:
+$12,084
(% of AGI for various income ranges: 77.0% for AGIs below $25k, 100.2% for AGIs $25k-50k, 112.3% for AGIs $50k-75k, 152.1% for AGIs $75k-100k, 460.5% for AGIs $100k-200k, 4208.5% for AGIs over 200k)
Taxable individual retirement arrangement distribution: $18,025 (reported on 10.5% of returns)
25526:
$18,025
West Virginia:
$15,311
(% of AGI for various income ranges: 60.3% for AGIs below $25k, 132.3% for AGIs $25k-50k, 229.8% for AGIs $50k-75k, 378.5% for AGIs $75k-100k, 569.1% for AGIs $100k-200k, 1582.0% for AGIs over 200k)
Self-employed (Keogh) retirement plans: $27,200 (reported on 0.7% of returns)
25526:
$27,200
West Virginia:
$27,405
(% of AGI for various income ranges: 952.0% for AGIs over 200k)
Total itemized deductions: $31,200 (reported on 6.4% of returns)
Here:
$31,200
State:
$31,950
(% of AGI for various income ranges: 69.4% for AGIs $25k-50k, 107.0% for AGIs $50k-75k, 266.1% for AGIs $75k-100k, 597.5% for AGIs $100k-200k, 4171.0% for AGIs over 200k)
Charity contributions: $10,633 (reported on 5.2% of returns)
Here:
$10,633
State:
$12,364
(% of AGI for various income ranges: 4.2% for AGIs $25k-50k, 24.5% for AGIs $50k-75k, 51.6% for AGIs $75k-100k, 184.6% for AGIs $100k-200k, 1284.5% for AGIs over 200k)
Taxes paid: $8,184 (reported on 6.3% of returns)
25526:
$8,184
State:
$7,665
(% of AGI for various income ranges: 9.4% for AGIs $25k-50k, 24.2% for AGIs $50k-75k, 70.8% for AGIs $75k-100k, 182.8% for AGIs $100k-200k, 989.5% for AGIs over 200k)
Earned income credit: $2,292 (reported on 12.6% of returns)
Here:
$2,292
State:
$2,258
(% of AGI for various income ranges: 78.1% for AGIs below $25k, 65.1% for AGIs $25k-50k, 1.1% for AGIs $50k-75k)
Percentage of individuals using paid preparers for their 2020 taxes: 93.3%
Here:
93%
State:
93%
(% for various income ranges: 93.5% for AGIs below $25k, 93.8% for AGIs $25k-50k, 92.1% for AGIs $50k-75k, 94.5% for AGIs $75k-100k, 93.0% for AGIs $100k-200k, 92.6% for AGIs over 200k)
Averages for the 2012 tax year for zip code 25526, filed in 2013:
Average Adjusted Gross Income (AGI) in 2012: $65,223 (Individual Income Tax Returns)
Here:
$65,223
State:
$48,628
Salary/wage: $57,108 (reported on 85.3% of returns)
Here:
$57,108
State:
$42,328
(% of AGI for various income ranges: 73.5% for AGIs below $25k, 76.2% for AGIs $25k-50k, 76.7% for AGIs $50k-75k, 79.1% for AGIs $75k-100k, 80.6% for AGIs $100k-200k, 61.2% for AGIs over 200k)
Taxable interest for individuals: $1,452 (reported on 35.9% of returns)
This zip code:
$1,452
West Virginia:
$1,211
(% of AGI for various income ranges: 1.8% for AGIs below $25k, 0.9% for AGIs $25k-50k, 0.8% for AGIs $50k-75k, 0.6% for AGIs $75k-100k, 0.6% for AGIs $100k-200k, 0.8% for AGIs over 200k)
Ordinary dividends: $3,996 (reported on 18.3% of returns)
Here:
$3,996
State:
$4,262
(% of AGI for various income ranges: 1.5% for AGIs below $25k, 0.7% for AGIs $25k-50k, 0.8% for AGIs $50k-75k, 0.9% for AGIs $75k-100k, 0.9% for AGIs $100k-200k, 2.0% for AGIs over 200k)
Net capital gain/loss in AGI: +$5,221 (reported on 13.5% of returns)
Here:
+$5,221
State:
+$8,875
(% of AGI for various income ranges: 0.2% for AGIs below $25k, 0.3% for AGIs $25k-50k, 0.5% for AGIs $50k-75k, 0.5% for AGIs $75k-100k, 0.7% for AGIs $100k-200k, 3.1% for AGIs over 200k)
Profit/loss from business: +$20,040 (reported on 12.1% of returns)
Here:
+$20,040
State:
+$13,636
(% of AGI for various income ranges: 3.9% for AGIs below $25k, 2.4% for AGIs $25k-50k, 2.3% for AGIs $50k-75k, 2.5% for AGIs $75k-100k, 3.0% for AGIs $100k-200k, 7.2% for AGIs over 200k)
Taxable individual retirement arrangement distribution: $15,056 (reported on 10.2% of returns)
25526:
$15,056
West Virginia:
$11,787
(% of AGI for various income ranges: 2.6% for AGIs below $25k, 2.7% for AGIs $25k-50k, 2.9% for AGIs $50k-75k, 2.5% for AGIs $75k-100k, 2.3% for AGIs $100k-200k, 1.8% for AGIs over 200k)
Self-employment retirement plans: $26,825 (reported on 0.8% of returns)
25526:
$26,825
West Virginia:
$24,483
Total itemized deductions: $22,003 (17% of AGI, reported on 32.7% of returns)
Here:
$22,003
State:
$21,148
Here:
17.3% of AGI
State:
18.1% of AGI
(% of AGI for various income ranges: 4.7% for AGIs below $25k, 6.4% for AGIs $25k-50k, 9.2% for AGIs $50k-75k, 10.9% for AGIs $75k-100k, 13.6% for AGIs $100k-200k, 12.7% for AGIs over 200k)
Charity contributions: $4,323 (reported on 24.6% of returns)
Here:
$4,323
State:
$4,508
(% of AGI for various income ranges: 0.4% for AGIs below $25k, 0.8% for AGIs $25k-50k, 1.3% for AGIs $50k-75k, 1.5% for AGIs $75k-100k, 2.1% for AGIs $100k-200k, 2.0% for AGIs over 200k)
Taxes paid: $9,202 (reported on 32.6% of returns)
25526:
$9,202
State:
$8,103
(% of AGI for various income ranges: 0.6% for AGIs below $25k, 1.4% for AGIs $25k-50k, 2.6% for AGIs $50k-75k, 3.6% for AGIs $75k-100k, 6.0% for AGIs $100k-200k, 7.3% for AGIs over 200k)
Earned income credit: $2,116 (reported on 14.2% of returns)
Here:
$2,116
State:
$2,140
(% of AGI for various income ranges: 5.5% for AGIs below $25k, 1.1% for AGIs $25k-50k)
Percentage of individuals using paid preparers for their 2012 taxes: 46.8%
Here:
47%
State:
49%
(% for various income ranges: 42.3% for AGIs below $25k, 46.3% for AGIs $25k-50k, 46.9% for AGIs $50k-75k, 46.8% for AGIs $75k-100k, 51.9% for AGIs $100k-200k, 68.4% for AGIs over 200k)
Averages for the 2004 tax year for zip code 25526, filed in 2005:
Average Adjusted Gross Income (AGI) in 2004: $52,825 (Individual Income Tax Returns)
Here:
$52,825
State:
$37,498
Salary/wage: $47,526 (reported on 87.0% of returns)
Here:
$47,526
State:
$33,645
(% of AGI for various income ranges: 98.5% for AGIs below $10k, 72.2% for AGIs $10k-25k, 81.4% for AGIs $25k-50k, 81.9% for AGIs $50k-75k, 87.0% for AGIs $75k-100k, 72.2% for AGIs over 100k)
Taxable interest for individuals: $1,623 (reported on 48.4% of returns)
This zip code:
$1,623
West Virginia:
$1,465
(% of AGI for various income ranges: 4.1% for AGIs below $10k, 3.2% for AGIs $10k-25k, 1.4% for AGIs $25k-50k, 1.4% for AGIs $50k-75k, 1.0% for AGIs $75k-100k, 1.4% for AGIs over 100k)
Taxable dividends: $1,854 (reported on 22.0% of returns)
Here:
$1,854
State:
$2,913
(% of AGI for various income ranges: 1.6% for AGIs below $10k, 1.0% for AGIs $10k-25k, 0.5% for AGIs $25k-50k, 0.6% for AGIs $50k-75k, 0.4% for AGIs $75k-100k, 1.0% for AGIs over 100k)
Net capital gain/loss: +$4,735 (reported on 16.2% of returns)
Here:
+$4,735
State:
+$6,331
(% of AGI for various income ranges: -1.6% for AGIs below $10k, 0.3% for AGIs $10k-25k, 0.2% for AGIs $25k-50k, 0.6% for AGIs $50k-75k, 0.5% for AGIs $75k-100k, 3.0% for AGIs over 100k)
Profit/loss from business: +$17,550 (reported on 14.0% of returns)
Here:
+$17,550
State:
+$11,074
(% of AGI for various income ranges: 3.7% for AGIs below $10k, 3.8% for AGIs $10k-25k, 2.5% for AGIs $25k-50k, 1.6% for AGIs $50k-75k, 2.5% for AGIs $75k-100k, 7.8% for AGIs over 100k)
IRA payment deduction: $3,222 (reported on 2.5% of returns)
25526:
$3,222
West Virginia:
$2,796
(% of AGI for various income ranges: 0.2% for AGIs $10k-25k, 0.2% for AGIs $25k-50k, 0.2% for AGIs $50k-75k, 0.2% for AGIs $75k-100k, 0.1% for AGIs over 100k)
Self-employed pension: $18,440 (reported on 1.1% of returns)
Here:
$18,440
West Virginia:
$18,181
(% of AGI for various income ranges: 0.2% for AGIs $10k-25k, 0.1% for AGIs $50k-75k, 0.9% for AGIs over 100k)
Total itemized deductions: $18,357 (18% of AGI, reported on 34.0% of returns)
Here:
$18,357
State:
$16,976
Here:
18.3% of AGI
State:
19.0% of AGI
(% of AGI for various income ranges: 6.4% for AGIs below $10k, 5.7% for AGIs $10k-25k, 8.0% for AGIs $25k-50k, 11.4% for AGIs $50k-75k, 14.2% for AGIs $75k-100k, 13.5% for AGIs over 100k)
Charity contributions deductions: $3,423 (3% of AGI, reported on 28.4% of returns)
Here:
$3,423
State:
$3,529
Here:
3.2% of AGI
State:
3.7% of AGI
(% of AGI for various income ranges: 0.5% for AGIs below $10k, 0.7% for AGIs $10k-25k, 0.9% for AGIs $25k-50k, 1.5% for AGIs $50k-75k, 2.3% for AGIs $75k-100k, 2.3% for AGIs over 100k)
Total tax: $8,397 (reported on 77.4% of returns)
25526:
$8,397
State:
$5,372
(% of AGI for various income ranges: 2.0% for AGIs below $10k, 3.8% for AGIs $10k-25k, 6.8% for AGIs $25k-50k, 8.7% for AGIs $50k-75k, 10.4% for AGIs $75k-100k, 18.3% for AGIs over 100k)
Earned income credit: $1,697 (reported on 12.5% of returns)
Here:
$1,697
State:
$1,662
Percentage of individuals using paid preparers for their 2004 taxes: 50.7%
Here:
51%
State:
55%
(% for various income ranges: 42.9% for AGIs below $10k, 51.2% for AGIs $10k-25k, 54.1% for AGIs $25k-50k, 52.8% for AGIs $50k-75k, 48.6% for AGIs $75k-100k, 54.8% for AGIs over 100k)
Likely homosexual households (counted as self-reported same-sex unmarried-partner households)
Lesbian couples: 0.1% of all households
Gay men: 0.0% of all households
Household received Food Stamps/SNAP in the past 12 months: 1,084 Household did not receive Food Stamps/SNAP in the past 12 months: 7,950
Women who had a birth in the past 12 months: 450 (286 now married, 164 unmarried) Women who did not have a birth in the past 12 months: 4,992 (2,167 now married, 2,825 unmarried)
Housing units in zip code 25526 with a mortgage: 4,285 (309 second mortgage, 14 home equity loan, 279 both second mortgage and home equity loan) Houses without a mortgage: 20
Median monthly owner costs for units with a mortgage: $1,522 Median monthly owner costs for units without a mortgage: $462
Residents with income below the poverty level in 2022:
This zip code:
9.7%
Whole state:
17.9%
Residents with income below 50% of the poverty level in 2022:
This zip code:
4.7%
Whole state:
9.7%
Median number of rooms in houses and condos:
Here:
7.1
State:
6.5
Median number of rooms in apartments:
Here:
4.3
State:
4.7
Notable locations in this zip code not listed on our city pages
Notable locations in zip code 25526: Sleepy Hollow Golf Course (A), Kanawha County Emergency Ambulance Authority Station 542 (B), Teays Valley Volunteer Fire Department Station 1 (C), Hurricane Volunteer Fire Department (D), Hurricane City Hall (E). Display/hide their locations on the map
Shopping Centers: Hurricane Plaza Shopping Center (1), Liberty Square Shopping Center (2), Putnam Village Shopping Center (3). Display/hide their locations on the map
Churches in zip code 25526 include: Johnsotons Church (A), Sycamore Church (B), Spring Creek Church (C), Bethel Church (D), Big Creek Church (E), Mount Moriah Church (F), Mount Olive Church (G), Mount Salem Church (H), Mount Vernon Church (I). Display/hide their locations on the map
Cemeteries: Sycamore Cemetery (1), Bird Cemetery (2), Valley View Cemetery (3), Burton Cemetery (4), Mount Vernon Cemetery (5), Mount Olive Cemetery (6), Mount Moriah Cemetery (7). Display/hide their locations on the map
Lakes and reservoirs: Lake Washington (A), Oakwood Lake (B), Teays Valley Lakes (C), I-64 Lake (D), Hurricane Lake (E). Display/hide their locations on the map
Streams, rivers, and creeks: Turkey Creek (A), Trace Fork (B), Tackett Branch (C), Sycamore Creek (D), Sugar Branch (E), Snag Creek (F), Sleepy Creek (G), Second Branch (H), Sams Fork (I). Display/hide their locations on the map
In group quarters: 169 (-1 institutionalized population)
Size of family households: 3,195 2-persons, 1,352 3-persons, 1,354 4-persons, 413 5-persons, 116 6-persons, 94 7-or-more-persons
Size of nonfamily households: 1,955 1-person, 584 2-persons
3,037 married couples with children.
1,329 single-parent households (346 men, 983 women).
97.7% of residents of 25526 zip code speak English at home.
0.8% of residents speak Spanish at home (61% very well, 39% not well).
0.7% of residents speak other Indo-European language at home (74% very well, 26% not well).
0.5% of residents speak Asian or Pacific Island language at home (18% very well, 76% well, 6% not well).
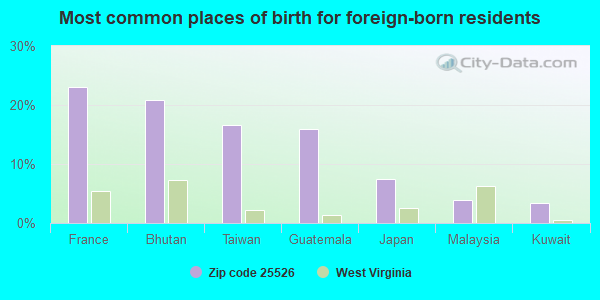
Foreign born population: 426 (1.9%) (56.6% of them are naturalized citizens)
This zip code:
1.9%
Whole state:
1.8%
23%France
21%Bhutan
17%Taiwan
16%Guatemala
7%Japan
4%Malaysia
3%Kuwait
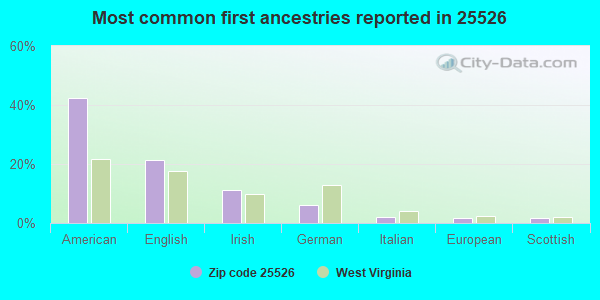
42%American
21%English
11%Irish
6%German
2%Italian
2%European
2%Scottish
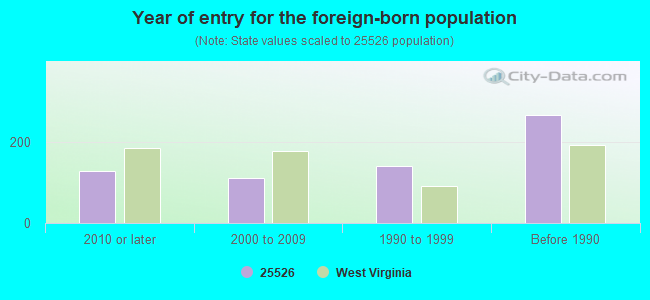
Year of entry for the foreign-born population
1292010 or later
1122000 to 2009
1401990 to 1999
266Before 1990
Major facilities with environmental interests located in this zip code:
CITY OF HURRICANE (PEACH RIDGE ROAD in HURRICANE, WV)
(Integrated Compliance Information System) - ICIS-03-1987-0080, FORMAL ENFORCEMENT ACTION National Pollutant Discharge Elimination System MAJOR (Tracking pollutant discharge elimination systems) - permit National Pollutant Discharge Elimination System NON-MAJOR (Tracking pollutant discharge elimination systems) - permit Business SIC classification: PETROLEUM REFINING; SEWERAGE SYSTEMS Alternative names: HURRICANE CITY OF
CONNER STREET ELEMENTARY SCHOOL (445 CONNER ST. in HURRICANE, WV)
(Geographic Names Information System) ENFORCEMENT/COMPLIANCE ACTIVITY (Integrated Compliance Information System) (National Center for Education Statistics) - STATE ID-72215 Organizations: PUTNAM COUNTY SCHOOL DISTRICT (SCHOOL DISTRICT)
APPALACHIAN REBUILDERS (2542 US ROUTE 60 in HURRICANE, WV)
(Resource Conservation and Recovery Act (tracking hazardous waste)) Conditionally Exempt Small Quantity Generators, less than 100 kg/month of hazardous waste (Resource Conservation and Recovery Act (tracking hazardous waste)) - notification Organizations: OPERNAME (CONTACT/OPERATOR)
, MOBLEY, DAVID (CONTACT/OWNER)
, DAVID MOBLEY (CONTACT/OWNER)
DISPOSAL SERVICE, INC. (1100 STATE RTE 34 S : P.O. BOX 448 in HURRICANE, WV)
AIR MAJOR (AIRS/AFS) CRITERIA AND HAZARDOUS AIR POLLUTANT INVENTORY (Inventory of air pollution sources) (Resource Conservation and Recovery Act (tracking hazardous waste)) Business SIC classification: REFUSE SYSTEMS Business NAICS classification: SOLID WASTE LANDFILL. Organizations: OWNER (CONTACT/OWNER)
Alternative names: DISPOSAL SerViCeS INCorporated LANDFILL (DSI), DISPOSAL SVCS INCL LANDFILL (DSI)
GEORGES CLEANERS (2833 MAIN STREET in HURRICANE, WV)
AIR MINOR (AIRS/AFS) Conditionally Exempt Small Quantity Generators, less than 100 kg/month of hazardous waste (Resource Conservation and Recovery Act (tracking hazardous waste)) Business SIC classification: DRYCLEANING PLANTS, EXCEPT RUG CLEANING Organizations: OPERNAME (CONTACT/OPERATOR)
, COOK, DICK (CONTACT/OWNER)
COURTS MOTORS BODY SHOP (2354 US RTE 60 REAR BLDG in HURRICANE, WV)
(Resource Conservation and Recovery Act (tracking hazardous waste)) Small Quantity Generators, between 100 kg and 1000 kg of hazardous waste/month (Resource Conservation and Recovery Act (tracking hazardous waste)) - notification Organizations: CECIL COURTS (CONTACT/OWNER)
Alternative names: COURTS MOTORS INC
COURTS MOTORS INC (102 ORCHARD PARK DR in HURRICANE, WV)
(Resource Conservation and Recovery Act (tracking hazardous waste)) Organizations: OPERNAME (CONTACT/OPERATOR)
, ARGONAUT LEASING (CONTACT/OWNER)
Alternative names: HURRICANE CHEVROLET INC
DAVES PERFORMANCE CENTER (3053 MOUNT VERNON ROAD in HURRICANE, WV)
(Resource Conservation and Recovery Act (tracking hazardous waste)) Organizations: JAMES R VANOY SR (CONTACT/OWNER)
ADVANTAGE PLUS INC (2638 MAIN ST in HURRICANE, WV)
(Resource Conservation and Recovery Act (tracking hazardous waste)) Organizations: JACK GILKERSON (CONTACT/OWNER)
Housing units lacking complete plumbing facilities: 1.7% Housing units lacking complete kitchen facilities: 1.5%
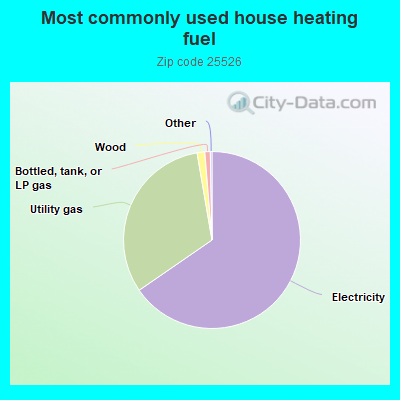
65.4%Electricity
31.9%Utility gas
1.4%Wood
1.0%Bottled, tank, or LP gas
Population in 1990: 16,250. Population change in the 1990s: +3,325 (+20.5%).
Place of birth for U.S.-born residents:
This state: 17,281
Northeast: 899
Midwest: 1,324
South: 1,955
West: 406
54% of the 25526 zip code residents lived in the same house 5 years ago. Out of people who lived in different houses, 42% lived in this county. Out of people who lived in different counties, 50% lived in West Virginia.
92% of the 25526 zip code residents lived in the same house 1 year ago. Out of people who lived in different houses, 52% moved from this county. Out of people who lived in different houses, 41% moved from different county within same state. Out of people who lived in different houses, 7% moved from different state.
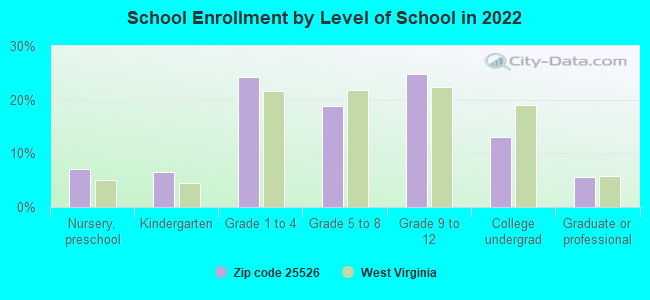
Private vs. public school enrollment:
Students in private schools in grades 1 to 8 (elementary and middle school): 393
Here:
19.3%
West Virginia:
12.2%
Students in private schools in grades 9 to 12 (high school): 94
Here:
8.2%
West Virginia:
8.8%
Students in private undergraduate colleges: 67
Here:
11.1%
West Virginia:
17.3%
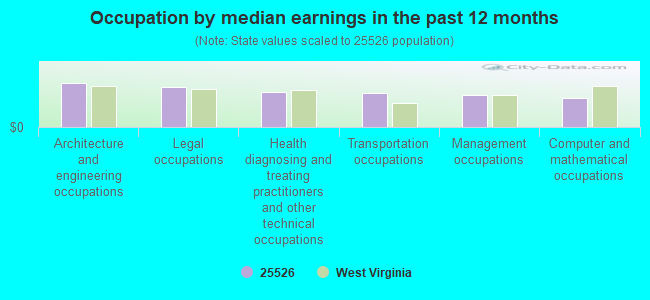
Occupation by median earnings in the past 12 months ($)
104,371Architecture and engineering occupations
93,841Legal occupations
83,405Health diagnosing and treating practitioners and other technical occupations
80,592Transportation occupations
75,140Management occupations
69,184Computer and mathematical occupations
Companies with federal contracts located in this zip code (HURRICANE, WV):
HAYSLETT CONSTRUCTION COMPANY (3707 TEAYS VALLEY RD; small business) : $3,997,197 in 10 contractsfrom 2002 to 2004
Contracts for Construction of Structures and Facilities -- Office Buildings, Construction of Structures and Facilities -- Dining Facilities by Army Signed by year:2000: $0; 2001: $0; 2002: $2,983,941; 2003: $955,825; 2004: $57,431; 2005: $0; 2006: $0.
Biggest contracts:
$2,969,000 with Army for Construction of Structures and Facilities -- Office Buildings. Signed on 2002-07-25. Completion date: 2004-01-06.
$928,000 with Army for Construction of Structures and Facilities -- Dining Facilities. Signed on 2003-08-04. Completion date: 2004-04-04.
$36,631, same as above.Signed on 2004-02-04. Completion date: 2004-04-04.
$19,947, same as above.Signed on 2004-02-17. Completion date: 2004-04-04.
N G S INC (419 HURRICANE CREEK RD) : $810,209 in 2 contractsfrom 2004 to 2005
$800,003 with Army for Lodging - Hotel/Motel. Signed on 2005-06-10. Completion date: 2005-06-13.
$10,206, same as above.Signed on 2004-10-12. Completion date: 2004-10-08.
BLUE RIDGE MACHINERY AND TOOLS (2905 PUTNAM AVE; small business) : $108,715 in 5 contractsfrom 2001 to 2005
Contracts for Electrical and Electronic assemblies, Boards, Cards, and Associated Hardware, Lathes, , Non-nuclear Ship Repair (West) Ship repair (including overhauls and conversions) performed on. non-nuclear propelled and nonpropelled ships west of the 108th meridian, and moreby Navy, Defense Logistics Agency, NASA Signed by year:2000: $0; 2001: $35,970; 2002: $0; 2003: $0; 2004: $27,750; 2005: $44,995; 2006: $0.
Biggest contracts:
$41,500 with Navy for Electrical and Electronic assemblies, Boards, Cards, and Associated Hardware. Taking place in PA. Signed on 2005-06-07. Completion date: 2005-07-08.
$35,970 with Defense Logistics Agency for Lathes. Signed on 2001-12-18. Completion date: 2002-01-22.
$13,890 with NASA for . Signed on 2004-05-24. Completion date: 2004-07-02.
$13,860 with Navy for Non-nuclear Ship Repair (West) Ship repair (including overhauls and conversions) performed on. non-nuclear propelled and nonpropelled ships west of the 108th meridian. Signed on 2004-12-08. Completion date: 2004-12-17.
NONDESTRUCTIVE INSPECTION SERV (2825 US ROUTE 60 E; small business) : $58,370 in 10 contractsfrom 2003 to 2005
Contracts for Other Quality Control, Testing and Inspection Services -- Miscellaneous, Miscellaneous Electrical and Electronic Components, Water Quality Support Services by Army, U.S. Army Corps of Engineers - civil program financing only Signed by year:2000: $0; 2001: $0; 2002: $0; 2003: $40,000; 2004: $6,080; 2005: $12,290; 2006: $0.
Biggest contracts:
$20,000 with Army for Other Quality Control, Testing and Inspection Services -- Miscellaneous. Signed on 2003-10-03. Completion date: 2003-10-03.
$20,000 with U.S. Army Corps of Engineers - civil program financing only for Other Quality Control, Testing and Inspection Services -- Miscellaneous. Signed on 2003-10-03. Completion date: 2003-10-03.
$7,500 with U.S. Army Corps of Engineers - civil program financing only for Miscellaneous Electrical and Electronic Components. Signed on 2005-09-15. Completion date: 2005-09-30.
$7,500 with Army for Miscellaneous Electrical and Electronic Components. Signed on 2005-09-15. Completion date: 2005-09-30.
R&B DISMANTLING, INC. (3752 SLEEPY HOLLOW DRIVE; small business)
$25,712 with U.S. Army Corps of Engineers - civil program financing only for Hazardous Substance Removal, Cleanup, and Disposal Services and Operational Support. Signed on 2000-06-27. Completion date: 2000-07-31.
STEPHEN HILL (4000 BENEDICT RD; small business)
$16,690 with Navy for Expert Witness. Signed on 2005-02-23. Completion date: 2005-12-31.
BAKER TRUCK EQUIPMENT CO INC (RT 60; small business)
$9,006 with Army for Truck and Tractor Attachments. Signed on 2003-11-17. Completion date: 2003-12-23.
D & M PAINTING CONTRACTORS LLC (10 BLOSSOM WAY; small business)
$8,600 with U.S. Army Corps of Engineers - civil program financing only for Maintenance, Repair or Alteration of Real Property -- Other Industrial Buildings. Taking place in OH. Signed on 2003-03-10. Completion date: 2003-02-06.
Top industries in this zip code by the number of employees in 2005:
Construction: Water and Sewer Line and Related Structures Construction (250-499 employees: 1 establishment, 20-49 employees: 1 establishment, 10-19 employees: 1 establishment, 1-4 employees: 1 establishment)
2003 - 2018 National Fire Incident Reporting System (NFIRS) incidents
Based on the data from the years 2003 - 2018 the average number of fire incidents per year is 78. The highest number of fires - 123 took place in 2007, and the least - 48 in 2003. The data has a rising trend.
When looking into fire subcategories, the most incidents belonged to: Structure Fires (50.7%), and Outside Fires (24.6%).
Fire incident types reported to NFIRS in Zip Code 25526
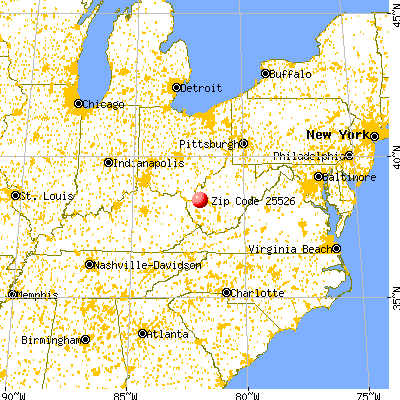


 Nearest zip codes: 25510, 25560, 25523, 25213, 25177, 25564.
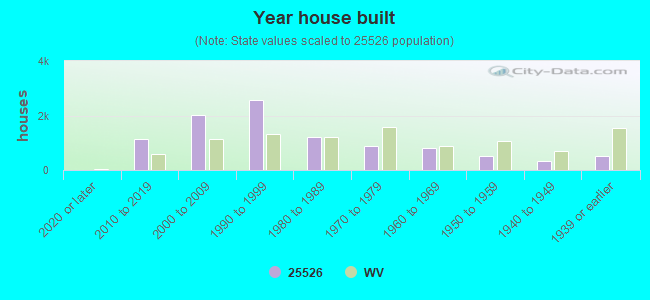


 Based on the data from the years 2003 - 2018 the average number of fire incidents per year is 78. The highest number of fires - 123 took place in 2007, and the least - 48 in 2003. The data has a rising trend.
 When looking into fire subcategories, the most incidents belonged to: Structure Fires (50.7%), and Outside Fires (24.6%).