Estimated zip code population in 2022: 22,462 Zip code population in 2010: 21,108 Zip code population in 2000: 49,668
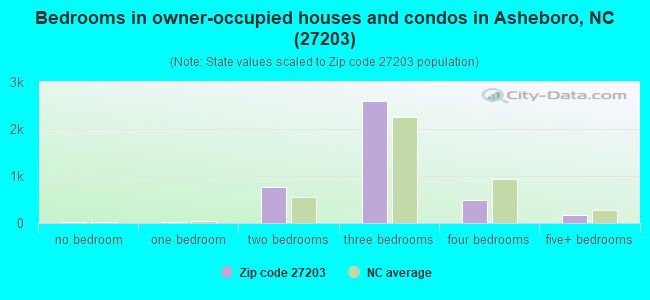
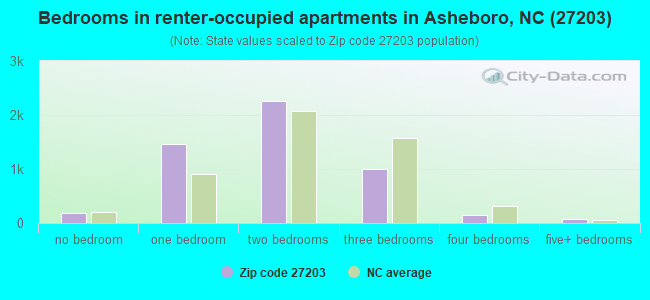
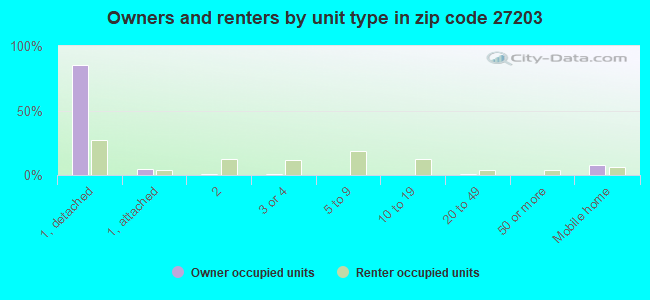
Houses and condos: 10,339 Renter-occupied apartments: 5,138
% of renters here:
56%
State:
33%
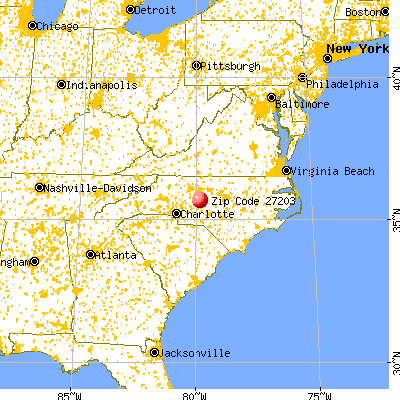
March 2022 cost of living index in zip code 27203: 90.2 (less than average, U.S. average is 100)
Land area: 21.9 sq. mi. Water area: 0.1 sq. mi.
Population density: 1,026 people per square mile
(low).
OSM Map
General Map
Google Map
MSN Map
OSM Map
General Map
Google Map
MSN Map
OSM Map
General Map
Google Map
MSN Map
OSM Map
General Map
Google Map
MSN Map
Please wait while loading the map...
Real estate property taxes paid for housing units in 2022:
This zip code:
0.9% ($1,420)
North Carolina:
0.6% ($1,769)
Median real estate property taxes paid for housing units with mortgages in 2022: $1,361 (0.8%) Median real estate property taxes paid for housing units with no mortgage in 2022: $1,516 (1.1%)
Estimated median house/condo value in 2022: $160,428
27203:
$160,428
North Carolina:
$280,600
According to our research of North Carolina and other state lists, there were 46 registered sex offenders living in 27203 zip code as of April 26, 2024. The ratio of all residents to sex offenders in zip code 27203 is 480 to 1. The ratio of registered sex offenders to all residents in this zip code is near the state average.
Median resident age:
This zip code:
35.0 years
North Carolina median age:
39.2 years
Average household size:
This zip code:
2.4 people
North Carolina:
2.4 people
Averages for the 2020 tax year for zip code 27203, filed in 2021:
Average Adjusted Gross Income (AGI) in 2020: $36,865 (Individual Income Tax Returns)
Here:
$36,865
State:
$70,020
Salary/wage: $33,837 (reported on 84.9% of returns)
Here:
$33,837
State:
$58,387
(% of AGI for various income ranges: 1310.7% for AGIs below $25k, 3782.5% for AGIs $25k-50k, 6939.2% for AGIs $50k-75k, 10383.3% for AGIs $75k-100k, 16198.6% for AGIs $100k-200k)
Taxable interest for individuals: $816 (reported on 17.7% of returns)
This zip code:
$816
North Carolina:
$1,479
(% of AGI for various income ranges: 8.2% for AGIs below $25k, 11.9% for AGIs $25k-50k, 35.7% for AGIs $50k-75k, 42.7% for AGIs $75k-100k, 102.7% for AGIs $100k-200k)
Ordinary dividends: $4,417 (reported on 6.9% of returns)
Here:
$4,417
State:
$7,888
(% of AGI for various income ranges: 9.0% for AGIs below $25k, 15.9% for AGIs $25k-50k, 65.1% for AGIs $50k-75k, 183.0% for AGIs $75k-100k, 342.3% for AGIs $100k-200k)
Net capital gain/loss in AGI: +$5,997 (reported on 6.9% of returns)
Here:
+$5,997
State:
+$23,652
(% of AGI for various income ranges: 2.6% for AGIs below $25k, 7.8% for AGIs $25k-50k, 75.7% for AGIs $50k-75k, 87.3% for AGIs $75k-100k, 465.5% for AGIs $100k-200k)
Profit/loss from business: +$7,801 (reported on 14.7% of returns)
Here:
+$7,801
State:
+$11,710
(% of AGI for various income ranges: 112.4% for AGIs below $25k, 103.5% for AGIs $25k-50k, 127.8% for AGIs $50k-75k, 362.7% for AGIs $75k-100k, 1110.0% for AGIs $100k-200k)
Taxable individual retirement arrangement distribution: $13,400 (reported on 6.2% of returns)
27203:
$13,400
North Carolina:
$20,247
(% of AGI for various income ranges: 40.8% for AGIs below $25k, 62.9% for AGIs $25k-50k, 190.4% for AGIs $50k-75k, 311.3% for AGIs $75k-100k, 1132.7% for AGIs $100k-200k)
Total itemized deductions: $28,606 (reported on 1.9% of returns)
Here:
$28,606
State:
$34,549
(% of AGI for various income ranges: 36.8% for AGIs $25k-50k, 115.4% for AGIs $50k-75k, 246.3% for AGIs $75k-100k, 705.0% for AGIs $100k-200k)
Charity contributions: $12,873 (reported on 1.6% of returns)
Here:
$12,873
State:
$13,360
(% of AGI for various income ranges: 9.1% for AGIs $25k-50k, 52.9% for AGIs $50k-75k, 283.6% for AGIs $100k-200k)
Taxes paid: $6,428 (reported on 1.9% of returns)
27203:
$6,428
State:
$7,586
(% of AGI for various income ranges: 4.8% for AGIs $25k-50k, 25.4% for AGIs $50k-75k, 71.3% for AGIs $75k-100k, 187.7% for AGIs $100k-200k)
Earned income credit: $2,507 (reported on 27.1% of returns)
Here:
$2,507
State:
$2,337
(% of AGI for various income ranges: 125.9% for AGIs below $25k, 90.0% for AGIs $25k-50k, 2.2% for AGIs $50k-75k)
Percentage of individuals using paid preparers for their 2020 taxes: 91.4%
Here:
91%
State:
93%
(% for various income ranges: 90.0% for AGIs below $25k, 92.6% for AGIs $25k-50k, 91.7% for AGIs $50k-75k, 93.5% for AGIs $75k-100k, 92.3% for AGIs $100k-200k, 100.0% for AGIs over 200k)
Averages for the 2012 tax year for zip code 27203, filed in 2013:
Average Adjusted Gross Income (AGI) in 2012: $32,414 (Individual Income Tax Returns)
Here:
$32,414
State:
$54,937
Salary/wage: $28,357 (reported on 86.8% of returns)
Here:
$28,357
State:
$46,336
(% of AGI for various income ranges: 82.0% for AGIs below $25k, 87.5% for AGIs $25k-50k, 76.7% for AGIs $50k-75k, 73.0% for AGIs $75k-100k, 63.3% for AGIs $100k-200k, 29.6% for AGIs over 200k)
Taxable interest for individuals: $1,131 (reported on 21.4% of returns)
This zip code:
$1,131
North Carolina:
$1,298
(% of AGI for various income ranges: 0.7% for AGIs below $25k, 0.5% for AGIs $25k-50k, 0.7% for AGIs $50k-75k, 1.0% for AGIs $75k-100k, 1.5% for AGIs $100k-200k, 0.9% for AGIs over 200k)
Ordinary dividends: $4,377 (reported on 8.3% of returns)
Here:
$4,377
State:
$6,213
(% of AGI for various income ranges: 0.7% for AGIs below $25k, 0.5% for AGIs $25k-50k, 1.2% for AGIs $50k-75k, 1.5% for AGIs $75k-100k, 3.7% for AGIs $100k-200k)
Net capital gain/loss in AGI: +$3,929 (reported on 6.6% of returns)
Here:
+$3,929
State:
+$12,740
(% of AGI for various income ranges: 0.3% for AGIs $25k-50k, 0.2% for AGIs $50k-75k, 0.4% for AGIs $75k-100k, 2.9% for AGIs $100k-200k, 4.2% for AGIs over 200k)
Profit/loss from business: +$8,489 (reported on 13.4% of returns)
Here:
+$8,489
State:
+$10,311
(% of AGI for various income ranges: 6.9% for AGIs below $25k, 1.6% for AGIs $25k-50k, 1.9% for AGIs $50k-75k, 3.0% for AGIs $75k-100k, 6.8% for AGIs $100k-200k)
Taxable individual retirement arrangement distribution: $10,903 (reported on 8.0% of returns)
27203:
$10,903
North Carolina:
$15,575
(% of AGI for various income ranges: 2.5% for AGIs below $25k, 1.5% for AGIs $25k-50k, 3.2% for AGIs $50k-75k, 4.5% for AGIs $75k-100k, 5.4% for AGIs $100k-200k)
Total itemized deductions: $17,799 (24% of AGI, reported on 16.5% of returns)
Here:
$17,799
State:
$23,438
Here:
24.5% of AGI
State:
21.5% of AGI
(% of AGI for various income ranges: 4.5% for AGIs below $25k, 7.2% for AGIs $25k-50k, 10.4% for AGIs $50k-75k, 13.9% for AGIs $75k-100k, 14.2% for AGIs $100k-200k, 12.6% for AGIs over 200k)
Charity contributions: $4,033 (reported on 13.2% of returns)
Here:
$4,033
State:
$4,687
(% of AGI for various income ranges: 0.5% for AGIs below $25k, 1.1% for AGIs $25k-50k, 2.1% for AGIs $50k-75k, 3.0% for AGIs $75k-100k, 3.3% for AGIs $100k-200k, 1.5% for AGIs over 200k)
Taxes paid: $5,660 (reported on 16.5% of returns)
27203:
$5,660
State:
$8,823
(% of AGI for various income ranges: 0.6% for AGIs below $25k, 1.7% for AGIs $25k-50k, 3.1% for AGIs $50k-75k, 4.9% for AGIs $75k-100k, 5.9% for AGIs $100k-200k, 7.0% for AGIs over 200k)
Earned income credit: $2,537 (reported on 27.5% of returns)
Here:
$2,537
State:
$2,376
(% of AGI for various income ranges: 7.7% for AGIs below $25k, 1.2% for AGIs $25k-50k)
Percentage of individuals using paid preparers for their 2012 taxes: 61.3%
Here:
61%
State:
53%
(% for various income ranges: 61.1% for AGIs below $25k, 58.8% for AGIs $25k-50k, 61.3% for AGIs $50k-75k, 71.9% for AGIs $75k-100k, 69.2% for AGIs $100k-200k, 100.0% for AGIs over 200k)
Averages for the 2004 tax year for zip code 27203, filed in 2005:
Average Adjusted Gross Income (AGI) in 2004: $33,599 (Individual Income Tax Returns)
Here:
$33,599
State:
$45,376
Salary/wage: $30,281 (reported on 86.2% of returns)
Here:
$30,281
State:
$39,442
(% of AGI for various income ranges: 107.9% for AGIs below $10k, 82.9% for AGIs $10k-25k, 85.3% for AGIs $25k-50k, 80.7% for AGIs $50k-75k, 78.2% for AGIs $75k-100k, 55.1% for AGIs over 100k)
Taxable interest for individuals: $1,433 (reported on 34.0% of returns)
This zip code:
$1,433
North Carolina:
$1,515
(% of AGI for various income ranges: 3.8% for AGIs below $10k, 1.6% for AGIs $10k-25k, 1.1% for AGIs $25k-50k, 1.2% for AGIs $50k-75k, 1.0% for AGIs $75k-100k, 2.1% for AGIs over 100k)
Taxable dividends: $3,884 (reported on 15.7% of returns)
Here:
$3,884
State:
$4,016
(% of AGI for various income ranges: 2.4% for AGIs below $10k, 1.0% for AGIs $10k-25k, 0.8% for AGIs $25k-50k, 1.0% for AGIs $50k-75k, 1.6% for AGIs $75k-100k, 4.9% for AGIs over 100k)
Net capital gain/loss: +$7,554 (reported on 11.4% of returns)
Here:
+$7,554
State:
+$11,152
(% of AGI for various income ranges: -0.2% for AGIs below $10k, 0.2% for AGIs $10k-25k, 0.5% for AGIs $25k-50k, 1.1% for AGIs $50k-75k, 2.1% for AGIs $75k-100k, 9.7% for AGIs over 100k)
Profit/loss from business: +$10,431 (reported on 13.5% of returns)
Here:
+$10,431
State:
+$9,490
(% of AGI for various income ranges: 5.3% for AGIs below $10k, 3.6% for AGIs $10k-25k, 2.4% for AGIs $25k-50k, 2.8% for AGIs $50k-75k, 3.8% for AGIs $75k-100k, 8.7% for AGIs over 100k)
IRA payment deduction: $2,879 (reported on 2.1% of returns)
27203:
$2,879
North Carolina:
$2,967
(% of AGI for various income ranges: 0.2% for AGIs $10k-25k, 0.2% for AGIs $25k-50k, 0.2% for AGIs $50k-75k, 0.1% for AGIs $75k-100k, 0.1% for AGIs over 100k)
Self-employed pension: $15,475 (reported on 0.5% of returns)
Here:
$15,475
North Carolina:
$14,754
Total itemized deductions: $15,665 (23% of AGI, reported on 24.5% of returns)
Here:
$15,665
State:
$19,464
Here:
23.0% of AGI
State:
22.7% of AGI
(% of AGI for various income ranges: 10.1% for AGIs below $10k, 6.2% for AGIs $10k-25k, 10.2% for AGIs $25k-50k, 13.5% for AGIs $50k-75k, 15.7% for AGIs $75k-100k, 13.4% for AGIs over 100k)
Charity contributions deductions: $3,538 (5% of AGI, reported on 21.4% of returns)
Here:
$3,538
State:
$4,035
Here:
5.0% of AGI
State:
4.5% of AGI
(% of AGI for various income ranges: 0.7% for AGIs below $10k, 0.9% for AGIs $10k-25k, 1.8% for AGIs $25k-50k, 2.6% for AGIs $50k-75k, 3.4% for AGIs $75k-100k, 3.1% for AGIs over 100k)
Total tax: $4,828 (reported on 64.0% of returns)
27203:
$4,828
State:
$7,257
(% of AGI for various income ranges: 2.8% for AGIs below $10k, 3.0% for AGIs $10k-25k, 6.2% for AGIs $25k-50k, 8.8% for AGIs $50k-75k, 10.7% for AGIs $75k-100k, 19.3% for AGIs over 100k)
Earned income credit: $1,877 (reported on 21.8% of returns)
Here:
$1,877
State:
$1,851
Percentage of individuals using paid preparers for their 2004 taxes: 65.5%
Here:
66%
State:
62%
(% for various income ranges: 61.8% for AGIs below $10k, 68.2% for AGIs $10k-25k, 65.5% for AGIs $25k-50k, 63.0% for AGIs $50k-75k, 62.8% for AGIs $75k-100k, 73.6% for AGIs over 100k)
Likely homosexual households (counted as self-reported same-sex unmarried-partner households)
Lesbian couples: 0.1% of all households
Gay men: 0.0% of all households
Household received Food Stamps/SNAP in the past 12 months: 1,902 Household did not receive Food Stamps/SNAP in the past 12 months: 7,444
Women who had a birth in the past 12 months: 380 (180 now married, 193 unmarried) Women who did not have a birth in the past 12 months: 4,840 (1,819 now married, 3,016 unmarried)
Housing units in zip code 27203 with a mortgage: 2,238 (198 second mortgage, 181 both second mortgage and home equity loan) Houses without a mortgage: 57
Median monthly owner costs for units with a mortgage: $1,055 Median monthly owner costs for units without a mortgage: $445
Residents with income below the poverty level in 2022:
This zip code:
21.7%
Whole state:
12.8%
Residents with income below 50% of the poverty level in 2022:
This zip code:
12.5%
Whole state:
6.8%
Median number of rooms in houses and condos:
Here:
5.8
State:
6.4
Median number of rooms in apartments:
Here:
4.1
State:
4.4
Notable locations in this zip code not listed on our city pages
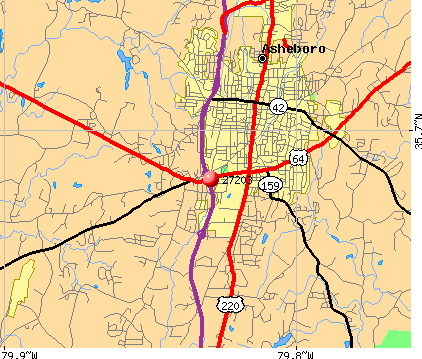
Notable locations in zip code 27203: Crossroads Center (A), Randolph County Court House (B), Asheboro City Hall (C). Display/hide their locations on the map
Shopping Centers: Randolph Mall (1), Northgate Shopping Center (2), Hillside Shopping Center (3), Hammer Village Shopping Center (4). Display/hide their locations on the map
3,167 married couples with children.
2,312 single-parent households (389 men, 1,923 women).
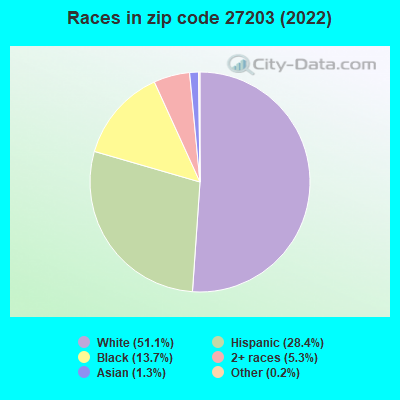
69.9% of residents of 27203 zip code speak English at home.
26.9% of residents speak Spanish at home (63% very well, 12% well, 20% not well, 4% not at all).
1.4% of residents speak other Indo-European language at home (96% very well, 4% well).
0.8% of residents speak Asian or Pacific Island language at home (47% very well, 40% well, 13% not well).
0.5% of residents speak other language at home (100% very well).
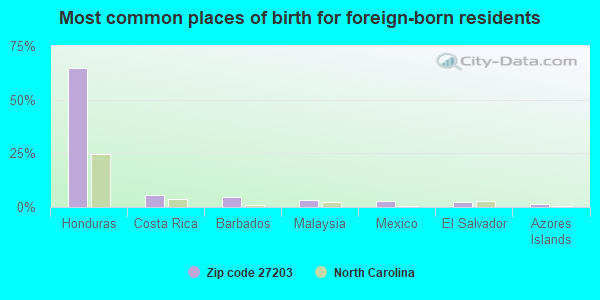
Foreign born population: 2,809 (12.5%) (25.8% of them are naturalized citizens)
Major facilities with environmental interests located in this zip code:
CENTRAL CHAIR COMPANY (277 NORTH PARK STREET in ASHEBORO, NC)
AIR MINOR (AIRS/AFS) STATE MASTER (North Carolina facility info) - -115DA4YG00NT8W64FBEMR3VHH9, WASTEWATER FACILITY, -4190, AIR PROGRAM CRITERIA AND HAZARDOUS AIR POLLUTANT INVENTORY (Inventory of air pollution sources) National Pollutant Discharge Elimination System NON-MAJOR (Tracking pollutant discharge elimination systems) - permit (Resource Conservation and Recovery Act (tracking hazardous waste)) TRI REPORTER (Tracking of toxic chemicals releasing facilities) Business SIC classification: WOOD HOUSEHOLD FURNITURE, EXCEPT UPHOLSTERED; WOOD HOUSEHOLD FURNITURE, UPHOLSTERED Business NAICS classification: NONUPHOLSTERED WOOD HOUSEHOLD FURNITURE MANUFACTURING.; NONUPHOLSTERED WOOD HOUSEHOLD FURNITURE MANUFACTURING. Organizations: JOHN CRAVEN (CONTACT/OWNER)
CHAMPAGNE DYE WORKS INCORPORATED (210 YZEX STREET in ASHEBORO, NC)
AIR MINOR (AIRS/AFS) STATE MASTER (North Carolina facility info) - UNDERGROUND STORAGE TANK PROGRAM STATE MASTER (North Carolina facility info) - AIR PROGRAM CRITERIA AND HAZARDOUS AIR POLLUTANT INVENTORY (Inventory of air pollution sources) TRI REPORTER (Tracking of toxic chemicals releasing facilities) Business SIC classification: WEFT KNIT FABRIC MILLS; FINISHERS OF TEXTILES; NONCLASSIFIABLE ESTABLISHMENTS Business NAICS classification: WEFT KNIT FABRIC MILLS.; WEFT KNIT FABRIC MILLS. Alternative names: CHAMPAGNE DYE WORKSINC, NYLON DYE WORKS, LLC.
BOSSONG HOSIERY MILLS (840 WEST SALISBURY STREET in ASHEBORO, NC)
AIR SYNTHETIC MINOR (AIRS/AFS) STATE MASTER (North Carolina facility info) - UNDERGROUND STORAGE TANK PROGRAM STATE MASTER (North Carolina facility info) - AIR PROGRAM CRITERIA AND HAZARDOUS AIR POLLUTANT INVENTORY (Inventory of air pollution sources) Business SIC classification: HOSIERY; NONCLASSIFIABLE ESTABLISHMENTS Business NAICS classification: SHEER HOSIERY MILLS.; SHEER HOSIERY MILLS. Alternative names: BOSSONG HOSIERY MILLS INC
CITY OF ASHEBORO (1032 BONKEMEYER AVENUE in ASHEBORO, NC)
AIR MINOR (AIRS/AFS) STATE MASTER (North Carolina facility info) - AIR PROGRAM STATE MASTER (North Carolina facility info) - UNDERGROUND STORAGE TANK PROGRAM, -115DA4YG00M29W84AY3VR36JR7, WASTEWATER FACILITY, -750, HAZARDOUS WASTE PROGRAM Business SIC classification: SEWERAGE SYSTEMS; NONCLASSIFIABLE ESTABLISHMENTS Alternative names: CITY OF ASHEBORO WASTE TREATMENT PLANT, CITY OF ASHEBORO WASTEWATER TREATMENT PLANT
ARROW INTERNATIONAL INCORPORATED (312 COMMERCE PLACE in ASHEBORO, NC)
AIR MINOR (AIRS/AFS) ENFORCEMENT/COMPLIANCE ACTIVITY (Integrated Compliance Information System) STATE MASTER (North Carolina facility info) - AIR PROGRAM, HAZARDOUS WASTE PROGRAM, -3M05FMYG00RPTWM4CAQBRFW18M, WASTEWATER FACILITY CRITERIA AND HAZARDOUS AIR POLLUTANT INVENTORY (Inventory of air pollution sources) Small Quantity Generators, between 100 kg and 1000 kg of hazardous waste/month (Resource Conservation and Recovery Act (tracking hazardous waste)) - notification TRI REPORTER (Tracking of toxic chemicals releasing facilities) Business SIC classification: SURGICAL AND MEDICAL INSTRUMENTS AND APPARATUS; NONCLASSIFIABLE ESTABLISHMENTS Business NAICS classification: SURGICAL AND MEDICAL INSTRUMENT MANUFACTURING.; SURGICAL AND MEDICAL INSTRUMENT MANUFACTURING.
DIXIE FURNITURE COMPANY INCORPORATED (728 SOUTH FAYETTEVILLE STREET in ASHEBORO, NC)
AIR MAJOR (AIRS/AFS) STATE MASTER (North Carolina facility info) - UNDERGROUND STORAGE TANK PROGRAM (Resource Conservation and Recovery Act (tracking hazardous waste)) TRI REPORTER (Tracking of toxic chemicals releasing facilities) Business SIC classification: WOOD HOUSEHOLD FURNITURE, EXCEPT UPHOLSTERED; NONCLASSIFIABLE ESTABLISHMENTS Organizations: LEXINGTON FURNITURE INDUSTRIES (CONTACT/OWNER)
Alternative names: LEXINGTON FURNITURE IND, LINEAGE
BARKER FURNITURE LEG COMPANY INCORPORATED (502 INDUSTRIAL PARKS AVENUE in ASHEBORO, NC)
AIR MINOR (AIRS/AFS) STATE MASTER (North Carolina facility info) - AIR PROGRAM CRITERIA AND HAZARDOUS AIR POLLUTANT INVENTORY (Inventory of air pollution sources) Business SIC classification: WOOD HOUSEHOLD FURNITURE, EXCEPT UPHOLSTERED Business NAICS classification: SHOWCASE, PARTITION, SHELVING, AND LOCKER MANUFACTURING.; SHOWCASE, PARTITION, SHELVING, AND LOCKER MANUFACTURING.
CHAIR MANUFACTURING COMPANY INCORPORATED (728 SOUTH FAYETTEVILLE STREET in ASHEBORO, NC)
AIR MINOR (AIRS/AFS) STATE MASTER (North Carolina facility info) - AIR PROGRAM CRITERIA AND HAZARDOUS AIR POLLUTANT INVENTORY (Inventory of air pollution sources) Business SIC classification: WOOD HOUSEHOLD FURNITURE, EXCEPT UPHOLSTERED Business NAICS classification: NONUPHOLSTERED WOOD HOUSEHOLD FURNITURE MANUFACTURING.; NONUPHOLSTERED WOOD HOUSEHOLD FURNITURE MANUFACTURING.
ASHEBORO HOSIERY MILLS INACTIVE (PO BOX 550 in ASHEBORO, NC)
AIR MINOR (AIRS/AFS) STATE MASTER (North Carolina facility info) - AIR PROGRAM Business SIC classification: HOSIERY
BARKER LEG AND PANEL COMPANY INACTIVE (HIGHWAY 64 WEST in ASHEBORO, NC)
AIR MINOR (AIRS/AFS) STATE MASTER (North Carolina facility info) - AIR PROGRAM Business SIC classification: WOOD HOUSEHOLD FURNITURE, EXCEPT UPHOLSTERED
B & H PANEL COMPANY (230 W. ACADEMY ST. in ASHEBORO, NC)
AIR MAJOR (AIRS/AFS) CRITERIA AND HAZARDOUS AIR POLLUTANT INVENTORY (Inventory of air pollution sources) National Pollutant Discharge Elimination System NON-MAJOR (Tracking pollutant discharge elimination systems) - permit HAZARDOUS WASTE BIENNIAL REPORTER (Resource Conservation and Recovery Act (tracking hazardous waste)) Large Quantity Generators, more that 1000 kg of hazardous waste/month (Resource Conservation and Recovery Act (tracking hazardous waste)) - notification TRI REPORTER (Tracking of toxic chemicals releasing facilities) Business SIC classification: HARDWOOD DIMENSION AND FLOORING MILLS; WOOD HOUSEHOLD FURNITURE, EXCEPT UPHOLSTERED Business NAICS classification: ALL OTHER MISCELLANEOUS WOOD PRODUCT MANUFACTURING.; SHOWCASE, PARTITION, SHELVING, AND LOCKER MANUFACTURING.
CAROLINA CUSTOM FINISHING LIMITED LIABILITY COMPANY (189 COMMERCE PLACE in ASHEBORO, NC)
AIR MINOR (AIRS/AFS) STATE MASTER (North Carolina facility info) - -115DA4YG00UT2W84DX0J0C45ST, WASTEWATER FACILITY, -4731, AIR PROGRAM CRITERIA AND HAZARDOUS AIR POLLUTANT INVENTORY (Inventory of air pollution sources) Business SIC classification: COMMERCIAL PRINTING, GRAVURE; BUSINESS SERVICES Alternative names: CAROLINA CUSTOM FINISHING LLC
ACME MCCRARY CORPORATION PRITCHARD ST. PLANT (601 E PRICHARD STREET in ASHEBORO, NC)
AIR SYNTHETIC MINOR (AIRS/AFS) STATE MASTER (North Carolina facility info) - AIR PROGRAM CRITERIA AND HAZARDOUS AIR POLLUTANT INVENTORY (Inventory of air pollution sources) Business SIC and NAICS classification: HOSIERY
Housing units lacking complete plumbing facilities: 1.7% Housing units lacking complete kitchen facilities: 4.1%
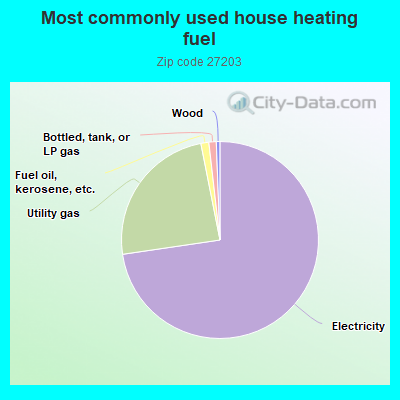
72.4%Electricity
24.1%Utility gas
1.3%Fuel oil, kerosene, etc.
1.2%Bottled, tank, or LP gas
0.6%Wood
Population in 1990: 41,541. Population change in the 1990s: +8,127 (+19.6%).
Place of birth for U.S.-born residents:
This state: 13,657
Northeast: 1,817
Midwest: 1,002
South: 2,324
West: 434
59% of the 27203 zip code residents lived in the same house 5 years ago. Out of people who lived in different houses, 63% lived in this county. Out of people who lived in different counties, 50% lived in North Carolina.
85% of the 27203 zip code residents lived in the same house 1 year ago. Out of people who lived in different houses, 63% moved from this county. Out of people who lived in different houses, 22% moved from different county within same state. Out of people who lived in different houses, 6% moved from different state. Out of people who lived in different houses, 1% moved from abroad.
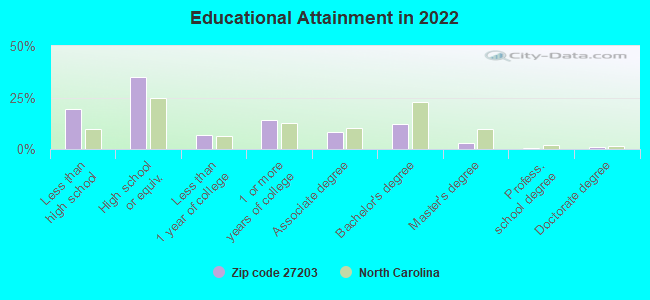
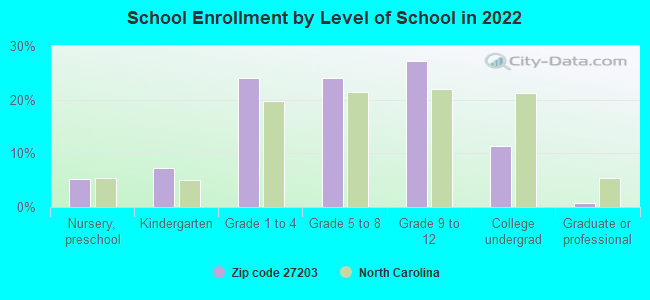
Private vs. public school enrollment:
Students in private schools in grades 1 to 8 (elementary and middle school): 461
Here:
16.9%
North Carolina:
13.8%
Students in private schools in grades 9 to 12 (high school): 49
Here:
3.3%
North Carolina:
11.9%
Students in private undergraduate colleges: 60
Here:
9.4%
North Carolina:
19.3%
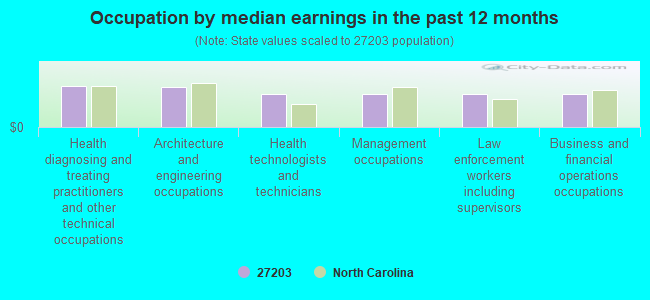
Occupation by median earnings in the past 12 months ($)
61,104Health diagnosing and treating practitioners and other technical occupations
60,317Architecture and engineering occupations
49,898Health technologists and technicians
49,623Management occupations
49,288Law enforcement workers including supervisors
49,082Business and financial operations occupations
Companies with federal contracts located in this zip code (ASHEBORO, NC):
FOX APPAREL INC (414 E DIXIE DR 203; small business) : $31,857,165 in 10 contractsfrom 2004 to 2006
Contracts for Clothing, Special Purpose by Defense Logistics Agency Signed by year:2000: $0; 2001: $0; 2002: $0; 2003: $0; 2004: $1,336,500; 2005: $23,683,800; 2006: $6,836,865.
Biggest contracts:
$9,519,000 with Defense Logistics Agency for Clothing, Special Purpose. Signed on 2005-02-01. Completion date: 2005-07-29.
$3,411,450, same as above.Signed on 2006-04-05. Completion date: 2006-10-11.
$3,411,450, same as above.Signed on 2006-06-29. Completion date: 2007-01-09.
$3,411,450, same as above.Signed on 2005-12-16. Completion date: 2006-05-15.
FOUST CORPORATION (114 SUNSET AVE; small business) : $345,756 in 10 contractsfrom 1999 to 2001
Contracts for Communications Services, Maintenance, Repair and Rebuilding of Equipment -- Photographic Equipment, Operation of Government-Owned Facilities -- Other Non-Building Facilities by EPA, Army Signed by year:2000: $170,000; 2001: $75,000; 2002: $0; 2003: $0; 2004: $0; 2005: $0; 2006: $0.
Biggest contracts:
$90,000 with EPA for Communications Services. Signed on 2000-01-15. Completion date: 2000-09-15.
$80,000 with Army for Maintenance, Repair and Rebuilding of Equipment -- Photographic Equipment. Signed on 2000-10-23. Completion date: 2001-09-30.
$75,000, same as above.Signed on 2001-12-10. Completion date: 2002-09-30.
$60,756, same as above.Signed on 1999-11-18. Completion date: 2000-09-30.
THERMACO INC (646 GREENSBORO STREET; small business) : $55,476 in 2 contractsfrom 2000 to 2005
$49,000 with Bureau of Prisoners/Federal Prison System for Kitchen Equipment and Appliances. Taking place in CA. Signed on 2000-03-15. Completion date: 2000-04-15.
$6,476 with Army for Waste Disposal Equipment. Signed on 2005-09-28. Completion date: 2005-10-28.
ROYAL TOURS OFRANDOLPH INC (211 W CENTRAL AVE; small business) : $10,666 in 3 contractsfrom 2003 to 2005
$4,146 with Army for Passenger Motor Charter Service. Taking place in VA. Signed on 2003-05-20. Completion date: 2003-06-20.
$3,660 with Army for Passenger Motor Charter Service. Taking place in SC. Signed on 2005-04-21. Completion date: 2005-06-07.
$2,860 with Army for Passenger Motor Charter Service. Signed on 2004-05-26. Completion date: 2004-06-08.
Top industries in this zip code by the number of employees in 2005:
Construction: Power and Communication Line and Related Structures Construction (over 1000 employees: 1 establishment, 10-19 employees: 2 establishments)
Health Care and Social Assistance: General Medical and Surgical Hospitals (500-999: 1)
Information: Cable and Other Program Distribution (500-999: 1)
2002 - 2018 National Fire Incident Reporting System (NFIRS) incidents
Based on the data from the years 2002 - 2018 the average number of fires per year is 107. The highest number of reported fire incidents - 147 took place in 2002, and the least - 50 in 2011. The data has a dropping trend.
When looking into fire subcategories, the most reports belonged to: Structure Fires (42.6%), and Outside Fires (38.0%).
Fire incident types reported to NFIRS in Zip Code 27203


 Nearest zip codes: 27248, 27205, 27317, 27350, 27316, 27233.


 Based on the data from the years 2002 - 2018 the average number of fires per year is 107. The highest number of reported fire incidents - 147 took place in 2002, and the least - 50 in 2011. The data has a dropping trend.
 When looking into fire subcategories, the most reports belonged to: Structure Fires (42.6%), and Outside Fires (38.0%).