Asheboro, North Carolina Submit your own pictures of this city and show them to the world
OSM Map
General Map
Google Map
MSN Map
OSM Map
General Map
Google Map
MSN Map
OSM Map
General Map
Google Map
MSN Map
OSM Map
General Map
Google Map
MSN Map
Please wait while loading the map...
Population in 2022: 27,482 (99% urban, 1% rural). Population change since 2000: +26.8%Males: 13,976 Females: 13,506
March 2022 cost of living index in Asheboro: 90.1 (less than average, U.S. average is 100) Percentage of residents living in poverty in 2022: 21.6%for White Non-Hispanic residents , 39.6% for Black residents , 21.9% for Hispanic or Latino residents , 61.3% for American Indian residents , 20.6% for other race residents , 35.0% for two or more races residents )
Profiles of local businesses
Business Search - 14 Million verified businesses
Data:
Median household income ($)
Median household income (% change since 2000)
Household income diversity
Ratio of average income to average house value (%)
Ratio of average income to average rent
Median household income ($) - White
Median household income ($) - Black or African American
Median household income ($) - Asian
Median household income ($) - Hispanic or Latino
Median household income ($) - American Indian and Alaska Native
Median household income ($) - Multirace
Median household income ($) - Other Race
Median household income for houses/condos with a mortgage ($)
Median household income for apartments without a mortgage ($)
Races - White alone (%)
Races - White alone (% change since 2000)
Races - Black alone (%)
Races - Black alone (% change since 2000)
Races - American Indian alone (%)
Races - American Indian alone (% change since 2000)
Races - Asian alone (%)
Races - Asian alone (% change since 2000)
Races - Hispanic (%)
Races - Hispanic (% change since 2000)
Races - Native Hawaiian and Other Pacific Islander alone (%)
Races - Native Hawaiian and Other Pacific Islander alone (% change since 2000)
Races - Two or more races (%)
Races - Two or more races (% change since 2000)
Races - Other race alone (%)
Races - Other race alone (% change since 2000)
Racial diversity
Unemployment (%)
Unemployment (% change since 2000)
Unemployment (%) - White
Unemployment (%) - Black or African American
Unemployment (%) - Asian
Unemployment (%) - Hispanic or Latino
Unemployment (%) - American Indian and Alaska Native
Unemployment (%) - Multirace
Unemployment (%) - Other Race
Population density (people per square mile)
Population - Males (%)
Population - Females (%)
Population - Males (%) - White
Population - Males (%) - Black or African American
Population - Males (%) - Asian
Population - Males (%) - Hispanic or Latino
Population - Males (%) - American Indian and Alaska Native
Population - Males (%) - Multirace
Population - Males (%) - Other Race
Population - Females (%) - White
Population - Females (%) - Black or African American
Population - Females (%) - Asian
Population - Females (%) - Hispanic or Latino
Population - Females (%) - American Indian and Alaska Native
Population - Females (%) - Multirace
Population - Females (%) - Other Race
Coronavirus confirmed cases (Apr 27, 2024)
Deaths caused by coronavirus (Apr 27, 2024)
Coronavirus confirmed cases (per 100k population) (Apr 27, 2024)
Deaths caused by coronavirus (per 100k population) (Apr 27, 2024)
Daily increase in number of cases (Apr 27, 2024)
Weekly increase in number of cases (Apr 27, 2024)
Cases doubled (in days) (Apr 27, 2024)
Hospitalized patients (Apr 18, 2022)
Negative test results (Apr 18, 2022)
Total test results (Apr 18, 2022)
COVID Vaccine doses distributed (per 100k population) (Sep 19, 2023)
COVID Vaccine doses administered (per 100k population) (Sep 19, 2023)
COVID Vaccine doses distributed (Sep 19, 2023)
COVID Vaccine doses administered (Sep 19, 2023)
Likely homosexual households (%)
Likely homosexual households (% change since 2000)
Likely homosexual households - Lesbian couples (%)
Likely homosexual households - Lesbian couples (% change since 2000)
Likely homosexual households - Gay men (%)
Likely homosexual households - Gay men (% change since 2000)
Cost of living index
Median gross rent ($)
Median contract rent ($)
Median monthly housing costs ($)
Median house or condo value ($)
Median house or condo value ($ change since 2000)
Mean house or condo value by units in structure - 1, detached ($)
Mean house or condo value by units in structure - 1, attached ($)
Mean house or condo value by units in structure - 2 ($)
Mean house or condo value by units in structure by units in structure - 3 or 4 ($)
Mean house or condo value by units in structure - 5 or more ($)
Mean house or condo value by units in structure - Boat, RV, van, etc. ($)
Mean house or condo value by units in structure - Mobile home ($)
Median house or condo value ($) - White
Median house or condo value ($) - Black or African American
Median house or condo value ($) - Asian
Median house or condo value ($) - Hispanic or Latino
Median house or condo value ($) - American Indian and Alaska Native
Median house or condo value ($) - Multirace
Median house or condo value ($) - Other Race
Median resident age
Resident age diversity
Median resident age - Males
Median resident age - Females
Median resident age - White
Median resident age - Black or African American
Median resident age - Asian
Median resident age - Hispanic or Latino
Median resident age - American Indian and Alaska Native
Median resident age - Multirace
Median resident age - Other Race
Median resident age - Males - White
Median resident age - Males - Black or African American
Median resident age - Males - Asian
Median resident age - Males - Hispanic or Latino
Median resident age - Males - American Indian and Alaska Native
Median resident age - Males - Multirace
Median resident age - Males - Other Race
Median resident age - Females - White
Median resident age - Females - Black or African American
Median resident age - Females - Asian
Median resident age - Females - Hispanic or Latino
Median resident age - Females - American Indian and Alaska Native
Median resident age - Females - Multirace
Median resident age - Females - Other Race
Commute - mean travel time to work (minutes)
Travel time to work - Less than 5 minutes (%)
Travel time to work - Less than 5 minutes (% change since 2000)
Travel time to work - 5 to 9 minutes (%)
Travel time to work - 5 to 9 minutes (% change since 2000)
Travel time to work - 10 to 19 minutes (%)
Travel time to work - 10 to 19 minutes (% change since 2000)
Travel time to work - 20 to 29 minutes (%)
Travel time to work - 20 to 29 minutes (% change since 2000)
Travel time to work - 30 to 39 minutes (%)
Travel time to work - 30 to 39 minutes (% change since 2000)
Travel time to work - 40 to 59 minutes (%)
Travel time to work - 40 to 59 minutes (% change since 2000)
Travel time to work - 60 to 89 minutes (%)
Travel time to work - 60 to 89 minutes (% change since 2000)
Travel time to work - 90 or more minutes (%)
Travel time to work - 90 or more minutes (% change since 2000)
Marital status - Never married (%)
Marital status - Now married (%)
Marital status - Separated (%)
Marital status - Widowed (%)
Marital status - Divorced (%)
Median family income ($)
Median family income (% change since 2000)
Median non-family income ($)
Median non-family income (% change since 2000)
Median per capita income ($)
Median per capita income (% change since 2000)
Median family income ($) - White
Median family income ($) - Black or African American
Median family income ($) - Asian
Median family income ($) - Hispanic or Latino
Median family income ($) - American Indian and Alaska Native
Median family income ($) - Multirace
Median family income ($) - Other Race
Median year house/condo built
Median year apartment built
Year house built - Built 2005 or later (%)
Year house built - Built 2000 to 2004 (%)
Year house built - Built 1990 to 1999 (%)
Year house built - Built 1980 to 1989 (%)
Year house built - Built 1970 to 1979 (%)
Year house built - Built 1960 to 1969 (%)
Year house built - Built 1950 to 1959 (%)
Year house built - Built 1940 to 1949 (%)
Year house built - Built 1939 or earlier (%)
Average household size
Household density (households per square mile)
Average household size - White
Average household size - Black or African American
Average household size - Asian
Average household size - Hispanic or Latino
Average household size - American Indian and Alaska Native
Average household size - Multirace
Average household size - Other Race
Occupied housing units (%)
Vacant housing units (%)
Owner occupied housing units (%)
Renter occupied housing units (%)
Vacancy status - For rent (%)
Vacancy status - For sale only (%)
Vacancy status - Rented or sold, not occupied (%)
Vacancy status - For seasonal, recreational, or occasional use (%)
Vacancy status - For migrant workers (%)
Vacancy status - Other vacant (%)
Residents with income below the poverty level (%)
Residents with income below 50% of the poverty level (%)
Children below poverty level (%)
Poor families by family type - Married-couple family (%)
Poor families by family type - Male, no wife present (%)
Poor families by family type - Female, no husband present (%)
Poverty status for native-born residents (%)
Poverty status for foreign-born residents (%)
Poverty among high school graduates not in families (%)
Poverty among people who did not graduate high school not in families (%)
Residents with income below the poverty level (%) - White
Residents with income below the poverty level (%) - Black or African American
Residents with income below the poverty level (%) - Asian
Residents with income below the poverty level (%) - Hispanic or Latino
Residents with income below the poverty level (%) - American Indian and Alaska Native
Residents with income below the poverty level (%) - Multirace
Residents with income below the poverty level (%) - Other Race
Air pollution - Air Quality Index (AQI)
Air pollution - CO
Air pollution - NO2
Air pollution - SO2
Air pollution - Ozone
Air pollution - PM10
Air pollution - PM25
Air pollution - Pb
Crime - Murders per 100,000 population
Crime - Rapes per 100,000 population
Crime - Robberies per 100,000 population
Crime - Assaults per 100,000 population
Crime - Burglaries per 100,000 population
Crime - Thefts per 100,000 population
Crime - Auto thefts per 100,000 population
Crime - Arson per 100,000 population
Crime - City-data.com crime index
Crime - Violent crime index
Crime - Property crime index
Crime - Murders per 100,000 population (5 year average)
Crime - Rapes per 100,000 population (5 year average)
Crime - Robberies per 100,000 population (5 year average)
Crime - Assaults per 100,000 population (5 year average)
Crime - Burglaries per 100,000 population (5 year average)
Crime - Thefts per 100,000 population (5 year average)
Crime - Auto thefts per 100,000 population (5 year average)
Crime - Arson per 100,000 population (5 year average)
Crime - City-data.com crime index (5 year average)
Crime - Violent crime index (5 year average)
Crime - Property crime index (5 year average)
1996 Presidential Elections Results (%) - Democratic Party (Clinton)
1996 Presidential Elections Results (%) - Republican Party (Dole)
1996 Presidential Elections Results (%) - Other
2000 Presidential Elections Results (%) - Democratic Party (Gore)
2000 Presidential Elections Results (%) - Republican Party (Bush)
2000 Presidential Elections Results (%) - Other
2004 Presidential Elections Results (%) - Democratic Party (Kerry)
2004 Presidential Elections Results (%) - Republican Party (Bush)
2004 Presidential Elections Results (%) - Other
2008 Presidential Elections Results (%) - Democratic Party (Obama)
2008 Presidential Elections Results (%) - Republican Party (McCain)
2008 Presidential Elections Results (%) - Other
2012 Presidential Elections Results (%) - Democratic Party (Obama)
2012 Presidential Elections Results (%) - Republican Party (Romney)
2012 Presidential Elections Results (%) - Other
2016 Presidential Elections Results (%) - Democratic Party (Clinton)
2016 Presidential Elections Results (%) - Republican Party (Trump)
2016 Presidential Elections Results (%) - Other
2020 Presidential Elections Results (%) - Democratic Party (Biden)
2020 Presidential Elections Results (%) - Republican Party (Trump)
2020 Presidential Elections Results (%) - Other
Ancestries Reported - Arab (%)
Ancestries Reported - Czech (%)
Ancestries Reported - Danish (%)
Ancestries Reported - Dutch (%)
Ancestries Reported - English (%)
Ancestries Reported - French (%)
Ancestries Reported - French Canadian (%)
Ancestries Reported - German (%)
Ancestries Reported - Greek (%)
Ancestries Reported - Hungarian (%)
Ancestries Reported - Irish (%)
Ancestries Reported - Italian (%)
Ancestries Reported - Lithuanian (%)
Ancestries Reported - Norwegian (%)
Ancestries Reported - Polish (%)
Ancestries Reported - Portuguese (%)
Ancestries Reported - Russian (%)
Ancestries Reported - Scotch-Irish (%)
Ancestries Reported - Scottish (%)
Ancestries Reported - Slovak (%)
Ancestries Reported - Subsaharan African (%)
Ancestries Reported - Swedish (%)
Ancestries Reported - Swiss (%)
Ancestries Reported - Ukrainian (%)
Ancestries Reported - United States (%)
Ancestries Reported - Welsh (%)
Ancestries Reported - West Indian (%)
Ancestries Reported - Other (%)
Educational Attainment - No schooling completed (%)
Educational Attainment - Less than high school (%)
Educational Attainment - High school or equivalent (%)
Educational Attainment - Less than 1 year of college (%)
Educational Attainment - 1 or more years of college (%)
Educational Attainment - Associate degree (%)
Educational Attainment - Bachelor's degree (%)
Educational Attainment - Master's degree (%)
Educational Attainment - Professional school degree (%)
Educational Attainment - Doctorate degree (%)
School Enrollment - Nursery, preschool (%)
School Enrollment - Kindergarten (%)
School Enrollment - Grade 1 to 4 (%)
School Enrollment - Grade 5 to 8 (%)
School Enrollment - Grade 9 to 12 (%)
School Enrollment - College undergrad (%)
School Enrollment - Graduate or professional (%)
School Enrollment - Not enrolled in school (%)
School enrollment - Public schools (%)
School enrollment - Private schools (%)
School enrollment - Not enrolled (%)
Median number of rooms in houses and condos
Median number of rooms in apartments
Housing units lacking complete plumbing facilities (%)
Housing units lacking complete kitchen facilities (%)
Density of houses
Urban houses (%)
Rural houses (%)
Households with people 60 years and over (%)
Households with people 65 years and over (%)
Households with people 75 years and over (%)
Households with one or more nonrelatives (%)
Households with no nonrelatives (%)
Population in households (%)
Family households (%)
Nonfamily households (%)
Population in families (%)
Family households with own children (%)
Median number of bedrooms in owner occupied houses
Mean number of bedrooms in owner occupied houses
Median number of bedrooms in renter occupied houses
Mean number of bedrooms in renter occupied houses
Median number of vehichles in owner occupied houses
Mean number of vehichles in owner occupied houses
Median number of vehichles in renter occupied houses
Mean number of vehichles in renter occupied houses
Mortgage status - with mortgage (%)
Mortgage status - with second mortgage (%)
Mortgage status - with home equity loan (%)
Mortgage status - with both second mortgage and home equity loan (%)
Mortgage status - without a mortgage (%)
Average family size
Average family size - White
Average family size - Black or African American
Average family size - Asian
Average family size - Hispanic or Latino
Average family size - American Indian and Alaska Native
Average family size - Multirace
Average family size - Other Race
Geographical mobility - Same house 1 year ago (%)
Geographical mobility - Moved within same county (%)
Geographical mobility - Moved from different county within same state (%)
Geographical mobility - Moved from different state (%)
Geographical mobility - Moved from abroad (%)
Place of birth - Born in state of residence (%)
Place of birth - Born in other state (%)
Place of birth - Native, outside of US (%)
Place of birth - Foreign born (%)
Housing units in structures - 1, detached (%)
Housing units in structures - 1, attached (%)
Housing units in structures - 2 (%)
Housing units in structures - 3 or 4 (%)
Housing units in structures - 5 to 9 (%)
Housing units in structures - 10 to 19 (%)
Housing units in structures - 20 to 49 (%)
Housing units in structures - 50 or more (%)
Housing units in structures - Mobile home (%)
Housing units in structures - Boat, RV, van, etc. (%)
House/condo owner moved in on average (years ago)
Renter moved in on average (years ago)
Year householder moved into unit - Moved in 1999 to March 2000 (%)
Year householder moved into unit - Moved in 1995 to 1998 (%)
Year householder moved into unit - Moved in 1990 to 1994 (%)
Year householder moved into unit - Moved in 1980 to 1989 (%)
Year householder moved into unit - Moved in 1970 to 1979 (%)
Year householder moved into unit - Moved in 1969 or earlier (%)
Means of transportation to work - Drove car alone (%)
Means of transportation to work - Carpooled (%)
Means of transportation to work - Public transportation (%)
Means of transportation to work - Bus or trolley bus (%)
Means of transportation to work - Streetcar or trolley car (%)
Means of transportation to work - Subway or elevated (%)
Means of transportation to work - Railroad (%)
Means of transportation to work - Ferryboat (%)
Means of transportation to work - Taxicab (%)
Means of transportation to work - Motorcycle (%)
Means of transportation to work - Bicycle (%)
Means of transportation to work - Walked (%)
Means of transportation to work - Other means (%)
Working at home (%)
Industry diversity
Most Common Industries - Agriculture, forestry, fishing and hunting, and mining (%)
Most Common Industries - Agriculture, forestry, fishing and hunting (%)
Most Common Industries - Mining, quarrying, and oil and gas extraction (%)
Most Common Industries - Construction (%)
Most Common Industries - Manufacturing (%)
Most Common Industries - Wholesale trade (%)
Most Common Industries - Retail trade (%)
Most Common Industries - Transportation and warehousing, and utilities (%)
Most Common Industries - Transportation and warehousing (%)
Most Common Industries - Utilities (%)
Most Common Industries - Information (%)
Most Common Industries - Finance and insurance, and real estate and rental and leasing (%)
Most Common Industries - Finance and insurance (%)
Most Common Industries - Real estate and rental and leasing (%)
Most Common Industries - Professional, scientific, and management, and administrative and waste management services (%)
Most Common Industries - Professional, scientific, and technical services (%)
Most Common Industries - Management of companies and enterprises (%)
Most Common Industries - Administrative and support and waste management services (%)
Most Common Industries - Educational services, and health care and social assistance (%)
Most Common Industries - Educational services (%)
Most Common Industries - Health care and social assistance (%)
Most Common Industries - Arts, entertainment, and recreation, and accommodation and food services (%)
Most Common Industries - Arts, entertainment, and recreation (%)
Most Common Industries - Accommodation and food services (%)
Most Common Industries - Other services, except public administration (%)
Most Common Industries - Public administration (%)
Occupation diversity
Most Common Occupations - Management, business, science, and arts occupations (%)
Most Common Occupations - Management, business, and financial occupations (%)
Most Common Occupations - Management occupations (%)
Most Common Occupations - Business and financial operations occupations (%)
Most Common Occupations - Computer, engineering, and science occupations (%)
Most Common Occupations - Computer and mathematical occupations (%)
Most Common Occupations - Architecture and engineering occupations (%)
Most Common Occupations - Life, physical, and social science occupations (%)
Most Common Occupations - Education, legal, community service, arts, and media occupations (%)
Most Common Occupations - Community and social service occupations (%)
Most Common Occupations - Legal occupations (%)
Most Common Occupations - Education, training, and library occupations (%)
Most Common Occupations - Arts, design, entertainment, sports, and media occupations (%)
Most Common Occupations - Healthcare practitioners and technical occupations (%)
Most Common Occupations - Health diagnosing and treating practitioners and other technical occupations (%)
Most Common Occupations - Health technologists and technicians (%)
Most Common Occupations - Service occupations (%)
Most Common Occupations - Healthcare support occupations (%)
Most Common Occupations - Protective service occupations (%)
Most Common Occupations - Fire fighting and prevention, and other protective service workers including supervisors (%)
Most Common Occupations - Law enforcement workers including supervisors (%)
Most Common Occupations - Food preparation and serving related occupations (%)
Most Common Occupations - Building and grounds cleaning and maintenance occupations (%)
Most Common Occupations - Personal care and service occupations (%)
Most Common Occupations - Sales and office occupations (%)
Most Common Occupations - Sales and related occupations (%)
Most Common Occupations - Office and administrative support occupations (%)
Most Common Occupations - Natural resources, construction, and maintenance occupations (%)
Most Common Occupations - Farming, fishing, and forestry occupations (%)
Most Common Occupations - Construction and extraction occupations (%)
Most Common Occupations - Installation, maintenance, and repair occupations (%)
Most Common Occupations - Production, transportation, and material moving occupations (%)
Most Common Occupations - Production occupations (%)
Most Common Occupations - Transportation occupations (%)
Most Common Occupations - Material moving occupations (%)
People in Group quarters - Institutionalized population (%)
People in Group quarters - Correctional institutions (%)
People in Group quarters - Federal prisons and detention centers (%)
People in Group quarters - Halfway houses (%)
People in Group quarters - Local jails and other confinement facilities (including police lockups) (%)
People in Group quarters - Military disciplinary barracks (%)
People in Group quarters - State prisons (%)
People in Group quarters - Other types of correctional institutions (%)
People in Group quarters - Nursing homes (%)
People in Group quarters - Hospitals/wards, hospices, and schools for the handicapped (%)
People in Group quarters - Hospitals/wards and hospices for chronically ill (%)
People in Group quarters - Hospices or homes for chronically ill (%)
People in Group quarters - Military hospitals or wards for chronically ill (%)
People in Group quarters - Other hospitals or wards for chronically ill (%)
People in Group quarters - Hospitals or wards for drug/alcohol abuse (%)
People in Group quarters - Mental (Psychiatric) hospitals or wards (%)
People in Group quarters - Schools, hospitals, or wards for the mentally retarded (%)
People in Group quarters - Schools, hospitals, or wards for the physically handicapped (%)
People in Group quarters - Institutions for the deaf (%)
People in Group quarters - Institutions for the blind (%)
People in Group quarters - Orthopedic wards and institutions for the physically handicapped (%)
People in Group quarters - Wards in general hospitals for patients who have no usual home elsewhere (%)
People in Group quarters - Wards in military hospitals for patients who have no usual home elsewhere (%)
People in Group quarters - Juvenile institutions (%)
People in Group quarters - Long-term care (%)
People in Group quarters - Homes for abused, dependent, and neglected children (%)
People in Group quarters - Residential treatment centers for emotionally disturbed children (%)
People in Group quarters - Training schools for juvenile delinquents (%)
People in Group quarters - Short-term care, detention or diagnostic centers for delinquent children (%)
People in Group quarters - Type of juvenile institution unknown (%)
People in Group quarters - Noninstitutionalized population (%)
People in Group quarters - College dormitories (includes college quarters off campus) (%)
People in Group quarters - Military quarters (%)
People in Group quarters - On base (%)
People in Group quarters - Barracks, unaccompanied personnel housing (UPH), (Enlisted/Officer), ;and similar group living quarters for military personnel (%)
People in Group quarters - Transient quarters for temporary residents (%)
People in Group quarters - Military ships (%)
People in Group quarters - Group homes (%)
People in Group quarters - Homes or halfway houses for drug/alcohol abuse (%)
People in Group quarters - Homes for the mentally ill (%)
People in Group quarters - Homes for the mentally retarded (%)
People in Group quarters - Homes for the physically handicapped (%)
People in Group quarters - Other group homes (%)
People in Group quarters - Religious group quarters (%)
People in Group quarters - Dormitories (%)
People in Group quarters - Agriculture workers' dormitories on farms (%)
People in Group quarters - Job Corps and vocational training facilities (%)
People in Group quarters - Other workers' dormitories (%)
People in Group quarters - Crews of maritime vessels (%)
People in Group quarters - Other nonhousehold living situations (%)
People in Group quarters - Other noninstitutional group quarters (%)
Residents speaking English at home (%)
Residents speaking English at home - Born in the United States (%)
Residents speaking English at home - Native, born elsewhere (%)
Residents speaking English at home - Foreign born (%)
Residents speaking Spanish at home (%)
Residents speaking Spanish at home - Born in the United States (%)
Residents speaking Spanish at home - Native, born elsewhere (%)
Residents speaking Spanish at home - Foreign born (%)
Residents speaking other language at home (%)
Residents speaking other language at home - Born in the United States (%)
Residents speaking other language at home - Native, born elsewhere (%)
Residents speaking other language at home - Foreign born (%)
Class of Workers - Employee of private company (%)
Class of Workers - Self-employed in own incorporated business (%)
Class of Workers - Private not-for-profit wage and salary workers (%)
Class of Workers - Local government workers (%)
Class of Workers - State government workers (%)
Class of Workers - Federal government workers (%)
Class of Workers - Self-employed workers in own not incorporated business and Unpaid family workers (%)
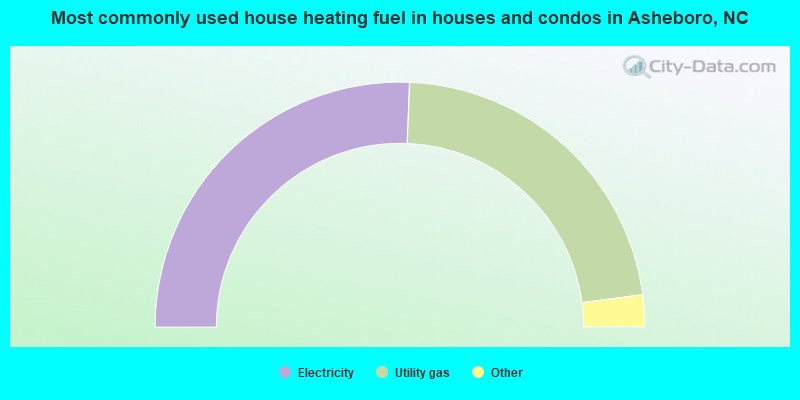
House heating fuel used in houses and condos - Utility gas (%)
House heating fuel used in houses and condos - Bottled, tank, or LP gas (%)
House heating fuel used in houses and condos - Electricity (%)
House heating fuel used in houses and condos - Fuel oil, kerosene, etc. (%)
House heating fuel used in houses and condos - Coal or coke (%)
House heating fuel used in houses and condos - Wood (%)
House heating fuel used in houses and condos - Solar energy (%)
House heating fuel used in houses and condos - Other fuel (%)
House heating fuel used in houses and condos - No fuel used (%)
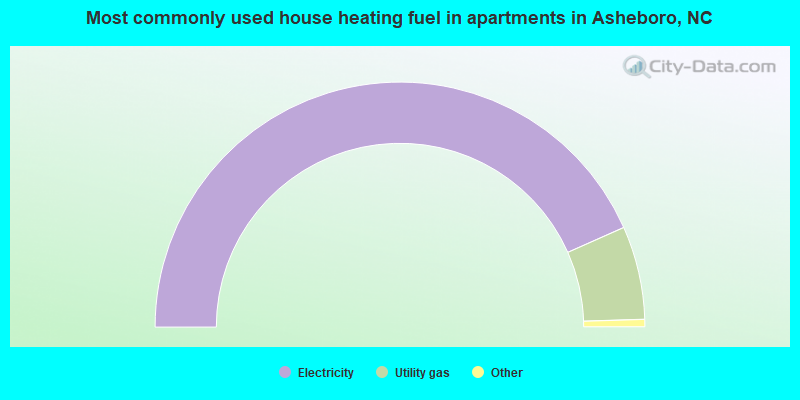
House heating fuel used in apartments - Utility gas (%)
House heating fuel used in apartments - Bottled, tank, or LP gas (%)
House heating fuel used in apartments - Electricity (%)
House heating fuel used in apartments - Fuel oil, kerosene, etc. (%)
House heating fuel used in apartments - Coal or coke (%)
House heating fuel used in apartments - Wood (%)
House heating fuel used in apartments - Solar energy (%)
House heating fuel used in apartments - Other fuel (%)
House heating fuel used in apartments - No fuel used (%)
Armed forces status - In Armed Forces (%)
Armed forces status - Civilian (%)
Armed forces status - Civilian - Veteran (%)
Armed forces status - Civilian - Nonveteran (%)
Fatal accidents locations in years 2005-2021
Fatal accidents locations in 2005
Fatal accidents locations in 2006
Fatal accidents locations in 2007
Fatal accidents locations in 2008
Fatal accidents locations in 2009
Fatal accidents locations in 2010
Fatal accidents locations in 2011
Fatal accidents locations in 2012
Fatal accidents locations in 2013
Fatal accidents locations in 2014
Fatal accidents locations in 2015
Fatal accidents locations in 2016
Fatal accidents locations in 2017
Fatal accidents locations in 2018
Fatal accidents locations in 2019
Fatal accidents locations in 2020
Fatal accidents locations in 2021
Alcohol use - People drinking some alcohol every month (%)
Alcohol use - People not drinking at all (%)
Alcohol use - Average days/month drinking alcohol
Alcohol use - Average drinks/week
Alcohol use - Average days/year people drink much
Audiometry - Average condition of hearing (%)
Audiometry - People that can hear a whisper from across a quiet room (%)
Audiometry - People that can hear normal voice from across a quiet room (%)
Audiometry - Ears ringing, roaring, buzzing (%)
Audiometry - Had a job exposure to loud noise (%)
Audiometry - Had off-work exposure to loud noise (%)
Blood Pressure & Cholesterol - Has high blood pressure (%)
Blood Pressure & Cholesterol - Checking blood pressure at home (%)
Blood Pressure & Cholesterol - Frequently checking blood cholesterol (%)
Blood Pressure & Cholesterol - Has high cholesterol level (%)
Consumer Behavior - Money monthly spent on food at supermarket/grocery store
Consumer Behavior - Money monthly spent on food at other stores
Consumer Behavior - Money monthly spent on eating out
Consumer Behavior - Money monthly spent on carryout/delivered foods
Consumer Behavior - Income spent on food at supermarket/grocery store (%)
Consumer Behavior - Income spent on food at other stores (%)
Consumer Behavior - Income spent on eating out (%)
Consumer Behavior - Income spent on carryout/delivered foods (%)
Current Health Status - General health condition (%)
Current Health Status - Blood donors (%)
Current Health Status - Has blood ever tested for HIV virus (%)
Current Health Status - Left-handed people (%)
Dermatology - People using sunscreen (%)
Diabetes - Diabetics (%)
Diabetes - Had a blood test for high blood sugar (%)
Diabetes - People taking insulin (%)
Diet Behavior & Nutrition - Diet health (%)
Diet Behavior & Nutrition - Milk product consumption (# of products/month)
Diet Behavior & Nutrition - Meals not home prepared (#/week)
Diet Behavior & Nutrition - Meals from fast food or pizza place (#/week)
Diet Behavior & Nutrition - Ready-to-eat foods (#/month)
Diet Behavior & Nutrition - Frozen meals/pizza (#/month)
Drug Use - People that ever used marijuana or hashish (%)
Drug Use - Ever used hard drugs (%)
Drug Use - Ever used any form of cocaine (%)
Drug Use - Ever used heroin (%)
Drug Use - Ever used methamphetamine (%)
Health Insurance - People covered by health insurance (%)
Kidney Conditions-Urology - Avg. # of times urinating at night
Medical Conditions - People with asthma (%)
Medical Conditions - People with anemia (%)
Medical Conditions - People with psoriasis (%)
Medical Conditions - People with overweight (%)
Medical Conditions - Elderly people having difficulties in thinking or remembering (%)
Medical Conditions - People who ever received blood transfusion (%)
Medical Conditions - People having trouble seeing even with glass/contacts (%)
Medical Conditions - People with arthritis (%)
Medical Conditions - People with gout (%)
Medical Conditions - People with congestive heart failure (%)
Medical Conditions - People with coronary heart disease (%)
Medical Conditions - People with angina pectoris (%)
Medical Conditions - People who ever had heart attack (%)
Medical Conditions - People who ever had stroke (%)
Medical Conditions - People with emphysema (%)
Medical Conditions - People with thyroid problem (%)
Medical Conditions - People with chronic bronchitis (%)
Medical Conditions - People with any liver condition (%)
Medical Conditions - People who ever had cancer or malignancy (%)
Mental Health - People who have little interest in doing things (%)
Mental Health - People feeling down, depressed, or hopeless (%)
Mental Health - People who have trouble sleeping or sleeping too much (%)
Mental Health - People feeling tired or having little energy (%)
Mental Health - People with poor appetite or overeating (%)
Mental Health - People feeling bad about themself (%)
Mental Health - People who have trouble concentrating on things (%)
Mental Health - People moving or speaking slowly or too fast (%)
Mental Health - People having thoughts they would be better off dead (%)
Oral Health - Average years since last visit a dentist
Oral Health - People embarrassed because of mouth (%)
Oral Health - People with gum disease (%)
Oral Health - General health of teeth and gums (%)
Oral Health - Average days a week using dental floss/device
Oral Health - Average days a week using mouthwash for dental problem
Oral Health - Average number of teeth
Pesticide Use - Households using pesticides to control insects (%)
Pesticide Use - Households using pesticides to kill weeds (%)
Physical Activity - People doing vigorous-intensity work activities (%)
Physical Activity - People doing moderate-intensity work activities (%)
Physical Activity - People walking or bicycling (%)
Physical Activity - People doing vigorous-intensity recreational activities (%)
Physical Activity - People doing moderate-intensity recreational activities (%)
Physical Activity - Average hours a day doing sedentary activities
Physical Activity - Average hours a day watching TV or videos
Physical Activity - Average hours a day using computer
Physical Functioning - People having limitations keeping them from working (%)
Physical Functioning - People limited in amount of work they can do (%)
Physical Functioning - People that need special equipment to walk (%)
Physical Functioning - People experiencing confusion/memory problems (%)
Physical Functioning - People requiring special healthcare equipment (%)
Prescription Medications - Average number of prescription medicines taking
Preventive Aspirin Use - Adults 40+ taking low-dose aspirin (%)
Reproductive Health - Vaginal deliveries (%)
Reproductive Health - Cesarean deliveries (%)
Reproductive Health - Deliveries resulted in a live birth (%)
Reproductive Health - Pregnancies resulted in a delivery (%)
Reproductive Health - Women breastfeeding newborns (%)
Reproductive Health - Women that had a hysterectomy (%)
Reproductive Health - Women that had both ovaries removed (%)
Reproductive Health - Women that have ever taken birth control pills (%)
Reproductive Health - Women taking birth control pills (%)
Reproductive Health - Women that have ever used Depo-Provera or injectables (%)
Reproductive Health - Women that have ever used female hormones (%)
Sexual Behavior - People 18+ that ever had sex (vaginal, anal, or oral) (%)
Sexual Behavior - Males 18+ that ever had vaginal sex with a woman (%)
Sexual Behavior - Males 18+ that ever performed oral sex on a woman (%)
Sexual Behavior - Males 18+ that ever had anal sex with a woman (%)
Sexual Behavior - Males 18+ that ever had any sex with a man (%)
Sexual Behavior - Females 18+ that ever had vaginal sex with a man (%)
Sexual Behavior - Females 18+ that ever performed oral sex on a man (%)
Sexual Behavior - Females 18+ that ever had anal sex with a man (%)
Sexual Behavior - Females 18+ that ever had any kind of sex with a woman (%)
Sexual Behavior - Average age people first had sex
Sexual Behavior - Average number of female sex partners in lifetime (males 18+)
Sexual Behavior - Average number of female vaginal sex partners in lifetime (males 18+)
Sexual Behavior - Average age people first performed oral sex on a woman (18+)
Sexual Behavior - Average number of woman performed oral sex on in lifetime (18+)
Sexual Behavior - Average number of male sex partners in lifetime (males 18+)
Sexual Behavior - Average number of male anal sex partners in lifetime (males 18+)
Sexual Behavior - Average age people first performed oral sex on a man (18+)
Sexual Behavior - Average number of male oral sex partners in lifetime (18+)
Sexual Behavior - People using protection when performing oral sex (%)
Sexual Behavior - Average number of times people have vaginal or anal sex a year
Sexual Behavior - People having sex without condom (%)
Sexual Behavior - Average number of male sex partners in lifetime (females 18+)
Sexual Behavior - Average number of male vaginal sex partners in lifetime (females 18+)
Sexual Behavior - Average number of female sex partners in lifetime (females 18+)
Sexual Behavior - Circumcised males 18+ (%)
Sleep Disorders - Average hours sleeping at night
Sleep Disorders - People that has trouble sleeping (%)
Smoking-Cigarette Use - People smoking cigarettes (%)
Taste & Smell - People 40+ having problems with smell (%)
Taste & Smell - People 40+ having problems with taste (%)
Taste & Smell - People 40+ that ever had wisdom teeth removed (%)
Taste & Smell - People 40+ that ever had tonsils teeth removed (%)
Taste & Smell - People 40+ that ever had a loss of consciousness because of a head injury (%)
Taste & Smell - People 40+ that ever had a broken nose or other serious injury to face or skull (%)
Taste & Smell - People 40+ that ever had two or more sinus infections (%)
Weight - Average height (inches)
Weight - Average weight (pounds)
Weight - Average BMI
Weight - People that are obese (%)
Weight - People that ever were obese (%)
Weight - People trying to lose weight (%)
Officers per 1,000 residents here:
2.99North Carolina average:
2.27
Latest news from Asheboro, NC collected exclusively by city-data.com from local newspapers, TV, and radio stations
Ancestries: English (7.2%), American (6.1%), African (4.1%), Irish (3.9%), German (2.8%), Scotch-Irish (1.7%).
Current Local Time:
Land area: 15.3 square miles.
Population density: 1,791 people per square mile (low).
3,515 residents are foreign born (11.1% Latin America ).
This city:
12.8%North Carolina:
8.3%
Median real estate property taxes paid for housing units with mortgages in 2022: $1,679 (0.9%)Median real estate property taxes paid for housing units with no mortgage in 2022: $1,529 (1.1%)
Nearest city with pop. 50,000+: High Point, NC
Nearest city with pop. 200,000+: Greensboro, NC
Nearest city with pop. 1,000,000+: Philadelphia, PA
Nearest cities:
Latitude: 35.72 N, Longitude: 79.81 W
Daytime population change due to commuting: +10,418 (+38.0%)Workers who live and work in this city: 6,962 (59.9%)
Property values in Asheboro, NC
Asheboro tourist attractions:
Single-family new house construction building permits:
2022: 70 buildings , average cost: $119,5002021: 87 buildings , average cost: $103,0002020: 85 buildings , average cost: $119,4002019: 44 buildings , average cost: $96,7002018: 80 buildings , average cost: $88,5002017: 58 buildings , average cost: $93,7002016: 45 buildings , average cost: $77,6002015: 38 buildings , average cost: $90,2002014: 24 buildings , average cost: $131,3002013: 18 buildings , average cost: $120,4002012: 19 buildings , average cost: $100,8002011: 9 buildings , average cost: $101,7002010: 42 buildings , average cost: $59,0002009: 36 buildings , average cost: $79,7002008: 80 buildings , average cost: $57,5002007: 119 buildings , average cost: $69,7002006: 88 buildings , average cost: $87,8002005: 99 buildings , average cost: $89,3002004: 88 buildings , average cost: $78,3002003: 110 buildings , average cost: $68,4002002: 102 buildings , average cost: $74,6002001: 58 buildings , average cost: $85,7002000: 64 buildings , average cost: $72,3001999: 48 buildings , average cost: $76,0001998: 48 buildings , average cost: $68,7001997: 33 buildings , average cost: $52,200Unemployment in December 2023: Here:
3.7%North Carolina:
3.2%
Population change in the 1990s: +3,449 (+18.9%).
Most common occupations in Asheboro, NC (%)
Both Males Females
Other production occupations, including supervisors (10.3%)
Textile, apparel, and furnishings workers (5.8%)
Metal workers and plastic workers (3.6%)
Electrical equipment mechanics and other installation, maintenance, and repair workers, including supervisors (3.4%)
Other sales and related occupations, including supervisors (3.3%)
Building and grounds cleaning and maintenance occupations (3.2%)
Preschool, kindergarten, elementary, and middle school teachers (2.9%)
Other production occupations, including supervisors (10.6%)
Electrical equipment mechanics and other installation, maintenance, and repair workers, including supervisors (6.1%)
Textile, apparel, and furnishings workers (4.6%)
Metal workers and plastic workers (4.2%)
Driver/sales workers and truck drivers (4.2%)
Construction laborers (3.8%)
Building and grounds cleaning and maintenance occupations (3.7%)
Other production occupations, including supervisors (10.0%)
Textile, apparel, and furnishings workers (7.2%)
Secretaries and administrative assistants (6.1%)
Preschool, kindergarten, elementary, and middle school teachers (5.2%)
Nursing, psychiatric, and home health aides (3.8%)
Other office and administrative support workers, including supervisors (3.4%)
Other sales and related occupations, including supervisors (3.0%)
Air pollution and air quality trends(lower is better)
AQI Ozone
Tornado activity:
Asheboro-area historical tornado activity is near North Carolina state average. It is 10% smaller than the overall U.S. average.
On 10/7/1965, a category F3 (max. wind speeds 158-206 mph) tornado 4.6 miles away from the Asheboro city center killed one person and injured 4 people and caused between $5000 and $50,000 in damages.
On 5/22/1985, a category F3 tornado 33.5 miles away from the city center caused between $500,000 and $5,000,000 in damages.
Earthquake activity:
Asheboro-area historical earthquake activity is significantly above North Carolina state average. It is 34% smaller than the overall U.S. average. On 8/23/2011 at 17:51:04, a magnitude 5.8 (5.8 MW, Depth: 3.7 mi, Class: Moderate, Intensity: VI - VII) earthquake occurred 183.9 miles away from the city center On 8/9/2020 at 12:07:37, a magnitude 5.1 (5.1 MW, Depth: 4.7 mi) earthquake occurred 88.8 miles away from Asheboro center On 8/2/1974 at 08:52:09, a magnitude 4.9 (4.3 MB, 4.9 LG, Class: Light, Intensity: IV - V) earthquake occurred 198.3 miles away from the city center On 7/27/1980 at 18:52:21, a magnitude 5.2 (5.1 MB, 4.7 MS, 5.0 UK, 5.2 UK) earthquake occurred 285.9 miles away from the city center On 11/22/1974 at 05:25:55, a magnitude 4.7 (4.7 MB) earthquake occurred 195.6 miles away from Asheboro center On 12/9/2003 at 20:59:14, a magnitude 4.5 (4.5 MB, 4.5 LG) earthquake occurred 167.3 miles away from the city center Magnitude types: regional Lg-wave magnitude (LG), body-wave magnitude (MB), surface-wave magnitude (MS), moment magnitude (MW) Natural disasters: The number of natural disasters in Randolph County (16) is near the US average (15).Major Disasters (Presidential) Declared: 8Emergencies Declared: 4Hurricanes: 7, Floods: 2, Storms: 2, Winter Storms: 2, Blizzard: 1, Drought: 1, Ice Storm: 1, Tornado: 1, Tropical Storm: 1, Other: 1 (Note: some incidents may be assigned to more than one category). Main business address for: FNB CORP/NC NATIONAL COMMERCIAL BANKS ).
Hospitals and medical centers in Asheboro: RANDOLPH HOSPITAL (Voluntary non-profit - Private, 364 WHITE OAK STREET) BRIAN CENTER OF ASHEBORO (230 E PRESNELL ST)
CLAPPS CONVALESCENT NH (500 MOUNTAIN TOP DRIVE)
RANDOLPH HEALTH AND REHABILITATION CENTER (230 EAST PRESNELL STREET)
WOODLAND HILL CARE AND REHABILITATION (400 VISION DRIVE)
BMA OF ASHEBORO INC (312 WEST WARD STREET)
GENTIVA HEALTH SERVICES/ASHEBO (1200 NORTH FAYETTEVILLE STREET)
HOME HEALTH OF RANDOLPH HOSPITAL (127 MACARTHUR STREET)
HOSPICE OF RANDOLPH COUNTY INC (416 VISION DRIVE)
Amtrak station near Asheboro: 20 miles: HIGH POINT (100 W. HIGH ST.) Services: partially wheelchair accessible, enclosed waiting area, public restrooms, public payphones, vending machines, paid short-term parking, paid long-term parking, call for car rental service, call for taxi service, public transit connection.
College/University in Asheboro: Randolph Community College Full-time enrollment: 2,528; Location: 629 Industrial Pk Ave; Public; Website: www.randolph.edu)
Other colleges/universities with over 2000 students near Asheboro:
Guilford Technical Community College (about 21 miles; Jamestown, NC ; Full-time enrollment: 13,068)
High Point University (about 21 miles; High Point, NC ; FT enrollment: 4,240)
Davidson County Community College (about 24 miles; Thomasville, NC ; FT enrollment: 3,581)
University of North Carolina at Greensboro (about 25 miles; Greensboro, NC ; FT enrollment: 16,174)
North Carolina A & T State University (about 26 miles; Greensboro, NC ; FT enrollment: 9,805)
Guilford College (about 27 miles; Greensboro, NC ; FT enrollment: 2,211)
Elon University (about 32 miles; Elon, NC ; FT enrollment: 6,403)
Public high schools in Asheboro:
Private high schools in Asheboro: FAYETTEVILLE STREET CHRISTIAN SCHOOL Students: 186, Location: 151 W PRITCHARD ST, Grades: PK-12)
NEIGHBORS GROVE CHRISTIAN ACADEMY Students: 151, Location: 1928 N FAYETTEVILLE ST, Grades: PK-12)
Biggest public elementary/middle schools in Asheboro: SOUTH ASHEBORO MIDDLE Location: 523 W WALKER AVE, Grades: 6-8)BALFOUR ELEMENTARY Location: 2097 N ASHEBORO SCHOOL RD, Grades: PK-5)CHARLES W MCCRARY ELEMENTARY Location: 400 ROSS ST, Grades: KG-5)DONNA L LOFLIN ELEMENTARY Location: 405 S PARK ST, Grades: KG-5)GUY B TEACHEY ELEMENTARY Location: 294 NEWBERN AVE, Grades: PK-5)LINDLEY PARK ELEMENTARY Location: 312 CLIFF RD, Grades: KG-5)NORTH ASHEBORO MIDDLE Location: 1861 N ASHEBORO SCHOOL RD, Grades: 6-8)FARMER ELEMENTARY Location: 3557 GRANGE HALL RD, Grades: KG-5)TABERNACLE ELEMENTARY Location: 4901 TABERNACLE SCHOOL RD, Grades: PK-5)SOUTHWESTERN RANDOLPH MIDDLE Location: 1509 HOPEWELL FRIENDS RD, Grades: 6-8)
Private elementary/middle schools in Asheboro: AGAPE CHRISTIAN ACADEMY Students: 65, Location: 1629 BROWERS CHAPEL RD, Grades: KG-7)
CALVARY CHRISTIAN ACADEMY Students: 12, Location: 1424 NC HIGHWAY 42 S, Grades: KG-8)
See full list of schools located in Asheboro Library in Asheboro: RANDOLPH PUBLIC LIBRARY Operating income: $2,427,704; Location: 201 WORTH STREET; 245,561 books ; 7,736 audio materials ; 13,513 video materials ; 9 local licensed databases ; 56 state licensed databases ; 1 other licensed databases ; 644 print serial subscriptions ; 4 electronic serial subscriptions )
Notable locations in Asheboro: (A) , Randolph County Court House (B) , Asheboro City Hall (C) . Display/hide their locations on the map
Shopping Centers: (1) , Northgate Shopping Center (2) , Hillside Shopping Center (3) , Hammer Village Shopping Center (4) . Display/hide their locations on the map
Main business address in Asheboro: (A) . Display/hide its location on the map
Churches in Asheboro include: (A) , Forest Park Church (B) . Display/hide their locations on the map
Cemeteries: (1) , Randolph Memorial Park (2) . Display/hide their locations on the map
Reservoirs: (A) , W A McCrary Lake (B) , Richardson Lake (C) . Display/hide their locations on the map
Tourist attractions: (1) , Dial A Story (Cultural Attractions- Events- & Facilities; 201 Worth Street) (2) , Bally's Aladdin's Castle - Randolph Mall (Amusement & Theme Parks; Randolph Mall) (3) . Display/hide their approximate locations on the map
Hotels: (1) , Days Inn (901 Albemarle Rd) (2) , Comfort Inn Asheboro (242 Lakecrest Road) (3) . Display/hide their approximate locations on the map
Courts: (1) , Coble Howard Congressman (241 Sunset Avenue) (2) , Clerk Of Court - Bookkeeping (Courthouse) (3) , Hanover Court (731 West Kivett) (4) , Randolph County Court System - Adult Parole (Courthouse) (5) , District Attorney (176 East Salisbury Street) (6) , Randolph County Court System - Randolph County Courthouse- Clerk Of Superior Court- Administra (Courthouse) (7) , Magistrate (Courthouse) (8) , District Court Judges (176 East Salisbury Street) (9) . Display/hide their approximate locations on the map
Birthplace of: Brad Cain - Professional wrestler and novelist, Mark Kemp - Music critic, Andy Headen - Football player.
Randolph County has a predicted average indoor radon screening level less than 2 pCi/L (pico curies per liter) - Low Potential Drinking water stations with addresses in Asheboro and their reported violations in the past:
CHILTON`S MHP (TROY) (Population served: 89, Groundwater):
Past monitoring violations:
Monitoring and Reporting (DBP) - Between OCT-2010 and DEC-2010, Contaminant: Chlorine. Follow-up actions: St Public Notif requested (FEB-09-2011), St Formal NOV issued (FEB-09-2011), St AO (w/o penalty) issued (FEB-09-2011), St Public Notif received (MAY-26-2011), St Compliance achieved (AUG-01-2012)
Monitoring and Reporting (DBP) - Between JAN-2009 and MAR-2009, Contaminant: Chlorine. Follow-up actions: St Formal NOV issued (JUN-19-2009), St Public Notif requested (JUN-19-2009), St Compliance achieved (JUL-01-2010)
2 routine major monitoring violations
Population served: 25, Groundwater):
Past monitoring violations:
Monitoring, Repeat Major (TCR) - In AUG-2005, Contaminant: Coliform (TCR). Follow-up actions: St Public Notif requested (SEP-26-2005), St Formal NOV issued (OCT-05-2005), St Intentional no-action (JUN-11-2010), St Compliance achieved (JUN-11-2010)
2 routine major monitoring violations
Population served: 25, Groundwater):
Past health violations:
MCL, Monthly (TCR) - In JUL-2009, Contaminant: Coliform. Follow-up actions: St Public Notif requested (JUL-21-2009), St Formal NOV issued (JUL-21-2009), St Compliance achieved (FEB-04-2010), St Public Notif received (MAY-19-2011)
MCL, Monthly (TCR) - Between APR-2009 and JUN-2009, Contaminant: Coliform. Follow-up actions: St Public Notif requested (JUL-08-2009), St Formal NOV issued (JUL-08-2009), St Compliance achieved (FEB-04-2010)
MCL, Monthly (TCR) - In OCT-2008, Contaminant: Coliform. Follow-up actions: St Public Notif requested (OCT-07-2008), St Formal NOV issued (OCT-07-2008), St Public Notif received (OCT-22-2008), St Compliance achieved (FEB-04-2010)
MCL, Single Sample - Between JAN-2008 and DEC-2008, Contaminant: Nitrate. Follow-up actions: St Public Notif requested (DEC-03-2008), St Formal NOV issued (DEC-03-2008), St AO (w/o penalty) issued (DEC-03-2008), St Tech Assistance Visit (DEC-03-2008), St Compliance achieved (JAN-28-2013)
MCL, Monthly (TCR) - Between JAN-2008 and MAR-2008, Contaminant: Coliform. Follow-up actions: St Public Notif requested (MAR-25-2008), St Formal NOV issued (MAR-25-2008), St Compliance achieved (FEB-04-2010)
MCL, Monthly (TCR) - Between OCT-2007 and DEC-2007, Contaminant: Coliform. Follow-up actions: St Public Notif requested (NOV-06-2007), St Formal NOV issued (NOV-06-2007), St Public Notif received (NOV-29-2007), St Compliance achieved (FEB-04-2010)
Past monitoring violations:
Monitoring, Repeat Major (TCR) - Between APR-2009 and JUN-2009, Contaminant: Coliform (TCR). Follow-up actions: St Formal NOV issued (OCT-22-2009), St Public Notif requested (OCT-22-2009), St AO (w/penalty) issued (JAN-22-2010), St Compliance achieved (FEB-04-2010)
Monitoring, Repeat Major (TCR) - Between JUL-2008 and SEP-2008, Contaminant: Coliform (TCR). Follow-up actions: St Formal NOV issued (FEB-10-2009), St Public Notif requested (FEB-10-2009), St AO (w/penalty) issued (JAN-22-2010), St Compliance achieved (FEB-04-2010)
2 routine major monitoring violations
One minor monitoring violation
Population served: 25, Groundwater):
Past health violations:
MCL, Monthly (TCR) - Between JUL-2012 and SEP-2012, Contaminant: Coliform. Follow-up actions: St Formal NOV issued (SEP-25-2012), St Public Notif requested (SEP-25-2012), St AO (w/o penalty) issued (SEP-25-2012), St Public Notif received (SEP-27-2012), St Compliance achieved (OCT-31-2012)
Past monitoring violations:
One regular monitoring violation
Population served: 25, Groundwater):
Past health violations:
MCL, Monthly (TCR) - Between JUL-2014 and SEP-2014, Contaminant: Coliform. Follow-up actions: St AO (w/o penalty) issued (AUG-28-2014), St Public Notif requested (AUG-28-2014), St Formal NOV issued (AUG-28-2014)
MCL, Monthly (TCR) - Between OCT-2009 and DEC-2009, Contaminant: Coliform. Follow-up actions: St Public Notif requested (OCT-14-2009), St Formal NOV issued (OCT-14-2009), St Compliance achieved (APR-21-2010)
Population served: 25, Groundwater):
Past monitoring violations:
2 routine major monitoring violations
Population served: 25, Groundwater):
Past health violations:
MCL, Monthly (TCR) - Between JAN-2013 and MAR-2013, Contaminant: Coliform. Follow-up actions: St Public Notif requested (JAN-11-2013), St Formal NOV issued (JAN-11-2013), St AO (w/o penalty) issued (JAN-11-2013), St Public Notif received (JAN-14-2013), St Compliance achieved (FEB-28-2013)
MCL, Monthly (TCR) - In SEP-2012, Contaminant: Coliform. Follow-up actions: St Public Notif requested (SEP-25-2012), St Formal NOV issued (SEP-25-2012), St AO (w/o penalty) issued (SEP-25-2012), St Public Notif received (OCT-29-2012), St Compliance achieved (FEB-28-2013)
MCL, Monthly (TCR) - In AUG-2012, Contaminant: Coliform. Follow-up actions: St Public Notif requested (AUG-22-2012), St Formal NOV issued (AUG-22-2012), St AO (w/o penalty) issued (AUG-22-2012), St Public Notif received (SEP-12-2012), St Compliance achieved (FEB-28-2013)
MCL, Monthly (TCR) - Between OCT-2009 and DEC-2009, Contaminant: Coliform. Follow-up actions: St Public Notif requested (DEC-30-2009), St Formal NOV issued (DEC-30-2009), St Compliance achieved (JUL-29-2010)
MCL, Monthly (TCR) - In SEP-2009, Contaminant: Coliform. Follow-up actions: St Public Notif requested (JAN-20-2010), St Formal NOV issued (JAN-20-2010), St Public Notif received (JAN-26-2010), St Compliance achieved (JUL-29-2010)
MCL, Monthly (TCR) - Between OCT-2008 and DEC-2008, Contaminant: Coliform. Follow-up actions: St Public Notif requested (OCT-24-2008), St Formal NOV issued (OCT-24-2008), St Compliance achieved (SEP-13-2010)
Past monitoring violations:
6 routine major monitoring violations
2 regular monitoring violations
Population served: 25, Groundwater):
Past monitoring violations:
2 routine major monitoring violations
Drinking water stations with addresses in Asheboro that have no violations reported:
ASHEBORO, CITY OF (Population served: 28,047, Primary Water Source Type: Surface water)
UNION GROVE CHRISTIAN CHURCH (Population served: 50, Primary Water Source Type: Groundwater)
HIGH PINE WESLEYAN CHURCH (Population served: 25, Primary Water Source Type: Groundwater)
Average household size: This city:
2.5 peopleNorth Carolina:
2.5 people
Percentage of family households: This city:
61.7%Whole state:
66.7%
Percentage of households with unmarried partners: This city:
6.9%Whole state:
5.9%
Likely homosexual households (counted as self-reported same-sex unmarried-partner households)
Lesbian couples: 0.4% of all households Gay men: 0.2% of all households
People in group quarters in Asheboro in 2010:
357 people in nursing facilities/skilled-nursing facilities
197 people in local jails and other municipal confinement facilities
40 people in group homes intended for adults
35 people in other noninstitutional facilities
19 people in emergency and transitional shelters (with sleeping facilities) for people experiencing homelessness
11 people in residential treatment centers for juveniles (non-correctional)
6 people in residential treatment centers for adults
People in group quarters in Asheboro in 2000:
349 people in nursing homes
214 people in state prisons
29 people in other noninstitutional group quarters
10 people in homes for the mentally retarded
8 people in homes or halfway houses for drug/alcohol abuse
8 people in homes for the mentally ill
4 people in other group homes
Banks with most branches in Asheboro (2011 data):
Randolph Bank & Trust Company: Dixie Drive Branch, West Pointe Village Branch, at 175 North Fayetteville Street. Info updated 2008/03/11: Bank assets: $288.8 mil, Deposits: $254.4 mil, local headquarters , negative income in the last year , Commercial Lending Specialization, 6 total offices
Communityone Bank, National Association: South Asheboro Branch, North Asheboro Branch, at 101 Sunset Avenue. Info updated 2007/12/11: Bank assets: $1,666.0 mil, Deposits: $1,443.4 mil, local headquarters , negative income in the last year , 46 total offices , Holding Company: Fnb United Corp.
Wells Fargo Bank, National Association: Asheboro Main at 15 South Fayetteville Street, branch established on 1963/11/22; Randolph Mall Branch at 1421 East Dixie Drive, branch established on 1970/03/16. Info updated 2011/04/05: Bank assets: $1,161,490.0 mil, Deposits: $905,653.0 mil, headquarters in Sioux Falls, SD, positive income , 6395 total offices , Holding Company: Wells Fargo & Company
PNC Bank, National Association: 1427 E. Dixie Drive Branch at 1427 E. Dixie Drive, branch established on 1987/06/30; First Southern Branch at 115 South Fayetteville Street, branch established on 1917/01/01. Info updated 2012/03/20: Bank assets: $263,309.6 mil, Deposits: $197,343.0 mil, headquarters in Wilmington, DE, positive income , Commercial Lending Specialization, 3085 total offices , Holding Company: Pnc Financial Services Group, Inc., The
SunTrust Bank: Hammer Village Branch 161 at 901 East Dixie Drive, branch established on 1990/08/06; Asheboro Branch 160 at 272 North Fayetteville Street, branch established on 1973/12/17. Info updated 2010/05/27: Bank assets: $171,291.7 mil, Deposits: $129,833.2 mil, headquarters in Atlanta, GA, positive income , Commercial Lending Specialization, 1716 total offices , Holding Company: Suntrust Banks, Inc.
First Bank: North Asheboro Branch at 1724 North Fayetteville Street, branch established on 1998/08/17; Main Asheboro Branch at 176 North Fayetteville Street, branch established on 1972/03/06. Info updated 2011/01/25: Bank assets: $3,289.4 mil, Deposits: $2,759.1 mil, headquarters in Troy, NC, positive income , Commercial Lending Specialization, 98 total offices , Holding Company: First Bancorp
Branch Banking and Trust Company: Asheboro Main Branch at 261 North Fayetteville Street, branch established on 1987/03/16. Info updated 2010/03/29: Bank assets: $168,867.6 mil, Deposits: $127,549.5 mil, headquarters in Winston Salem, NC, positive income , Commercial Lending Specialization, 1793 total offices , Holding Company: Bb&T Corporation
Carolina Bank: Asheboro Office at 335 S. Fayetteville Street, branch established on 2004/03/01. Info updated 2009/03/11: Bank assets: $673.1 mil, Deposits: $597.8 mil, headquarters in Greensboro, NC, positive income , Commercial Lending Specialization, 8 total offices , Holding Company: Carolina Bank Holdings, Inc.
Woodforest National Bank: Asheboro Wal-Mart Branch at 1226 East Dixie Drive, branch established on 2006/05/03. Info updated 2011/05/10: Bank assets: $3,488.9 mil, Deposits: $3,097.6 mil, headquarters in Houston, TX, positive income , Commercial Lending Specialization, 766 total offices , Holding Company: Woodforest Financial Group Employee Stock Ownership Plan (With 401(K) Provisions)
2 other banks with 2 local branches
For population 15 years and over in Asheboro:
Never married: 33.5%Now married: 42.7%Separated: 2.4%Widowed: 8.2%Divorced: 13.1% For population 25 years and over in Asheboro:
High school or higher: 82.2%Bachelor's degree or higher: 18.7%Graduate or professional degree: 6.0%Unemployed: 4.8%Mean travel time to work (commute): 22.7 minutes
Education Gini index (Inequality in education) Here:
13.0North Carolina average:
11.7
Religion statistics for Asheboro, NC (based on Randolph County data)
Religion Adherents Congregations Evangelical Protestant 29,662 162 Mainline Protestant 17,614 94 Catholic 1,585 1 Other 904 6 Black Protestant 814 6 None 92,070 -
Source: Clifford Grammich, Kirk Hadaway, Richard Houseal, Dale E.Jones, Alexei Krindatch, Richie Stanley and Richard H.Taylor. 2012. 2010 U.S.Religion Census: Religious Congregations & Membership Study. Association of Statisticians of American Religious Bodies. Jones, Dale E., et al. 2002. Congregations and Membership in the United States 2000. Nashville, TN: Glenmary Research Center. Graphs represent county-level data
Food Environment Statistics: Number of grocery stores : 22Randolph County :
1.58 / 10,000 pop.North Carolina :
2.05 / 10,000 pop.
Number of supercenters and club stores : 2This county :
0.14 / 10,000 pop.State :
0.14 / 10,000 pop.
Number of convenience stores (no gas) : 9Randolph County :
0.65 / 10,000 pop.North Carolina :
0.92 / 10,000 pop.
Number of convenience stores (with gas) : 58Randolph County :
4.16 / 10,000 pop.State :
4.75 / 10,000 pop.
Number of full-service restaurants : 74Here :
5.30 / 10,000 pop.State :
7.57 / 10,000 pop.
Adult diabetes rate : This county :
10.2%North Carolina :
9.8%
Adult obesity rate : Randolph County :
28.9%North Carolina :
28.3%
Low-income preschool obesity rate : This county :
18.3%State :
15.6%
Health and Nutrition: Healthy diet rate : Asheboro:
47.1%North Carolina:
48.9%
Average overall health of teeth and gums : Asheboro:
43.5%State:
46.1%
People feeling badly about themselves : This city:
21.6%North Carolina:
20.7%
People not drinking alcohol at all : Asheboro:
11.0%North Carolina:
10.7%
Average hours sleeping at night : Overweight people : Asheboro:
31.8%North Carolina:
33.7%
General health condition : Asheboro:
53.8%North Carolina:
55.8%
Average condition of hearing : More about Health and Nutrition of Asheboro, NC Residents
Local government employment and payroll (March 2022)
Function
Full-time employees
Monthly full-time payroll
Average yearly full-time wage
Part-time employees
Monthly part-time payroll
Police Protection - Officers
79 $350,336 $53,216 0 $0 Other and Unallocable
57 $244,141 $51,398 16 $10,183 Firefighters
53 $220,274 $49,873 0 $0 Sewerage
45 $160,549 $42,813 2 $1,298 Water Supply
30 $113,166 $45,266 2 $521 Streets and Highways
26 $94,920 $43,809 1 $1,907 Parks and Recreation
18 $64,780 $43,187 25 $15,854 Solid Waste Management
13 $41,186 $38,018 2 $1,807 Fire - Other
10 $60,064 $72,077 0 $0 Other Government Administration
10 $65,762 $78,914 15 $8,686 Police - Other
9 $27,600 $36,800 5 $3,204 Financial Administration
8 $46,199 $69,299 0 $0 Judicial and Legal
3 $20,360 $81,440 0 $0
Totals for Government
361 $1,509,336 $50,172 68 $43,459
Asheboro government finances - Expenditure in 2021 (per resident):
Construction - Air Transportation: $117,000 ($4.26)
Current Operations - Police Protection: $8,619,000 ($313.62)
Sewerage: $6,743,000 ($245.36)General - Other: $5,420,000 ($197.22)Local Fire Protection: $5,402,000 ($196.57)Water Utilities: $5,072,000 ($184.56)Parks and Recreation: $3,791,000 ($137.94)Liquor Stores: $3,194,000 ($116.22)Regular Highways: $2,403,000 ($87.44)Solid Waste Management: $1,802,000 ($65.57)Transit Utilities: $1,130,000 ($41.12)Housing and Community Development: $549,000 ($19.98)Financial Administration: $446,000 ($16.23)Protective Inspection and Regulation - Other: $382,000 ($13.90)Central Staff Services: $332,000 ($12.08)Judicial and Legal Services: $231,000 ($8.41)Air Transportation: $153,000 ($5.57)Libraries: $131,000 ($4.77)General Public Buildings: $99,000 ($3.60)Health - Other: $42,000 ($1.53)General - Interest on Debt: $58,000 ($2.11)
Intergovernmental to Local - Other - Health - Other: $14,000 ($0.51)
Other Capital Outlay - Local Fire Protection: $833,000 ($30.31)
Sewerage: $602,000 ($21.91)Police Protection: $500,000 ($18.19)Regular Highways: $363,000 ($13.21)Solid Waste Management: $218,000 ($7.93)General Public Building: $136,000 ($4.95)Water Utilities: $111,000 ($4.04)Parks and Recreation: $101,000 ($3.68)General - Other: $87,000 ($3.17)Air Transportation: $18,000 ($0.65)Transit Utilities: $17,000 ($0.62)Total Salaries and Wages: $571,000 ($20.78)
Water Utilities - Interest on Debt: $60,000 ($2.18)
Asheboro government finances - Revenue in 2021 (per resident):
Charges - Sewerage: $5,099,000 ($185.54)
Solid Waste Management: $1,903,000 ($69.25)Parks and Recreation: $335,000 ($12.19)Air Transportation: $19,000 ($0.69)Miscellaneous Commercial Activities: $12,000 ($0.44)Local Intergovernmental - General Local Government Support: $37,000 ($1.35)
Other: $8,000 ($0.29)Miscellaneous - General Revenue - Other: $1,341,000 ($48.80)
Interest Earnings: $22,000 ($0.80)Revenue - Water Utilities: $6,518,000 ($237.17)
Liquor Stores: $3,954,000 ($143.88)State Intergovernmental - General Local Government Support: $2,999,000 ($109.13)
Highways: $674,000 ($24.53)Other: $669,000 ($24.34)Tax - Property: $17,299,000 ($629.47)
General Sales and Gross Receipts: $7,633,000 ($277.75)Alcoholic Beverage Sales: $442,000 ($16.08)Occupation and Business License - Other: $202,000 ($7.35)Motor Vehicle License: $41,000 ($1.49)Other License: $2,000 ($0.07)
Asheboro government finances - Debt in 2021 (per resident):
Long Term Debt - Beginning Outstanding - Unspecified Public Purpose: $4,013,000 ($146.02)
Outstanding Unspecified Public Purpose: $3,544,000 ($128.96)Retired Unspecified Public Purpose: $469,000 ($17.07)
Businesses in Asheboro, NC
Name Count Name Count
ALDI 1 La-Z-Boy 1 AT&T 1 Little Caesars Pizza 1 Advance Auto Parts 2 Lowe's 1 Aeropostale 1 Marriott 1 American Eagle Outfitters 1 Maurices 1 Arby's 1 McDonald's 2 AutoZone 1 New Balance 1 Bath & Body Works 1 Nike 1 Blockbuster 1 Nissan 1 Burger King 1 Papa John's Pizza 1 CVS 2 Payless 1 Chevrolet 1 Penske 1 Chick-Fil-A 2 Pizza Hut 1 Comfort Inn 1 Quality 1 Cricket Wireless 2 RadioShack 1 Curves 1 Rite Aid 1 Domino's Pizza 1 Rue21 1 Dunkin Donuts 2 Sears 2 FedEx 5 Sprint Nextel 1 Foot Locker 1 Staples 1 Ford 1 Subaru 1 GNC 1 T-Mobile 3 GameStop 2 Taco Bell 1 Goodwill 4 Toyota 1 H&R Block 2 U-Haul 3 Hilton 1 UPS 7 Hobby Lobby 1 Vans 1 Holiday Inn 1 Verizon Wireless 2 Honda 1 Waffle House 1 IHOP 1 Walgreens 1 JCPenney 1 Walmart 1 Jones New York 4 Wendy's 2 KFC 1 YMCA 1 Kincaid 1
Strongest AM radio stations in Asheboro:
WKXR (1260 AM; 5 kW; ASHEBORO, NC; Owner: RANDOLPH BROADCASTING, INC.)
WZOO (710 AM; daytime; 1 kW; ASHEBORO, NC; Owner: FAITH ENTERPRISES, INC.)
WTRU (830 AM; 50 kW; KERNERSVILLE, NC; Owner: TRUTH BROADCASTING CORPORATION)
WPTF (680 AM; 50 kW; RALEIGH, NC; Owner: FIRST STATE COMMUNICATIONS)
WFTK (1030 AM; daytime; 50 kW; WAKE FOREST, NC; Owner: POSITIVE RADIO GROUP, INC.)
WBT (1110 AM; 50 kW; CHARLOTTE, NC; Owner: JEFFERSON-PILOT COMMUNICATNS CO. OF NORTH CAROLINA)
WWBG (1470 AM; 10 kW; GREENSBORO, NC; Owner: TRUTH BROADCASTING COPORATION)
WSML (1200 AM; 10 kW; GRAHAM, NC; Owner: INFINITY RADIO OPERATIONS INC.)
WIST (790 AM; 2 kW; THOMASVILLE, NC; Owner: GHB RADIO, INC.)
WHKY (1290 AM; 50 kW; HICKORY, NC; Owner: LONG COMMUNICATIONS, LLC.)
WLXN (1440 AM; 5 kW; LEXINGTON, NC; Owner: DAVIDSON COUNTY BROADCASTING COMPANY, INC.)
WEEB (990 AM; 10 kW; SOUTHERN PINES, NC; Owner: PINEHURST BROADCASTING CORP.)
WPCM (920 AM; 5 kW; BURLINGTON-GRAHAM, NC; Owner: CAROLINA RADIO GROUP, INC.)
Strongest FM radio stations in Asheboro:
WKRR (92.3 FM; ASHEBORO, NC; Owner: DICK BROADCASTING COMPANY, INC. OF TENNESSEE)
WMAG (99.5 FM; HIGH POINT, NC; Owner: CAPSTAR TX LIMITED PARTNERSHIP)
WTJY (89.5 FM; ASHEBORO, NC; Owner: POSITIVE ALTERNATIVE RADIO, INC.)
WQMG-FM (97.1 FM; GREENSBORO, NC; Owner: ENTERCOM GREENSBORO LICENSE, LLC)
WOZN (98.7 FM; GREENSBORO, NC; Owner: ENTERCOM GREENSBORO LICENSE, LLC)
WVBZ (100.3 FM; HIGH POINT, NC; Owner: CAPSTAR TX LIMITED PARTNERSHIP)
WKXU (101.1 FM; BURLINGTON, NC; Owner: CAROLINA RADIO GROUP, INC.)
WFDD (88.5 FM; WINSTON-SALEM, NC; Owner: WAKE FOREST UNIVERSITY)
WRSN (93.9 FM; BURLINGTON, NC; Owner: CAPSTAR TX LIMITED PARTNERSHIP)
WUNC (91.5 FM; CHAPEL HILL, NC; Owner: BOARD OF TRUSTEES UNIVERSITY OF NC AT CHAPEL HILL)
WHPE-FM (95.5 FM; HIGH POINT, NC; Owner: BIBLE BROADCASTING NETWORK, INC.)
WKZL (107.5 FM; WINSTON-SALEM, NC; Owner: DICK BROADCASTING COMPANY, INC. OF TENNESSEE)
WJMH (102.1 FM; REIDSVILLE, NC; Owner: ENTERCOM GREENSBORO LICENSE, LLC)
WIST-FM (98.3 FM; THOMASVILLE, NC; Owner: WEAM QUALITY RADIO CORP.)
WMQX-FM (93.1 FM; WINSTON-SALEM, NC; Owner: ENTERCOM GREENSBORO LICENSE, LLC)
WDCG (105.1 FM; DURHAM, NC; Owner: CAPSTAR TX LIMITED PARTNERSHIP)
WFMX (105.7 FM; STATESVILLE, NC; Owner: MERCURY BROADCASTING COMPANY, INC.)
WQDR (94.7 FM; RALEIGH, NC; Owner: CAROLINA MEDIA GROUP, INC.)
WGBT (94.5 FM; EDEN, NC; Owner: CLEAR CHANNEL BROADCASTING LICENSES, INC.)
WNAA (90.1 FM; GREENSBORO, NC; Owner: NC AGRICULTURAL & TECHNICAL STATE UNIVERSITY)
TV broadcast stations around Asheboro:
WFMY-TV (Channel 2; GREENSBORO, NC; Owner: WFMY TELEVISION CORPORATION)
WGHP (Channel 8; HIGH POINT, NC; Owner: WGHP LICENSE, INC.)
WUPN-TV (Channel 48; GREENSBORO, NC; Owner: WUPN LICENSEE, LLC)
WXLV-TV (Channel 45; WINSTON-SALEM, NC; Owner: WXLV LICENSEE, LLC)
WTWB-TV (Channel 20; LEXINGTON, NC; Owner: WTWB OF THE TRIAD, LLC)
WLXI-TV (Channel 61; GREENSBORO, NC; Owner: TRI-STATE CHRISTIAN TV, INC.)
WUNC-TV (Channel 4; CHAPEL HILL, NC; Owner: UNIVERSITY OF NORTH CAROLINA)
WUVC (Channel 40; FAYETTEVILLE, NC; Owner: CAPITAL BROADCASTING PARTNERS)
WRAZ (Channel 50; RALEIGH, NC; Owner: WRAZ-TV, INC.)
WAXN (Channel 64; KANNAPOLIS, NC; Owner: WSOC-TV HOLDINGS, INC.)
WUNG-TV (Channel 58; CONCORD, NC; Owner: UNIVERSITY OF NORTH CAROLINA)
WGPX (Channel 16; BURLINGTON, NC; Owner: PAXSON GREENSBORO LICENSE, INC.)
National Bridge Inventory (NBI) Statistics 204 Number of bridges1,745ft / 532m Total length1,430,273 Total average daily traffic196,290 Total average daily truck traffic
New bridges - historical statistics
5 1920-1929 2 1930-1939 24 1950-1959 45 1960-1969 15 1970-1979 10 1980-1989 17 1990-1999 18 2000-2009 61 2010-2019 7 2020-2022
See full National Bridge Inventory statistics for Asheboro, NC
Home Mortgage Disclosure Act Aggregated Statistics For Year 2009(Based on 1 full and 12 partial tracts) A) FHA, FSA/RHS & VA B) Conventional C) Refinancings D) Home Improvement Loans E) Loans on Dwellings For 5+ Families F) Non-occupant Loans on G) Loans On Manufactured Number Average Value Number Average Value Number Average Value Number Average Value Number Average Value Number Average Value Number Average Value
LOANS ORIGINATED 28 $104,053 44 $112,076 131 $110,764 9 $27,051 5 $1,155,918 27 $125,455 2 $184,275 APPLICATIONS APPROVED, NOT ACCEPTED 1 $113,160 1 $35,320 8 $95,591 2 $17,195 0 $0 0 $0 0 $0 APPLICATIONS DENIED 3 $109,087 11 $86,432 57 $98,151 4 $23,742 0 $0 6 $91,368 3 $87,833 APPLICATIONS WITHDRAWN 4 $73,662 4 $123,655 28 $137,298 3 $44,740 0 $0 4 $108,600 0 $0 FILES CLOSED FOR INCOMPLETENESS 1 $108,450 2 $86,295 7 $125,679 0 $0 0 $0 0 $0 1 $36,390
Aggregated Statistics For Year 2008(Based on 1 full and 12 partial tracts) A) FHA, FSA/RHS & VA B) Conventional C) Refinancings D) Home Improvement Loans E) Loans on Dwellings For 5+ Families F) Non-occupant Loans on G) Loans On Manufactured Number Average Value Number Average Value Number Average Value Number Average Value Number Average Value Number Average Value Number Average Value
LOANS ORIGINATED 29 $113,228 65 $107,095 118 $106,856 15 $43,837 2 $320,765 58 $110,023 6 $63,148 APPLICATIONS APPROVED, NOT ACCEPTED 2 $122,525 6 $77,928 18 $85,687 1 $9,970 0 $0 3 $44,437 2 $53,430 APPLICATIONS DENIED 3 $96,690 14 $81,240 88 $113,817 14 $35,316 0 $0 6 $110,912 5 $65,588 APPLICATIONS WITHDRAWN 1 $149,190 8 $117,186 31 $114,405 1 $90,360 0 $0 2 $140,020 1 $65,300 FILES CLOSED FOR INCOMPLETENESS 1 $52,710 1 $183,660 7 $104,337 1 $50,000 0 $0 0 $0 0 $0
Aggregated Statistics For Year 2007(Based on 1 full and 12 partial tracts) A) FHA, FSA/RHS & VA B) Conventional C) Refinancings D) Home Improvement Loans E) Loans on Dwellings For 5+ Families F) Non-occupant Loans on G) Loans On Manufactured Number Average Value Number Average Value Number Average Value Number Average Value Number Average Value Number Average Value Number Average Value
LOANS ORIGINATED 11 $109,906 108 $103,237 109 $99,189 18 $29,573 2 $735,850 60 $87,761 4 $46,742 APPLICATIONS APPROVED, NOT ACCEPTED 1 $96,110 8 $94,911 9 $99,918 3 $24,427 0 $0 4 $81,930 1 $49,690 APPLICATIONS DENIED 10 $102,570 24 $96,816 87 $95,479 19 $37,922 1 $160,880 5 $93,902 7 $66,851 APPLICATIONS WITHDRAWN 2 $82,535 12 $101,542 39 $102,304 4 $79,180 0 $0 6 $78,463 1 $107,080 FILES CLOSED FOR INCOMPLETENESS 0 $0 4 $109,635 4 $136,405 0 $0 0 $0 0 $0 0 $0
Aggregated Statistics For Year 2006(Based on 1 full and 12 partial tracts) A) FHA, FSA/RHS & VA B) Conventional C) Refinancings D) Home Improvement Loans E) Loans on Dwellings For 5+ Families F) Non-occupant Loans on G) Loans On Manufactured Number Average Value Number Average Value Number Average Value Number Average Value Number Average Value Number Average Value Number Average Value
LOANS ORIGINATED 31 $104,330 131 $102,536 124 $95,229 24 $55,769 6 $475,895 63 $104,664 8 $72,092 APPLICATIONS APPROVED, NOT ACCEPTED 1 $120,610 15 $84,801 22 $87,412 3 $30,617 1 $509,000 4 $66,242 6 $40,157 APPLICATIONS DENIED 2 $86,345 62 $92,050 96 $91,579 23 $59,931 0 $0 10 $126,839 28 $54,231 APPLICATIONS WITHDRAWN 2 $113,075 23 $95,764 59 $101,380 7 $84,474 0 $0 4 $94,562 1 $60,430 FILES CLOSED FOR INCOMPLETENESS 1 $111,090 3 $153,077 16 $105,236 0 $0 0 $0 3 $182,063 0 $0
Aggregated Statistics For Year 2005(Based on 1 full and 12 partial tracts) A) FHA, FSA/RHS & VA B) Conventional C) Refinancings D) Home Improvement Loans E) Loans on Dwellings For 5+ Families F) Non-occupant Loans on G) Loans On Manufactured Number Average Value Number Average Value Number Average Value Number Average Value Number Average Value Number Average Value Number Average Value
LOANS ORIGINATED 19 $105,469 138 $99,029 138 $98,899 22 $31,745 9 $796,086 59 $116,375 6 $50,255 APPLICATIONS APPROVED, NOT ACCEPTED 1 $115,960 15 $69,016 28 $90,634 2 $48,705 0 $0 4 $88,182 4 $47,085 APPLICATIONS DENIED 4 $49,748 49 $66,080 122 $95,302 21 $40,727 0 $0 9 $54,502 39 $48,770 APPLICATIONS WITHDRAWN 3 $105,670 11 $92,115 62 $98,465 9 $105,661 0 $0 3 $83,900 2 $64,340 FILES CLOSED FOR INCOMPLETENESS 0 $0 5 $80,602 13 $97,414 0 $0 0 $0 1 $14,670 0 $0
Aggregated Statistics For Year 2004(Based on 1 full and 12 partial tracts) A) FHA, FSA/RHS & VA B) Conventional C) Refinancings D) Home Improvement Loans E) Loans on Dwellings For 5+ Families F) Non-occupant Loans on G) Loans On Manufactured Number Average Value Number Average Value Number Average Value Number Average Value Number Average Value Number Average Value Number Average Value
LOANS ORIGINATED 27 $98,103 129 $100,382 155 $91,712 22 $30,765 3 $1,137,843 70 $98,521 8 $57,506 APPLICATIONS APPROVED, NOT ACCEPTED 2 $86,600 9 $75,196 21 $75,698 1 $77,640 0 $0 2 $47,610 5 $40,544 APPLICATIONS DENIED 7 $75,213 46 $54,942 112 $85,146 19 $36,746 0 $0 4 $47,335 36 $40,800 APPLICATIONS WITHDRAWN 6 $88,902 7 $112,133 81 $97,291 3 $22,670 0 $0 2 $52,155 2 $64,135 FILES CLOSED FOR INCOMPLETENESS 0 $0 0 $0 9 $100,484 0 $0 0 $0 0 $0 0 $0
Aggregated Statistics For Year 2003(Based on 1 full and 12 partial tracts) A) FHA, FSA/RHS & VA B) Conventional C) Refinancings D) Home Improvement Loans E) Loans on Dwellings For 5+ Families F) Non-occupant Loans on Number Average Value Number Average Value Number Average Value Number Average Value Number Average Value Number Average Value
LOANS ORIGINATED 33 $98,243 108 $86,311 340 $94,095 21 $26,203 2 $355,130 78 $69,885 APPLICATIONS APPROVED, NOT ACCEPTED 1 $123,640 16 $69,676 26 $86,800 2 $24,660 0 $0 2 $96,485 APPLICATIONS DENIED 4 $77,312 73 $54,422 106 $87,552 14 $17,885 0 $0 5 $87,300 APPLICATIONS WITHDRAWN 4 $90,412 10 $105,905 61 $95,494 4 $59,702 0 $0 3 $79,037 FILES CLOSED FOR INCOMPLETENESS 1 $45,200 2 $89,930 11 $131,344 0 $0 0 $0 0 $0
Aggregated Statistics For Year 2002(Based on 1 full and 12 partial tracts) A) FHA, FSA/RHS & VA B) Conventional C) Refinancings D) Home Improvement Loans E) Loans on Dwellings For 5+ Families F) Non-occupant Loans on Number Average Value Number Average Value Number Average Value Number Average Value Number Average Value Number Average Value
LOANS ORIGINATED 27 $89,929 132 $84,838 212 $95,264 20 $35,261 4 $204,662 65 $84,985 APPLICATIONS APPROVED, NOT ACCEPTED 0 $0 35 $51,745 30 $73,709 6 $23,952 0 $0 3 $29,273 APPLICATIONS DENIED 6 $76,253 109 $48,727 85 $74,430 21 $23,728 0 $0 3 $47,177 APPLICATIONS WITHDRAWN 3 $105,470 7 $108,144 34 $88,941 2 $14,715 0 $0 4 $73,155 FILES CLOSED FOR INCOMPLETENESS 1 $40,890 1 $140,140 11 $97,759 0 $0 0 $0 1 $123,960
Aggregated Statistics For Year 2001(Based on 1 full and 12 partial tracts) A) FHA, FSA/RHS & VA B) Conventional C) Refinancings D) Home Improvement Loans E) Loans on Dwellings For 5+ Families F) Non-occupant Loans on Number Average Value Number Average Value Number Average Value Number Average Value Number Average Value Number Average Value
LOANS ORIGINATED 21 $88,512 134 $85,794 205 $86,582 23 $17,132 3 $357,243 57 $81,546 APPLICATIONS APPROVED, NOT ACCEPTED 2 $59,925 43 $38,710 25 $84,956 4 $9,975 0 $0 1 $86,390 APPLICATIONS DENIED 4 $81,925 83 $45,469 76 $72,126 17 $7,951 1 $86,860 3 $89,487 APPLICATIONS WITHDRAWN 1 $91,210 18 $52,873 29 $74,608 3 $20,930 0 $0 6 $71,252 FILES CLOSED FOR INCOMPLETENESS 1 $51,990 0 $0 9 $61,763 0 $0 0 $0 0 $0
Aggregated Statistics For Year 2000(Based on 1 full and 12 partial tracts) A) FHA, FSA/RHS & VA B) Conventional C) Refinancings D) Home Improvement Loans E) Loans on Dwellings For 5+ Families F) Non-occupant Loans on Number Average Value Number Average Value Number Average Value Number Average Value Number Average Value Number Average Value
LOANS ORIGINATED 42 $83,235 151 $71,653 113 $72,199 23 $17,430 2 $535,645 47 $59,937 APPLICATIONS APPROVED, NOT ACCEPTED 10 $48,011 67 $54,993 29 $75,480 5 $20,660 0 $0 2 $96,645 APPLICATIONS DENIED 14 $50,536 273 $44,150 80 $72,959 14 $26,799 0 $0 10 $45,557 APPLICATIONS WITHDRAWN 4 $80,982 18 $73,891 36 $66,696 4 $27,315 0 $0 2 $82,320 FILES CLOSED FOR INCOMPLETENESS 0 $0 3 $98,297 9 $51,893 0 $0 0 $0 1 $41,070
Aggregated Statistics For Year 1999(Based on 1 full and 12 partial tracts) A) FHA, FSA/RHS & VA B) Conventional C) Refinancings D) Home Improvement Loans E) Loans on Dwellings For 5+ Families F) Non-occupant Loans on Number Average Value Number Average Value Number Average Value Number Average Value Number Average Value Number Average Value
LOANS ORIGINATED 31 $78,674 182 $73,497 125 $71,204 24 $16,390 3 $1,241,990 45 $62,239 APPLICATIONS APPROVED, NOT ACCEPTED 1 $18,030 119 $47,839 46 $59,156 4 $16,865 0 $0 16 $63,324 APPLICATIONS DENIED 4 $75,422 439 $46,179 99 $54,480 12 $10,377 1 $477,870 28 $61,127 APPLICATIONS WITHDRAWN 3 $78,783 21 $71,050 43 $68,506 4 $21,438 0 $0 4 $167,462 FILES CLOSED FOR INCOMPLETENESS 1 $72,430 6 $59,795 19 $62,925 1 $26,450 0 $0 0 $0
Detailed mortgage data for all 11 tracts in Asheboro, NC
Private Mortgage Insurance Companies Aggregated Statistics For Year 2009(Based on 1 full and 11 partial tracts) A) Conventional B) Refinancings C) Non-occupant Loans on Number Average Value Number Average Value Number Average Value
LOANS ORIGINATED 3 $113,910 8 $119,458 1 $113,170 APPLICATIONS APPROVED, NOT ACCEPTED 4 $114,778 1 $154,240 1 $166,550 APPLICATIONS DENIED 0 $0 2 $71,525 0 $0 APPLICATIONS WITHDRAWN 0 $0 0 $0 0 $0 FILES CLOSED FOR INCOMPLETENESS 1 $60,360 1 $39,090 1 $54,440
Aggregated Statistics For Year 2008(Based on 1 full and 12 partial tracts) A) Conventional B) Refinancings C) Non-occupant Loans on Number Average Value Number Average Value Number Average Value
LOANS ORIGINATED 21 $99,642 10 $119,660 3 $113,820 APPLICATIONS APPROVED, NOT ACCEPTED 3 $87,470 3 $123,417 1 $126,190 APPLICATIONS DENIED 2 $119,865 0 $0 1 $40,520 APPLICATIONS WITHDRAWN 1 $40,760 0 $0 1 $40,520 FILES CLOSED FOR INCOMPLETENESS 2 $91,640 0 $0 0 $0
Aggregated Statistics For Year 2007(Based on 1 full and 12 partial tracts) A) Conventional B) Refinancings C) Non-occupant Loans on D) Loans On Manufactured Number Average Value Number Average Value Number Average Value Number Average Value
LOANS ORIGINATED 33 $116,995 9 $104,996 4 $93,235 0 $0 APPLICATIONS APPROVED, NOT ACCEPTED 3 $173,653 2 $164,250 0 $0 1 $42,770 APPLICATIONS DENIED 0 $0 0 $0 0 $0 0 $0 APPLICATIONS WITHDRAWN 2 $167,190 2 $135,970 1 $186,320 0 $0 FILES CLOSED FOR INCOMPLETENESS 0 $0 0 $0 0 $0 0 $0
Aggregated Statistics For Year 2006(Based on 1 full and 12 partial tracts) A) Conventional B) Refinancings C) Non-occupant Loans on D) Loans On Manufactured Number Average Value Number Average Value Number Average Value Number Average Value
LOANS ORIGINATED 34 $100,877 13 $128,970 4 $81,525 1 $43,900 APPLICATIONS APPROVED, NOT ACCEPTED 2 $63,015 0 $0 0 $0 0 $0 APPLICATIONS DENIED 0 $0 0 $0 0 $0 0 $0 APPLICATIONS WITHDRAWN 1 $96,580 1 $79,540 0 $0 0 $0 FILES CLOSED FOR INCOMPLETENESS 0 $0 0 $0 0 $0 0 $0
Aggregated Statistics For Year 2005(Based on 1 full and 12 partial tracts) A) Conventional B) Refinancings C) Non-occupant Loans on Number Average Value Number Average Value Number Average Value
LOANS ORIGINATED 33 $108,501 15 $120,755 3 $96,193 APPLICATIONS APPROVED, NOT ACCEPTED 3 $96,147 2 $107,795 0 $0 APPLICATIONS DENIED 0 $0 0 $0 0 $0 APPLICATIONS WITHDRAWN 1 $114,450 1 $135,650 0 $0 FILES CLOSED FOR INCOMPLETENESS 1 $140,490 0 $0 0 $0
Aggregated Statistics For Year 2004(Based on 1 full and 12 partial tracts) A) Conventional B) Refinancings C) Non-occupant Loans on D) Loans On Manufactured Number Average Value Number Average Value Number Average Value Number Average Value
LOANS ORIGINATED 29 $110,752 13 $111,265 5 $61,300 0 $0 APPLICATIONS APPROVED, NOT ACCEPTED 3 $114,163 10 $90,222 1 $61,480 1 $116,730 APPLICATIONS DENIED 0 $0 0 $0 0 $0 0 $0 APPLICATIONS WITHDRAWN 0 $0 2 $69,350 0 $0 0 $0 FILES CLOSED FOR INCOMPLETENESS 0 $0 0 $0 0 $0 0 $0
Aggregated Statistics For Year 2003(Based on 1 full and 12 partial tracts) A) Conventional B) Refinancings C) Non-occupant Loans on Number Average Value Number Average Value Number Average Value
LOANS ORIGINATED 27 $97,618 45 $102,755 2 $71,890 APPLICATIONS APPROVED, NOT ACCEPTED 5 $95,340 18 $109,153 2 $66,340 APPLICATIONS DENIED 2 $73,740 3 $103,757 0 $0 APPLICATIONS WITHDRAWN 1 $122,850 1 $113,560 0 $0 FILES CLOSED FOR INCOMPLETENESS 0 $0 0 $0 0 $0
Aggregated Statistics For Year 2002(Based on 1 full and 12 partial tracts) A) Conventional B) Refinancings C) Non-occupant Loans on Number Average Value Number Average Value Number Average Value
LOANS ORIGINATED 34 $93,992 31 $101,629 6 $70,333 APPLICATIONS APPROVED, NOT ACCEPTED 5 $113,358 9 $120,692 0 $0 APPLICATIONS DENIED 1 $45,030 3 $92,397 1 $24,580 APPLICATIONS WITHDRAWN 0 $0 2 $82,395 0 $0 FILES CLOSED FOR INCOMPLETENESS 0 $0 0 $0 0 $0
Aggregated Statistics For Year 2001(Based on 1 full and 12 partial tracts) A) Conventional B) Refinancings C) Non-occupant Loans on Number Average Value Number Average Value Number Average Value
LOANS ORIGINATED 29 $99,262 28 $103,724 2 $63,360 APPLICATIONS APPROVED, NOT ACCEPTED 6 $80,530 3 $90,400 0 $0 APPLICATIONS DENIED 0 $0 5 $106,732 0 $0 APPLICATIONS WITHDRAWN 1 $110,360 1 $113,910 0 $0 FILES CLOSED FOR INCOMPLETENESS 3 $68,707 0 $0 0 $0
Aggregated Statistics For Year 2000(Based on 1 full and 12 partial tracts) A) Conventional B) Refinancings C) Non-occupant Loans on Number Average Value Number Average Value Number Average Value
LOANS ORIGINATED 24 $94,996 6 $108,037 2 $49,050 APPLICATIONS APPROVED, NOT ACCEPTED 7 $85,240 3 $66,240 1 $40,640 APPLICATIONS DENIED 4 $72,588 1 $57,530 1 $51,700 APPLICATIONS WITHDRAWN 0 $0 0 $0 0 $0 FILES CLOSED FOR INCOMPLETENESS 0 $0 0 $0 0 $0
Aggregated Statistics For Year 1999(Based on 1 full and 12 partial tracts) A) Conventional B) Refinancings C) Non-occupant Loans on Number Average Value Number Average Value Number Average Value
LOANS ORIGINATED 36 $91,854 14 $79,025 3 $56,520 APPLICATIONS APPROVED, NOT ACCEPTED 4 $101,430 0 $0 0 $0 APPLICATIONS DENIED 3 $103,887 1 $44,730 1 $46,780 APPLICATIONS WITHDRAWN 0 $0 0 $0 0 $0 FILES CLOSED FOR INCOMPLETENESS 0 $0 1 $47,680 1 $44,540
Fire-safe hotels and motels in Asheboro, North Carolina:
Comfort Inn Asheboro, 825 W Dixie Dr, Asheboro, North Carolina 27204 Phone: (336) 626-4414, Fax: (336) 625-0056
SureStay Plus Hotel by Best Western Asheboro, 242 Lakecrest Dr, Asheboro, North Carolina 27203 Phone: (336) 626-3680, Fax: (336) 626-7569
Holiday Inn Express & Suites, 1113 E Dixie Dr, Asheboro, North Carolina 27203 Phone: (336) 636-5222, Fax: (336) 626-6322
Super 8, 1020 Albemarle Rd, Asheboro, North Carolina 27205 Phone: (336) 625-1880, Fax: (336) 625-9055
Fairfield Inn & Suites Asheboro, 920 Executive Way, Asheboro, North Carolina 27203 Phone: (336) 626-9197
Quality Inn, 901 Albemarle Rd, Asheboro, North Carolina 27203 Phone: (336) 521-4848, Fax: (336) 521-9356
All 6 fire-safe hotels and motels in Asheboro, North Carolina
Most common first names in Asheboro, NC among deceased individuals Name Count Lived (average)
James 336 71.6 years William 304 73.2 years Mary 223 79.9 years John 213 74.4 years Robert 143 70.1 years Charles 129 71.3 years Annie 92 79.5 years Thomas 91 70.7 years George 89 74.5 years Ruth 88 75.8 years
Most common last names in Asheboro, NC among deceased individuals Last name Count Lived (average)
Cox 155 76.6 years Smith 141 74.5 years Brown 133 78.5 years Williams 126 75.2 years Davis 105 74.9 years Hill 90 75.6 years Allred 78 75.4 years Johnson 75 73.4 years Craven 67 74.1 years Walker 62 77.6 years
Asheboro compared to North Carolina state average:
Median household income below state average. Median house value below state average. Unemployed percentage significantly below state average. Hispanic race population percentage significantly above state average. Median age significantly below state average. Foreign-born population percentage above state average. Renting percentage above state average.
#21 on the list of "Top 101 cities with largest percentage of males in occupations: production occupations (population 5,000+)"
#66 on the list of "Top 101 cities with largest percentage of females in occupations: production occupations (population 5,000+)"
#75 on the list of "Top 101 cities with largest percentage of females in industries: manufacturing (population 5,000+)"
#94 (27350) on the list of "Top 101 zip codes with the lowest 2012 average net capital gain/loss (pop 5,000+)"
#22 on the list of "Top 101 counties with the lowest percentage of residents that drank alcohol in the past 30 days"
#29 on the list of "Top 101 counties with the highest percentage of residents that keep firearms around their homes"
#32 on the list of "Top 101 counties with the worst general health status score of residents (1-5), 3 years of data"
#36 on the list of "Top 101 counties with the lowest percentage of residents relocating to foreign countries in 2011"
#41 on the list of "Top 101 counties with the largest increase in the number of deaths per 1000 residents 2000-2006 to 2007-2013 (pop. 50,000+)"
Top Patent Applicants
Earl David Forrest (32)
Danny Ray Davis (9)
William C. Batten (6)
Bruce W. Kyles (6)
Alfred Charles Bless (5)
Zachary B. Durham (5)
Robert Howard Craig (3)
Zachary Benson Durham (3)
Alfred C. Bless (2)
Elham H. Fini (2)
Total of 101 patent applications in 2008-2024.


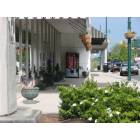

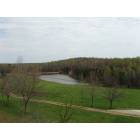
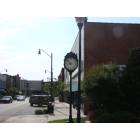
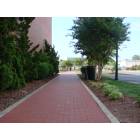
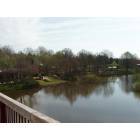
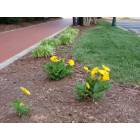
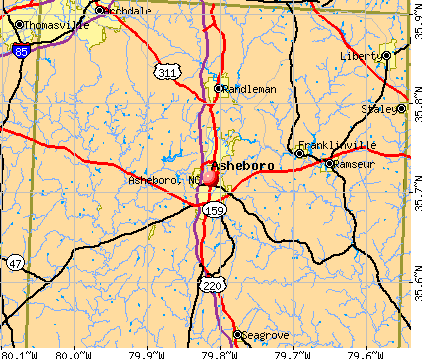


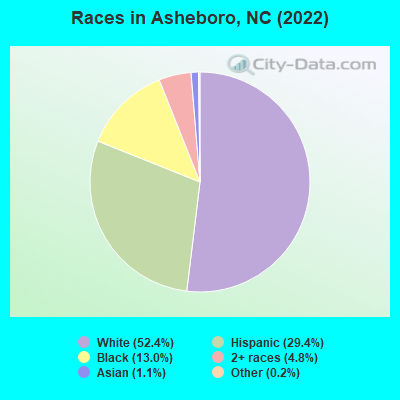
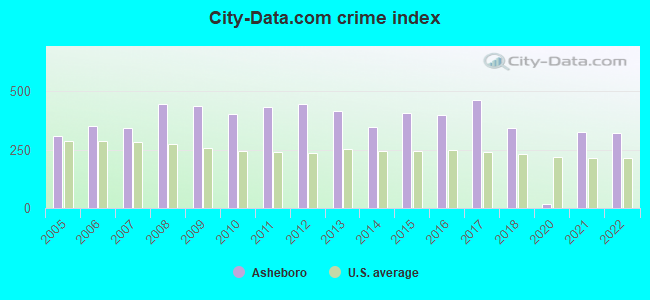
 Recent articles from our blog. Our writers, many of them Ph.D. graduates or candidates, create easy-to-read articles on a wide variety of topics.


 (20.5 miles
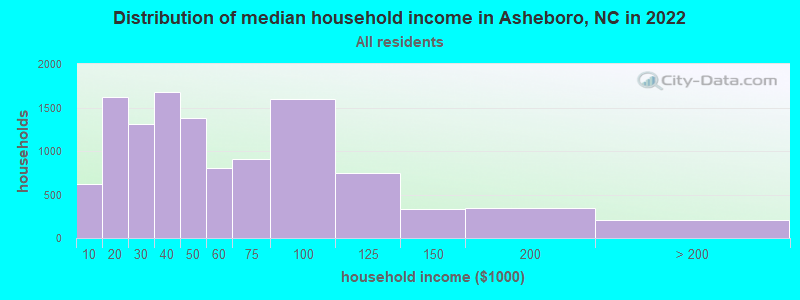
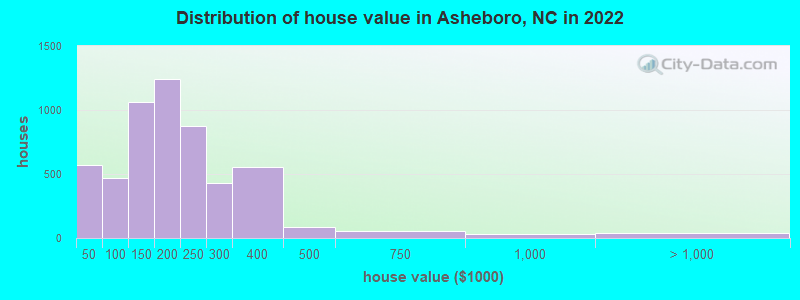
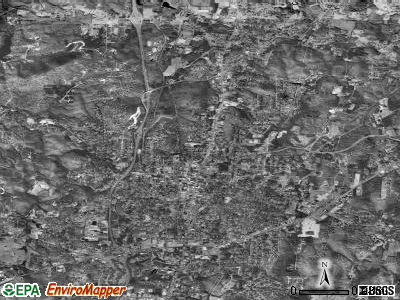
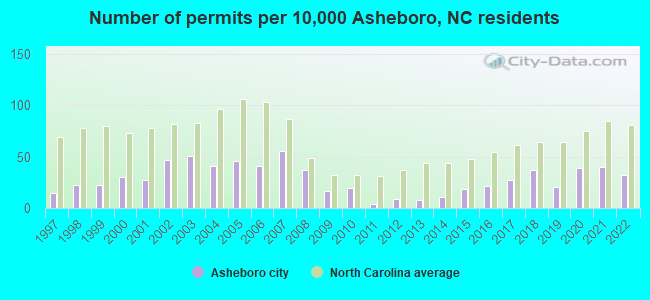
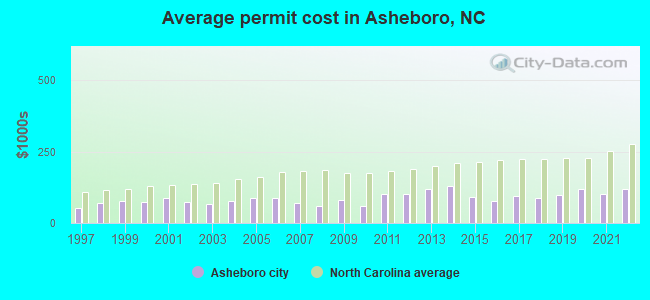
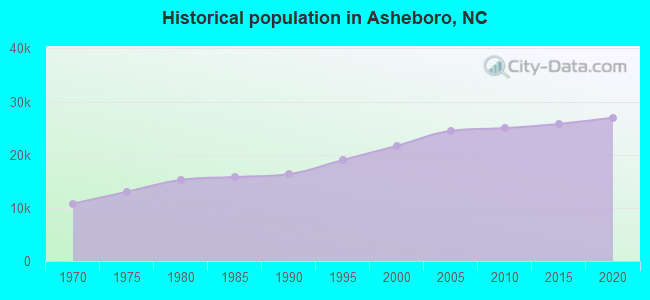
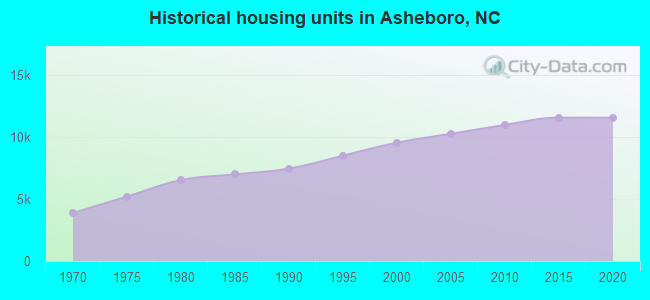
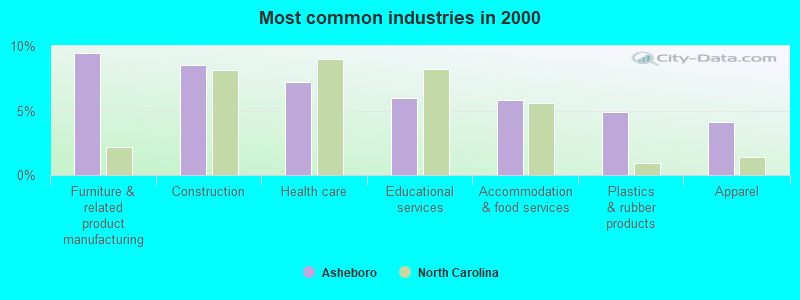
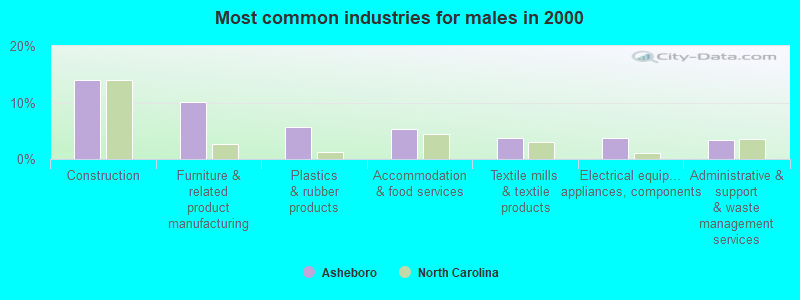
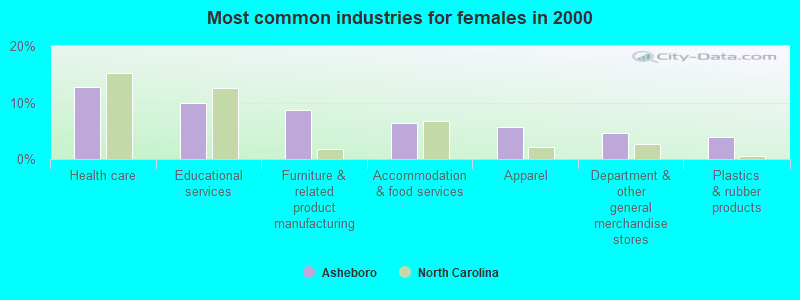
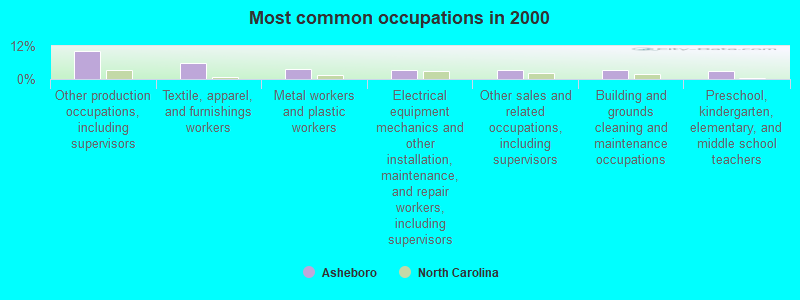
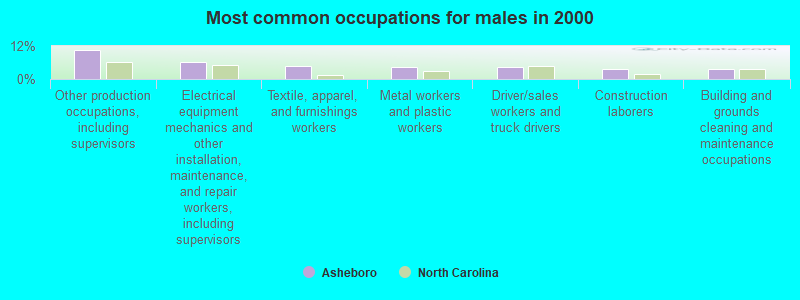
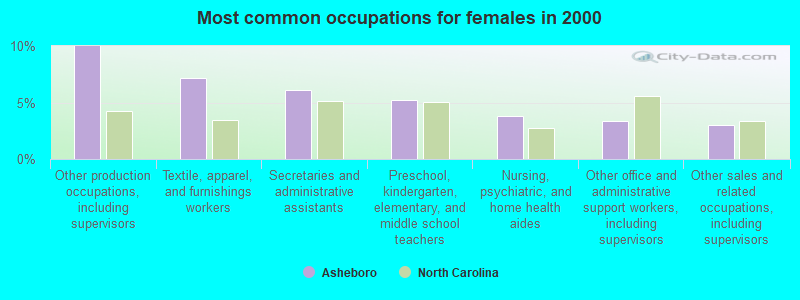
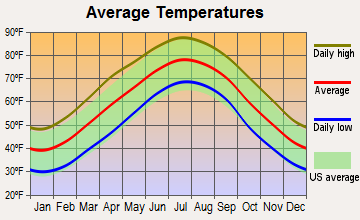
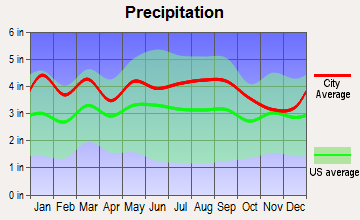
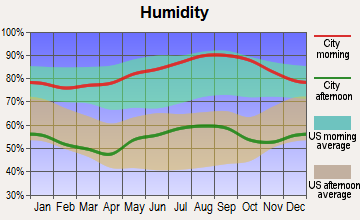
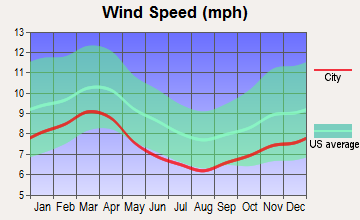
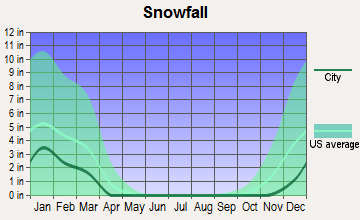
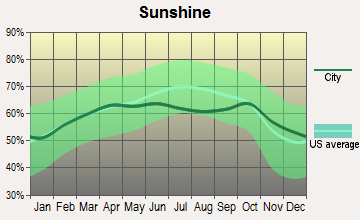
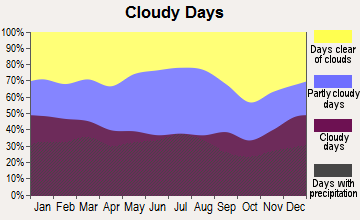


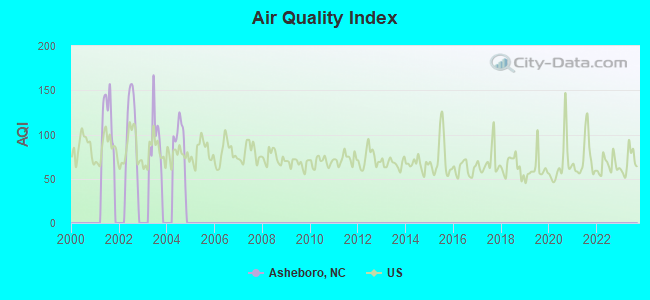
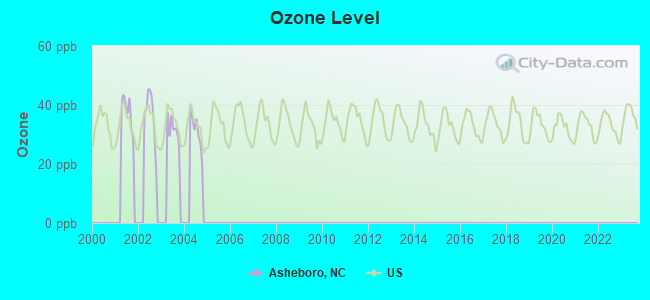

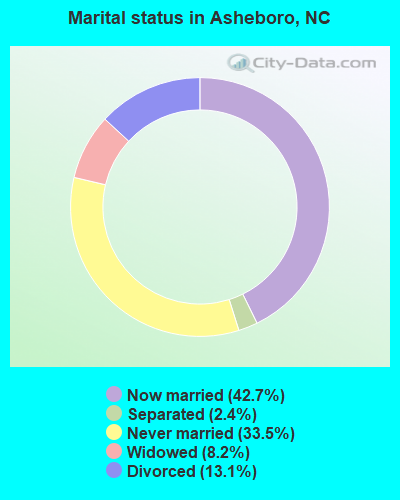
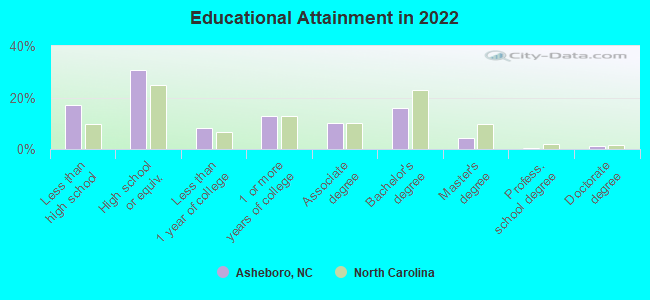
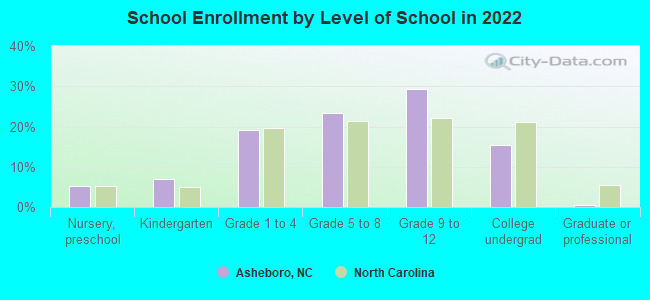
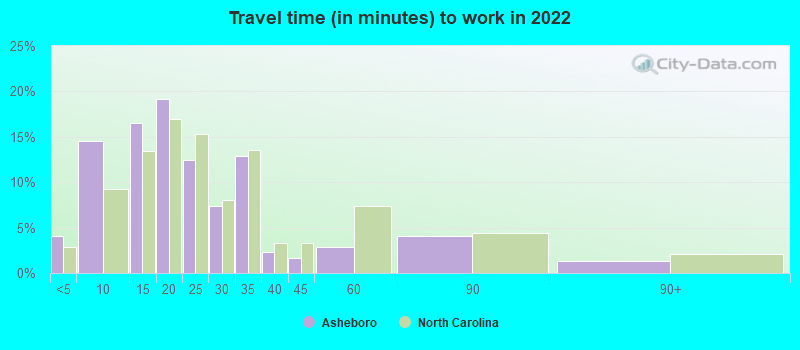
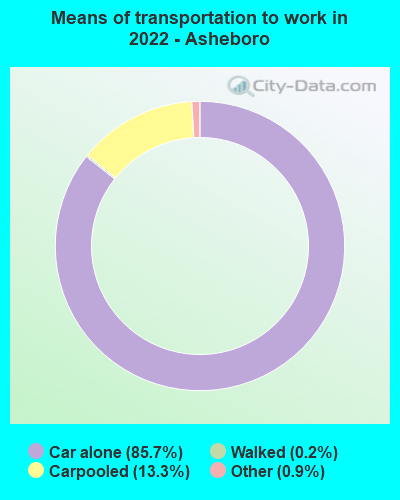
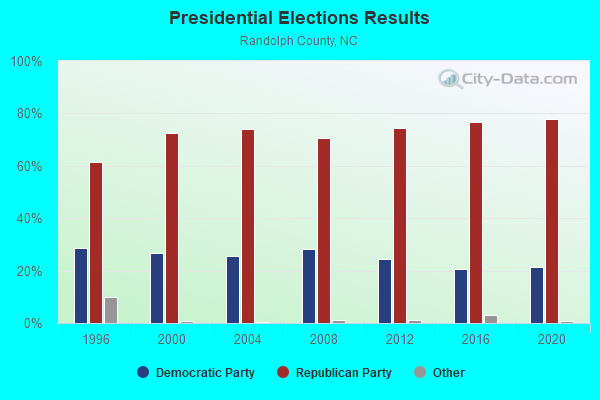
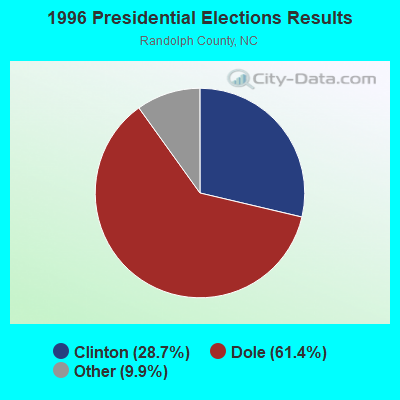
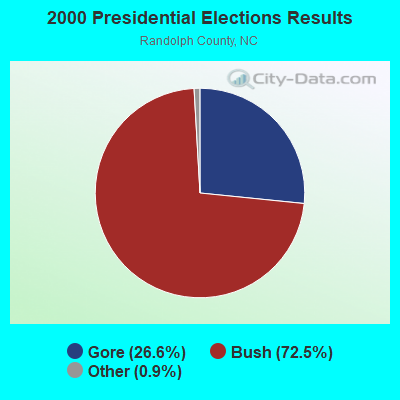
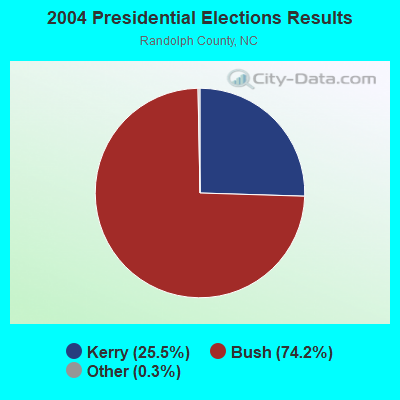

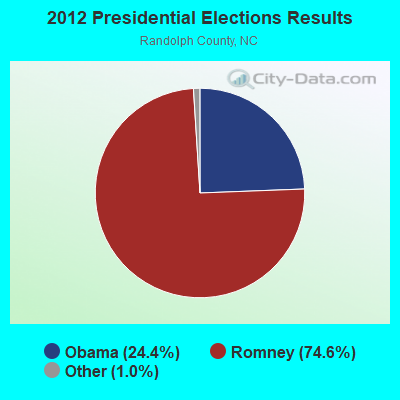
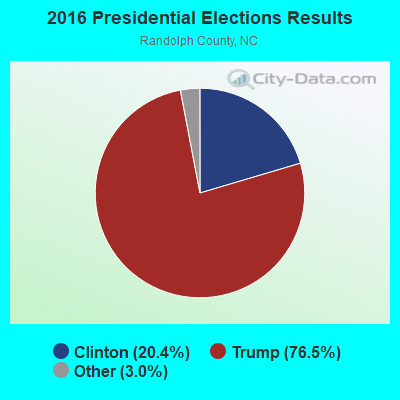
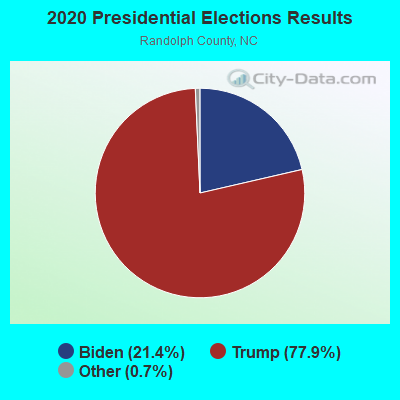
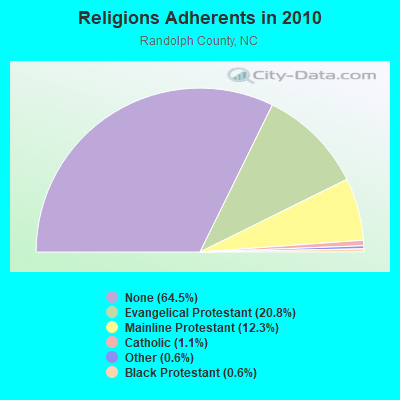
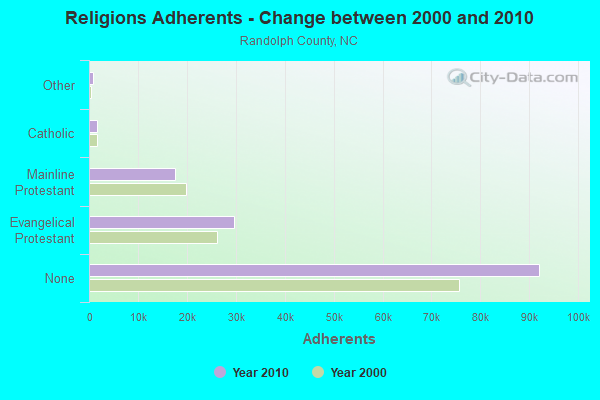
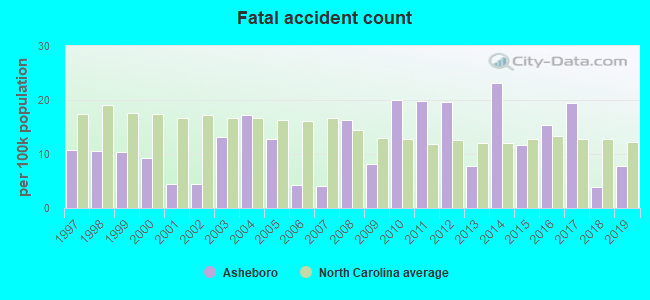
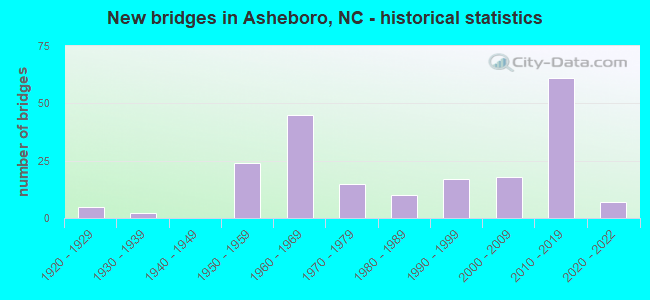
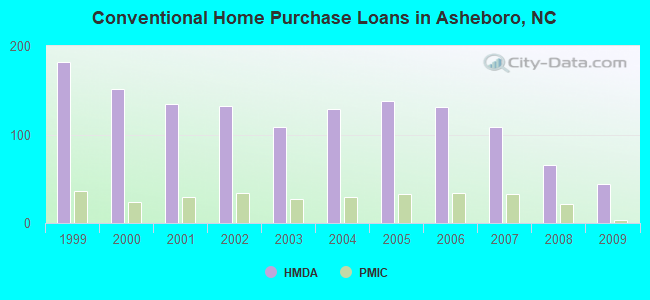
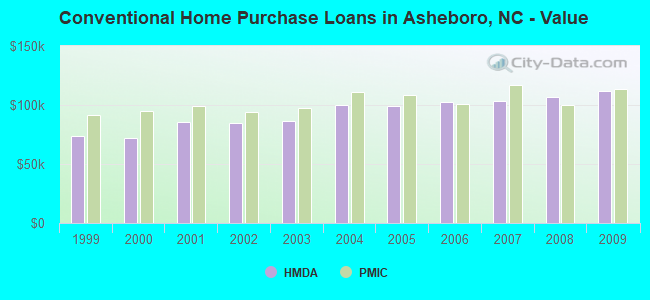
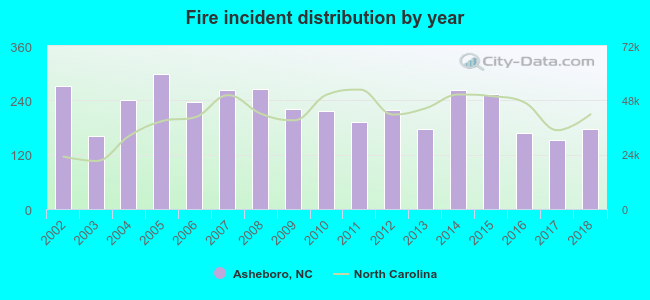 According to the data from the years 2002 - 2018 the average number of fires per year is 222. The highest number of reported fires - 298 took place in 2005, and the least - 153 in 2017. The data has a dropping trend.
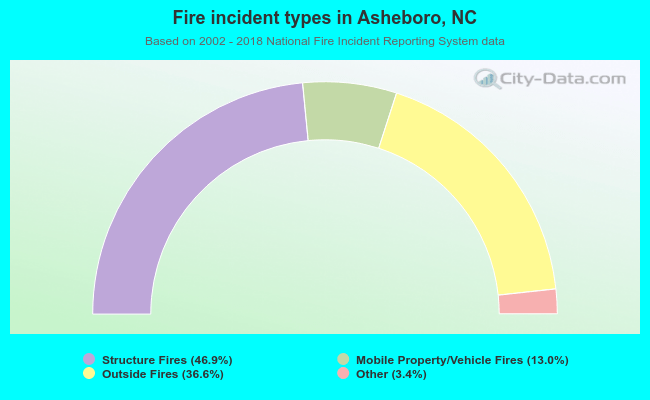 When looking into fire subcategories, the most reports belonged to: Structure Fires (46.9%), and Outside Fires (36.6%).