Estimated zip code population in 2022: 15,700 Zip code population in 2010: 15,906 Zip code population in 2000: 11,627
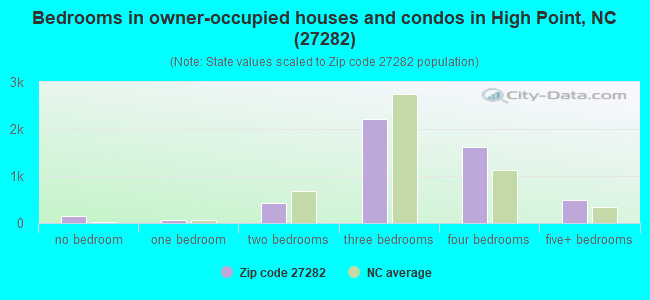
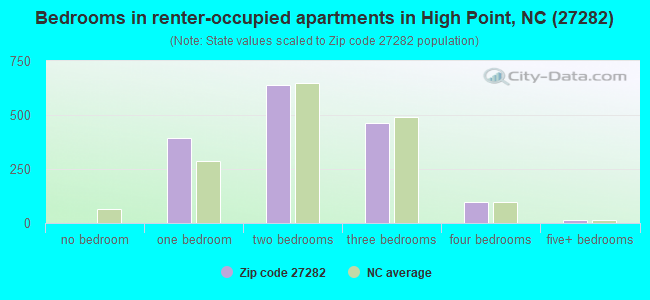
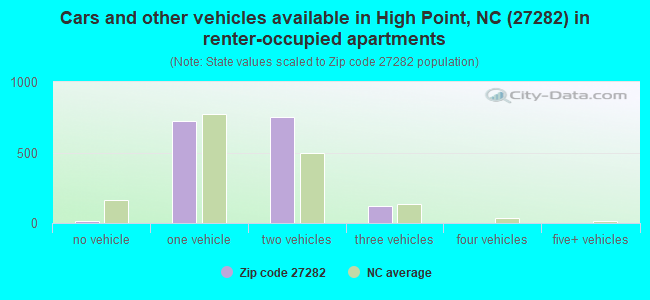
Houses and condos: 6,717 Renter-occupied apartments: 1,604
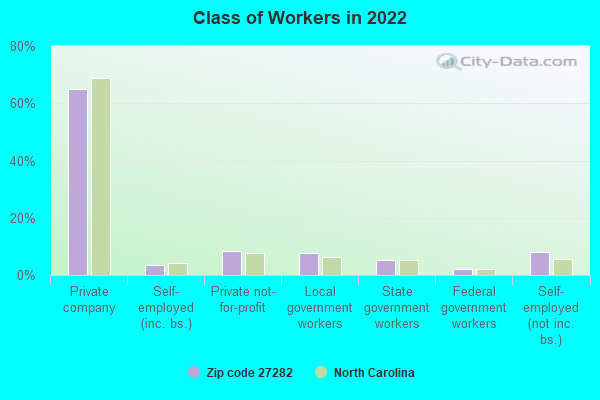
% of renters here:
25%
State:
33%
March 2022 cost of living index in zip code 27282: 91.9 (less than average, U.S. average is 100)
Land area: 13.8 sq. mi. Water area: 0.2 sq. mi.
Population density: 1,137 people per square mile
(low).
OSM Map
General Map
Google Map
MSN Map
OSM Map
General Map
Google Map
MSN Map
OSM Map
General Map
Google Map
MSN Map
OSM Map
General Map
Google Map
MSN Map
Please wait while loading the map...
Real estate property taxes paid for housing units in 2022:
This zip code:
0.8% ($2,450)
North Carolina:
0.6% ($1,769)
Median real estate property taxes paid for housing units with mortgages in 2022: $2,363 (0.8%) Median real estate property taxes paid for housing units with no mortgage in 2022: $2,610 (0.8%)
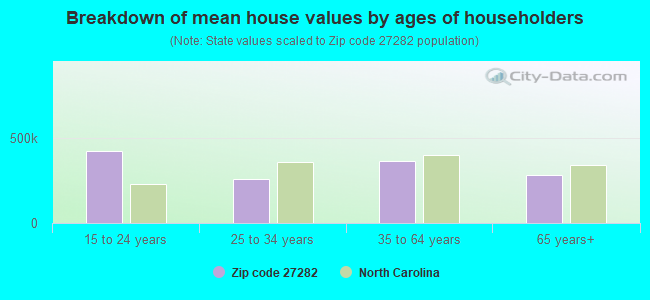
Estimated median house/condo value in 2022: $300,191
27282:
$300,191
North Carolina:
$280,600
According to our research of North Carolina and other state lists, there were 20 registered sex offenders living in 27282 zip code as of April 27, 2024. The ratio of all residents to sex offenders in zip code 27282 is 867 to 1. The ratio of registered sex offenders to all residents in this zip code is lower than the state average.
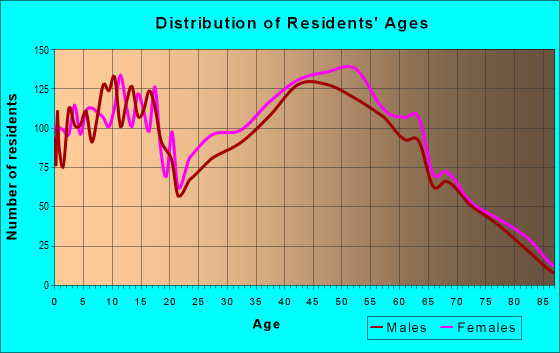
Median resident age:
This zip code:
40.5 years
North Carolina median age:
39.2 years
Average household size:
This zip code:
2.4 people
North Carolina:
2.4 people
Averages for the 2020 tax year for zip code 27282, filed in 2021:
Average Adjusted Gross Income (AGI) in 2020: $74,101 (Individual Income Tax Returns)
Here:
$74,101
State:
$70,020
Salary/wage: $62,718 (reported on 80.7% of returns)
Here:
$62,718
State:
$58,387
(% of AGI for various income ranges: 1113.3% for AGIs below $25k, 3838.1% for AGIs $25k-50k, 6989.6% for AGIs $50k-75k, 9723.2% for AGIs $75k-100k, 18232.2% for AGIs $100k-200k, 92854.0% for AGIs over 200k)
Taxable interest for individuals: $1,313 (reported on 35.1% of returns)
This zip code:
$1,313
North Carolina:
$1,479
(% of AGI for various income ranges: 20.2% for AGIs below $25k, 24.4% for AGIs $25k-50k, 36.7% for AGIs $50k-75k, 71.7% for AGIs $75k-100k, 115.3% for AGIs $100k-200k, 1538.0% for AGIs over 200k)
Ordinary dividends: $6,660 (reported on 23.9% of returns)
Here:
$6,660
State:
$7,888
(% of AGI for various income ranges: 35.5% for AGIs below $25k, 40.4% for AGIs $25k-50k, 137.9% for AGIs $50k-75k, 185.6% for AGIs $75k-100k, 501.3% for AGIs $100k-200k, 5980.0% for AGIs over 200k)
Net capital gain/loss in AGI: +$16,151 (reported on 21.7% of returns)
Here:
+$16,151
State:
+$23,652
(% of AGI for various income ranges: 13.7% for AGIs below $25k, 27.1% for AGIs $25k-50k, 97.5% for AGIs $50k-75k, 182.5% for AGIs $75k-100k, 705.2% for AGIs $100k-200k, 21296.0% for AGIs over 200k)
Profit/loss from business: +$12,278 (reported on 17.2% of returns)
Here:
+$12,278
State:
+$11,710
(% of AGI for various income ranges: 146.7% for AGIs below $25k, 158.3% for AGIs $25k-50k, 162.9% for AGIs $50k-75k, 282.7% for AGIs $75k-100k, 753.2% for AGIs $100k-200k, 4085.0% for AGIs over 200k)
Taxable individual retirement arrangement distribution: $20,866 (reported on 11.9% of returns)
27282:
$20,866
North Carolina:
$20,247
(% of AGI for various income ranges: 76.6% for AGIs below $25k, 134.9% for AGIs $25k-50k, 263.4% for AGIs $50k-75k, 547.3% for AGIs $75k-100k, 902.3% for AGIs $100k-200k, 5107.0% for AGIs over 200k)
Self-employed (Keogh) retirement plans: $20,075 (reported on 0.5% of returns)
27282:
$20,075
North Carolina:
$26,749
(% of AGI for various income ranges: 104.3% for AGIs $100k-200k)
Total itemized deductions: $33,114 (reported on 8.9% of returns)
Here:
$33,114
State:
$34,549
(% of AGI for various income ranges: 46.6% for AGIs below $25k, 125.2% for AGIs $25k-50k, 316.1% for AGIs $50k-75k, 504.6% for AGIs $75k-100k, 1071.0% for AGIs $100k-200k, 8092.0% for AGIs over 200k)
Charity contributions: $12,479 (reported on 8.0% of returns)
Here:
$12,479
State:
$13,360
(% of AGI for various income ranges: 5.2% for AGIs below $25k, 20.8% for AGIs $25k-50k, 63.8% for AGIs $50k-75k, 107.3% for AGIs $75k-100k, 328.3% for AGIs $100k-200k, 4285.0% for AGIs over 200k)
Taxes paid: $7,215 (reported on 8.9% of returns)
27282:
$7,215
State:
$7,586
(% of AGI for various income ranges: 8.6% for AGIs below $25k, 17.7% for AGIs $25k-50k, 67.4% for AGIs $50k-75k, 118.5% for AGIs $75k-100k, 286.2% for AGIs $100k-200k, 1477.0% for AGIs over 200k)
Earned income credit: $1,980 (reported on 12.1% of returns)
Here:
$1,980
State:
$2,337
(% of AGI for various income ranges: 71.4% for AGIs below $25k, 59.1% for AGIs $25k-50k)
Percentage of individuals using paid preparers for their 2020 taxes: 92.8%
Here:
93%
State:
93%
(% for various income ranges: 92.4% for AGIs below $25k, 92.5% for AGIs $25k-50k, 92.3% for AGIs $50k-75k, 95.7% for AGIs $75k-100k, 92.4% for AGIs $100k-200k, 92.7% for AGIs over 200k)
Averages for the 2012 tax year for zip code 27282, filed in 2013:
Average Adjusted Gross Income (AGI) in 2012: $68,047 (Individual Income Tax Returns)
Here:
$68,047
State:
$54,937
Salary/wage: $58,978 (reported on 82.5% of returns)
Here:
$58,978
State:
$46,336
(% of AGI for various income ranges: 72.0% for AGIs below $25k, 75.9% for AGIs $25k-50k, 76.0% for AGIs $50k-75k, 75.8% for AGIs $75k-100k, 75.3% for AGIs $100k-200k, 58.4% for AGIs over 200k)
Taxable interest for individuals: $1,159 (reported on 41.7% of returns)
This zip code:
$1,159
North Carolina:
$1,298
(% of AGI for various income ranges: 1.5% for AGIs below $25k, 0.9% for AGIs $25k-50k, 0.7% for AGIs $50k-75k, 0.5% for AGIs $75k-100k, 0.4% for AGIs $100k-200k, 0.9% for AGIs over 200k)
Ordinary dividends: $6,606 (reported on 26.4% of returns)
Here:
$6,606
State:
$6,213
(% of AGI for various income ranges: 2.1% for AGIs below $25k, 1.1% for AGIs $25k-50k, 1.6% for AGIs $50k-75k, 1.2% for AGIs $75k-100k, 2.0% for AGIs $100k-200k, 5.7% for AGIs over 200k)
Net capital gain/loss in AGI: +$8,553 (reported on 21.1% of returns)
Here:
+$8,553
State:
+$12,740
(% of AGI for various income ranges: 0.4% for AGIs $50k-75k, 0.5% for AGIs $75k-100k, 1.2% for AGIs $100k-200k, 9.7% for AGIs over 200k)
Profit/loss from business: +$11,821 (reported on 16.4% of returns)
Here:
+$11,821
State:
+$10,311
(% of AGI for various income ranges: 8.6% for AGIs below $25k, 3.4% for AGIs $25k-50k, 1.8% for AGIs $50k-75k, 2.1% for AGIs $75k-100k, 2.4% for AGIs $100k-200k, 3.0% for AGIs over 200k)
Taxable individual retirement arrangement distribution: $15,967 (reported on 14.6% of returns)
27282:
$15,967
North Carolina:
$15,575
(% of AGI for various income ranges: 4.9% for AGIs below $25k, 3.6% for AGIs $25k-50k, 3.9% for AGIs $50k-75k, 4.5% for AGIs $75k-100k, 3.5% for AGIs $100k-200k, 1.9% for AGIs over 200k)
Self-employment retirement plans: $23,260 (reported on 0.7% of returns)
27282:
$23,260
North Carolina:
$21,078
Total itemized deductions: $23,105 (22% of AGI, reported on 49.0% of returns)
Here:
$23,105
State:
$23,438
Here:
21.6% of AGI
State:
21.5% of AGI
(% of AGI for various income ranges: 18.6% for AGIs below $25k, 15.2% for AGIs $25k-50k, 18.2% for AGIs $50k-75k, 17.4% for AGIs $75k-100k, 17.1% for AGIs $100k-200k, 14.8% for AGIs over 200k)
Charity contributions: $4,290 (reported on 42.4% of returns)
Here:
$4,290
State:
$4,687
(% of AGI for various income ranges: 1.6% for AGIs below $25k, 2.1% for AGIs $25k-50k, 2.8% for AGIs $50k-75k, 2.5% for AGIs $75k-100k, 3.0% for AGIs $100k-200k, 2.9% for AGIs over 200k)
Taxes paid: $9,397 (reported on 48.8% of returns)
27282:
$9,397
State:
$8,823
(% of AGI for various income ranges: 2.9% for AGIs below $25k, 3.9% for AGIs $25k-50k, 5.9% for AGIs $50k-75k, 6.5% for AGIs $75k-100k, 7.5% for AGIs $100k-200k, 8.8% for AGIs over 200k)
Earned income credit: $2,051 (reported on 13.6% of returns)
Here:
$2,051
State:
$2,376
(% of AGI for various income ranges: 5.6% for AGIs below $25k, 0.9% for AGIs $25k-50k)
Percentage of individuals using paid preparers for their 2012 taxes: 50.6%
Here:
51%
State:
53%
(% for various income ranges: 46.3% for AGIs below $25k, 50.3% for AGIs $25k-50k, 51.4% for AGIs $50k-75k, 51.8% for AGIs $75k-100k, 53.9% for AGIs $100k-200k, 67.9% for AGIs over 200k)
Averages for the 2004 tax year for zip code 27282, filed in 2005:
Average Adjusted Gross Income (AGI) in 2004: $63,679 (Individual Income Tax Returns)
Here:
$63,679
State:
$45,376
Salary/wage: $55,754 (reported on 85.6% of returns)
Here:
$55,754
State:
$39,442
(% of AGI for various income ranges: 90.5% for AGIs below $10k, 73.4% for AGIs $10k-25k, 79.2% for AGIs $25k-50k, 80.2% for AGIs $50k-75k, 81.7% for AGIs $75k-100k, 69.6% for AGIs over 100k)
Taxable interest for individuals: $1,382 (reported on 52.2% of returns)
This zip code:
$1,382
North Carolina:
$1,515
(% of AGI for various income ranges: 4.6% for AGIs below $10k, 2.4% for AGIs $10k-25k, 1.5% for AGIs $25k-50k, 1.0% for AGIs $50k-75k, 1.0% for AGIs $75k-100k, 1.0% for AGIs over 100k)
Taxable dividends: $3,774 (reported on 33.6% of returns)
Here:
$3,774
State:
$4,016
(% of AGI for various income ranges: 4.7% for AGIs below $10k, 2.0% for AGIs $10k-25k, 1.4% for AGIs $25k-50k, 1.4% for AGIs $50k-75k, 1.2% for AGIs $75k-100k, 2.5% for AGIs over 100k)
Net capital gain/loss: +$7,616 (reported on 27.2% of returns)
Here:
+$7,616
State:
+$11,152
(% of AGI for various income ranges: -1.9% for AGIs below $10k, 0.1% for AGIs $10k-25k, 0.6% for AGIs $25k-50k, 1.1% for AGIs $50k-75k, 1.1% for AGIs $75k-100k, 5.8% for AGIs over 100k)
Profit/loss from business: +$12,414 (reported on 16.9% of returns)
Here:
+$12,414
State:
+$9,490
(% of AGI for various income ranges: 9.3% for AGIs below $10k, 5.3% for AGIs $10k-25k, 3.1% for AGIs $25k-50k, 3.1% for AGIs $50k-75k, 3.4% for AGIs $75k-100k, 3.1% for AGIs over 100k)
IRA payment deduction: $3,204 (reported on 3.1% of returns)
27282:
$3,204
North Carolina:
$2,967
(% of AGI for various income ranges: 0.3% for AGIs $10k-25k, 0.3% for AGIs $25k-50k, 0.2% for AGIs $50k-75k, 0.2% for AGIs $75k-100k, 0.1% for AGIs over 100k)
Self-employed pension: $14,940 (reported on 1.0% of returns)
Here:
$14,940
North Carolina:
$14,754
Total itemized deductions: $20,914 (22% of AGI, reported on 55.8% of returns)
Here:
$20,914
State:
$19,464
Here:
21.9% of AGI
State:
22.7% of AGI
(% of AGI for various income ranges: 17.9% for AGIs below $10k, 14.7% for AGIs $10k-25k, 20.3% for AGIs $25k-50k, 21.6% for AGIs $50k-75k, 20.8% for AGIs $75k-100k, 16.2% for AGIs over 100k)
Charity contributions deductions: $3,859 (4% of AGI, reported on 51.2% of returns)
Here:
$3,859
State:
$4,035
Here:
3.9% of AGI
State:
4.5% of AGI
(% of AGI for various income ranges: 1.4% for AGIs below $10k, 1.9% for AGIs $10k-25k, 3.3% for AGIs $25k-50k, 3.3% for AGIs $50k-75k, 3.2% for AGIs $75k-100k, 3.1% for AGIs over 100k)
Total tax: $10,117 (reported on 80.8% of returns)
27282:
$10,117
State:
$7,257
(% of AGI for various income ranges: 4.0% for AGIs below $10k, 4.2% for AGIs $10k-25k, 6.7% for AGIs $25k-50k, 8.2% for AGIs $50k-75k, 9.7% for AGIs $75k-100k, 17.9% for AGIs over 100k)
Earned income credit: $1,686 (reported on 8.9% of returns)
Here:
$1,686
State:
$1,851
Percentage of individuals using paid preparers for their 2004 taxes: 56.6%
Here:
57%
State:
62%
(% for various income ranges: 48.7% for AGIs below $10k, 60.2% for AGIs $10k-25k, 59.4% for AGIs $25k-50k, 55.9% for AGIs $50k-75k, 56.7% for AGIs $75k-100k, 57.4% for AGIs over 100k)
Likely homosexual households (counted as self-reported same-sex unmarried-partner households)
Lesbian couples: 0.1% of all households
Gay men: 0.0% of all households
Household received Food Stamps/SNAP in the past 12 months: 349 Household did not receive Food Stamps/SNAP in the past 12 months: 6,124
Women who had a birth in the past 12 months: 131 (130 now married, 4 unmarried) Women who did not have a birth in the past 12 months: 3,529 (1,418 now married, 2,108 unmarried)
Housing units in zip code 27282 with a mortgage: 3,476 (387 second mortgage, 362 both second mortgage and home equity loan) Houses without a mortgage: 96
Median monthly owner costs for units with a mortgage: $1,472 Median monthly owner costs for units without a mortgage: $563
Residents with income below the poverty level in 2022:
This zip code:
8.0%
Whole state:
12.8%
Residents with income below 50% of the poverty level in 2022:
This zip code:
4.7%
Whole state:
6.8%
Median number of rooms in houses and condos:
Here:
7.0
State:
6.4
Median number of rooms in apartments:
Here:
4.5
State:
4.4
Notable locations in this zip code not listed on our city pages
Churches in zip code 27282 include: Bales Church (A), Vickrey Church (B), Midway Church (C), Mitchel Grove Church (D), Oak Grove Church (E), Oakdale Church (F). Display/hide their locations on the map
2,094 married couples with children.
714 single-parent households (159 men, 555 women).
87.2% of residents of 27282 zip code speak English at home.
4.3% of residents speak Spanish at home (60% very well, 27% well, 11% not well, 2% not at all).
3.4% of residents speak other Indo-European language at home (87% very well, 10% well, 3% not well).
4.4% of residents speak Asian or Pacific Island language at home (64% very well, 13% well, 7% not well, 16% not at all).
1.2% of residents speak other language at home (95% very well, 5% not well).
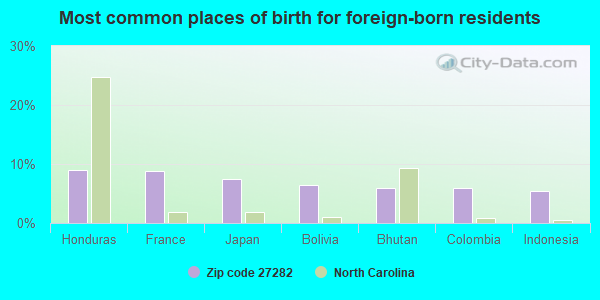
Foreign born population: 1,561 (9.9%) (59.4% of them are naturalized citizens)
This zip code:
9.9%
Whole state:
8.6%
9%Honduras
9%France
7%Japan
6%Bolivia
6%Bhutan
6%Colombia
5%Indonesia
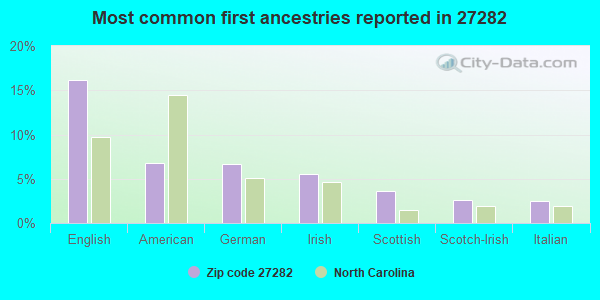
16%English
7%American
7%German
6%Irish
4%Scottish
3%Scotch-Irish
2%Italian
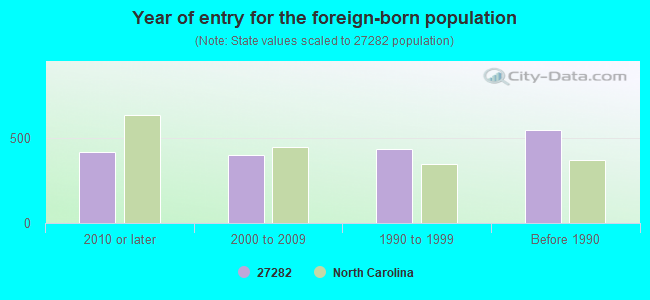
Year of entry for the foreign-born population
4172010 or later
4002000 to 2009
4351990 to 1999
547Before 1990
Facilities with environmental interests located in this zip code:
APAC CAROLINA PLANT 10 (5730 RIVERDALE DRIVE in JAMESTOWN, NC)
AIR SYNTHETIC MINOR (AIRS/AFS) STATE MASTER (North Carolina facility info) - -115DA4YG00M29W84AX3Y0A6DQ4, WASTEWATER FACILITY, -3865, AIR PROGRAM CRITERIA AND HAZARDOUS AIR POLLUTANT INVENTORY (Inventory of air pollution sources) National Pollutant Discharge Elimination System NON-MAJOR (Tracking pollutant discharge elimination systems) - permit TRI REPORTER (Tracking of toxic chemicals releasing facilities) Business SIC classification: ASPHALT PAVING MIXTURES AND BLOCKS Business NAICS classification: ASPHALT PAVING MIXTURE AND BLOCK MANUFACTURING.; ASPHALT PAVING MIXTURE AND BLOCK MANUFACTURING. Alternative names: APAC ATLANTIC INC THOMPSON ART, APAC ATLANTIC INCORPORATED - THOMPSON-ARTHUR DIVISION, APAC-CAROLINA, APAC CAROLINA INC-PLT10, APAC - CAROLINA TAPCO ASPHALT PLANT #10
A CLEANER WORLD NUMBER 191 (102 WEST MAIN ST in JAMESTOWN, NC)
AIR MINOR (AIRS/AFS) STATE MASTER (North Carolina facility info) - AIR PROGRAM, , STATE CLEANUP SITE Small Quantity Generators, between 100 kg and 1000 kg of hazardous waste/month (Resource Conservation and Recovery Act (tracking hazardous waste)) - notification Business SIC classification: DRYCLEANING PLANTS, EXCEPT RUG CLEANING Organizations: ACW MANAGEMENT CORP. (CONTACT/OWNER)
Alternative names: A CLEANER WORLD NO 191
CHEMCENTRAL GREENSBORO (108 OAKDALE ROAD in JAMESTOWN, NC)
AIR SYNTHETIC MINOR (AIRS/AFS) STATE MASTER (North Carolina facility info) - UNDERGROUND STORAGE TANK PROGRAM, AIR PROGRAM CRITERIA AND HAZARDOUS AIR POLLUTANT INVENTORY (Inventory of air pollution sources) Small Quantity Generators, between 100 kg and 1000 kg of hazardous waste/month (Resource Conservation and Recovery Act (tracking hazardous waste)) - notification TRI REPORTER (Tracking of toxic chemicals releasing facilities) Business SIC classification: CHEMICALS AND ALLIED PRODUCTS; NONCLASSIFIABLE ESTABLISHMENTS Organizations: CHEMCENTRAL/ CORP. (CONTACT/OWNER)
ADVANCED ENVIRONMENTAL OPTIONS INC (800-D W MAIN ST in JAMESTOWN, NC)
TRANSPORTER (Resource Conservation and Recovery Act (tracking hazardous waste)) USED OIL PROGRAM (Resource Conservation and Recovery Act (tracking hazardous waste)) Organizations: MIKE MURA (CONTACT/OPERATOR)
DIVERSIFIED TECHNOLOGIES INC. (125 WADE ST. in JAMESTOWN, NC)
Small Quantity Generators, between 100 kg and 1000 kg of hazardous waste/month (Resource Conservation and Recovery Act (tracking hazardous waste)) - notification TRI REPORTER (Tracking of toxic chemicals releasing facilities) Business SIC classification: PRINTED CIRCUIT BOARDS Organizations: WILLIAM SOSNOWSKI (CONTACT/OWNER)
Alternative names: DIVERSIFIED TECHS. INC.
CITY OF HIGH POINT - RIVERDALE PUMP STAT (5873 RIVERDALE ROAD in JAMESTOWN, NC)
AIR SYNTHETIC MINOR (AIRS/AFS) Business SIC classification: SEWERAGE SYSTEMS
Housing units lacking complete kitchen facilities: 0.8%
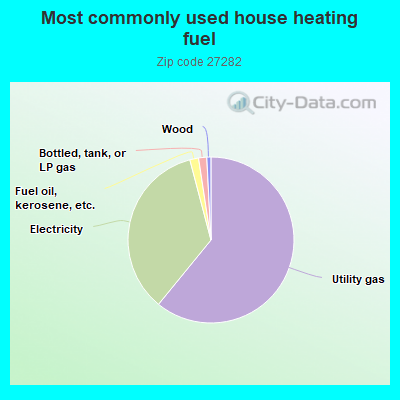
60.9%Utility gas
35.0%Electricity
1.7%Fuel oil, kerosene, etc.
1.6%Bottled, tank, or LP gas
0.8%Wood
Population in 1990: 9,812. Population change in the 1990s: +1,815 (+18.5%).
Place of birth for U.S.-born residents:
This state: 7,249
Northeast: 2,108
Midwest: 1,388
South: 2,645
West: 523
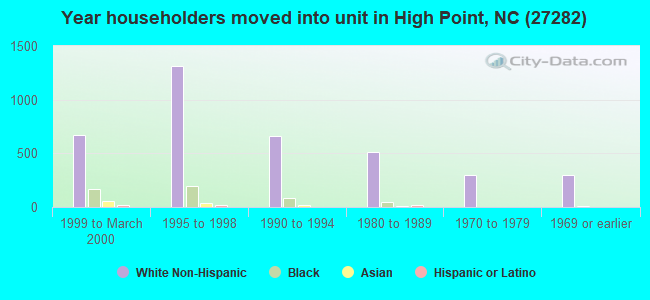
47% of the 27282 zip code residents lived in the same house 5 years ago. Out of people who lived in different houses, 47% lived in this county. Out of people who lived in different counties, 50% lived in North Carolina.
89% of the 27282 zip code residents lived in the same house 1 year ago. Out of people who lived in different houses, 55% moved from this county. Out of people who lived in different houses, 19% moved from different county within same state. Out of people who lived in different houses, 20% moved from different state. Out of people who lived in different houses, 3% moved from abroad.
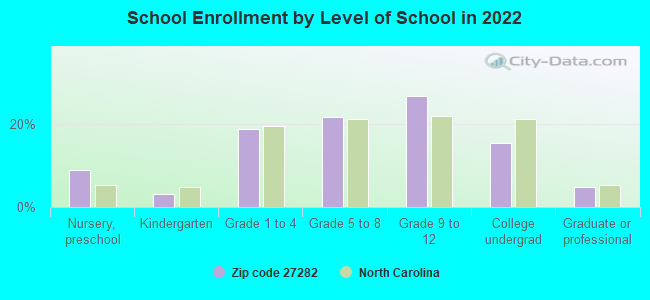
Private vs. public school enrollment:
Students in private schools in grades 1 to 8 (elementary and middle school): 239
Here:
15.6%
North Carolina:
13.8%
Students in private schools in grades 9 to 12 (high school): 233
Here:
22.9%
North Carolina:
11.9%
Students in private undergraduate colleges: 97
Here:
16.7%
North Carolina:
19.3%
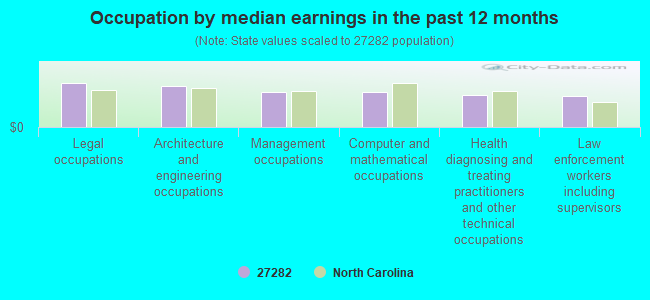
Occupation by median earnings in the past 12 months ($)
117,514Legal occupations
109,667Architecture and engineering occupations
94,458Management occupations
94,317Computer and mathematical occupations
86,022Health diagnosing and treating practitioners and other technical occupations
82,319Law enforcement workers including supervisors
Companies with federal contracts located in this zip code:
PREMIERE LAWN SERVICE LLC (102 WOODBINE DR in JAMESTOWN, NC; small business)
$13,729 with Navy for Landscaping/Groundskeeping Services. Signed on 2005-09-30. Completion date: 2006-09-29.
Top industries in this zip code by the number of employees in 2005:
Administrative and Support and Waste Management and Remediation Services: Janitorial Services (100-249 employees: 1 establishment, 1-4 employees: 2 establishments)
Health Care and Social Assistance: Nursing Care Facilities (100-249: 1)
Administrative and Support and Waste Management and Remediation Services: Security Guards and Patrol Services (100-249: 1)
Other Services (except Public Administration): Religious Organizations (20-49: 2, 10-19: 2, 5-9: 4, 1-4: 3)
Real Estate and Rental and Leasing: Residential Property Managers (50-99: 1, 5-9: 1)
People in group quarters in 2010:
66 people in group homes intended for adults
21 people in residential treatment centers for adults
People in group quarters in 2000:
5 people in homes for the mentally retarded
4 people in other types of correctional institutions
2 people in other noninstitutional group quarters
Fatal accident statistics in 2010:
Fatal accident count: 1
Vehicles involved in fatal accidents: 2
Fatal accidents caused by drunken drivers: 0
Fatalities: 2
Persons involved in fatal accidents: 5
Pedestrians involved in fatal accidents: 0
Home Mortgage Disclosure Act Aggregated Statistics For Year 2009 (Based on 8 partial tracts)
A) FHA, FSA/RHS & VA Home Purchase Loans
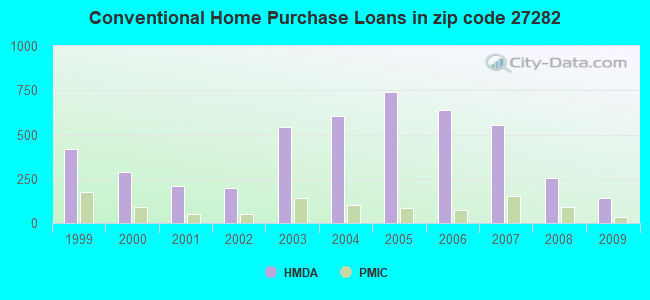
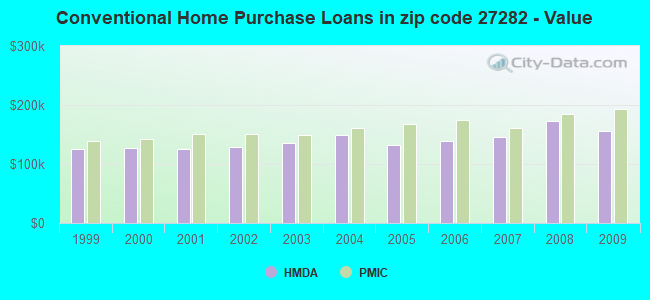
B) Conventional Home Purchase Loans
C) Refinancings
D) Home Improvement Loans
F) Non-occupant Loans on < 5 Family Dwellings (A B C & D)
Number
Average Value
Number
Average Value
Number
Average Value
Number
Average Value
Number
Average Value
LOANS ORIGINATED
114
$145,287
140
$156,478
696
$171,620
16
$110,255
28
$130,782
APPLICATIONS APPROVED, NOT ACCEPTED
8
$159,895
13
$173,971
37
$151,841
2
$18,585
3
$209,287
APPLICATIONS DENIED
17
$146,309
18
$169,380
205
$163,680
19
$40,901
10
$114,376
APPLICATIONS WITHDRAWN
11
$145,321
22
$151,950
180
$166,590
2
$21,750
11
$152,947
FILES CLOSED FOR INCOMPLETENESS
2
$95,240
0
$0
52
$160,501
0
$0
2
$141,350
Aggregated Statistics For Year 2008 (Based on 8 partial tracts)
A) FHA, FSA/RHS & VA Home Purchase Loans
B) Conventional Home Purchase Loans
C) Refinancings
D) Home Improvement Loans
E) Loans on Dwellings For 5+ Families
F) Non-occupant Loans on < 5 Family Dwellings (A B C & D)
G) Loans On Manufactured Home Dwelling (A B C & D)
Number
Average Value
Number
Average Value
Number
Average Value
Number
Average Value
Number
Average Value
Number
Average Value
Number
Average Value
LOANS ORIGINATED
113
$156,292
256
$172,971
357
$163,256
24
$61,985
1
$31,495,200
42
$132,046
0
$0
APPLICATIONS APPROVED, NOT ACCEPTED
9
$176,742
28
$177,644
87
$158,381
10
$78,366
0
$0
10
$145,077
0
$0
APPLICATIONS DENIED
16
$160,107
51
$154,826
234
$162,111
33
$72,795
0
$0
17
$285,127
1
$38,010
APPLICATIONS WITHDRAWN
12
$164,888
20
$163,694
135
$169,865
5
$89,200
0
$0
8
$141,479
0
$0
FILES CLOSED FOR INCOMPLETENESS
5
$99,848
3
$190,537
23
$168,080
0
$0
0
$0
0
$0
0
$0
Aggregated Statistics For Year 2007 (Based on 8 partial tracts)
A) FHA, FSA/RHS & VA Home Purchase Loans
B) Conventional Home Purchase Loans
C) Refinancings
D) Home Improvement Loans
F) Non-occupant Loans on < 5 Family Dwellings (A B C & D)
Number
Average Value
Number
Average Value
Number
Average Value
Number
Average Value
Number
Average Value
LOANS ORIGINATED
81
$158,117
555
$145,584
392
$141,441
48
$65,518
86
$145,258
APPLICATIONS APPROVED, NOT ACCEPTED
4
$142,950
66
$128,969
106
$110,853
19
$70,641
18
$107,872
APPLICATIONS DENIED
18
$154,750
95
$142,876
276
$173,019
75
$62,062
27
$136,341
APPLICATIONS WITHDRAWN
2
$118,470
39
$129,447
143
$166,202
10
$147,248
16
$101,189
FILES CLOSED FOR INCOMPLETENESS
2
$160,020
22
$183,789
33
$220,710
0
$0
2
$200,405
Aggregated Statistics For Year 2006 (Based on 8 partial tracts)
A) FHA, FSA/RHS & VA Home Purchase Loans
B) Conventional Home Purchase Loans
C) Refinancings
D) Home Improvement Loans
E) Loans on Dwellings For 5+ Families
F) Non-occupant Loans on < 5 Family Dwellings (A B C & D)
G) Loans On Manufactured Home Dwelling (A B C & D)
Number
Average Value
Number
Average Value
Number
Average Value
Number
Average Value
Number
Average Value
Number
Average Value
Number
Average Value
LOANS ORIGINATED
37
$151,186
637
$138,884
513
$123,076
56
$58,812
3
$355,147
87
$113,629
4
$143,082
APPLICATIONS APPROVED, NOT ACCEPTED
0
$0
57
$125,248
103
$127,071
14
$35,697
0
$0
6
$160,365
2
$20,905
APPLICATIONS DENIED
3
$120,277
73
$136,980
354
$142,335
58
$74,776
0
$0
18
$132,469
6
$104,145
APPLICATIONS WITHDRAWN
1
$164,870
40
$134,682
156
$146,191
14
$86,546
0
$0
13
$124,416
0
$0
FILES CLOSED FOR INCOMPLETENESS
2
$135,140
14
$160,707
67
$153,302
0
$0
0
$0
4
$81,560
0
$0
Aggregated Statistics For Year 2005 (Based on 8 partial tracts)
A) FHA, FSA/RHS & VA Home Purchase Loans
B) Conventional Home Purchase Loans
C) Refinancings
D) Home Improvement Loans
E) Loans on Dwellings For 5+ Families
F) Non-occupant Loans on < 5 Family Dwellings (A B C & D)
G) Loans On Manufactured Home Dwelling (A B C & D)
Number
Average Value
Number
Average Value
Number
Average Value
Number
Average Value
Number
Average Value
Number
Average Value
Number
Average Value
LOANS ORIGINATED
36
$161,645
740
$132,523
567
$133,992
62
$78,087
2
$484,710
84
$108,132
6
$159,000
APPLICATIONS APPROVED, NOT ACCEPTED
4
$154,940
64
$130,390
110
$129,184
12
$55,725
0
$0
10
$68,513
2
$17,035
APPLICATIONS DENIED
10
$140,431
100
$137,823
351
$146,404
51
$47,188
0
$0
11
$76,087
11
$57,485
APPLICATIONS WITHDRAWN
2
$162,130
73
$139,181
228
$147,104
18
$99,078
0
$0
11
$95,288
5
$67,210
FILES CLOSED FOR INCOMPLETENESS
0
$0
17
$87,604
60
$139,429
0
$0
0
$0
1
$94,060
0
$0
Aggregated Statistics For Year 2004 (Based on 8 partial tracts)
A) FHA, FSA/RHS & VA Home Purchase Loans
B) Conventional Home Purchase Loans
C) Refinancings
D) Home Improvement Loans
F) Non-occupant Loans on < 5 Family Dwellings (A B C & D)
G) Loans On Manufactured Home Dwelling (A B C & D)
Number
Average Value
Number
Average Value
Number
Average Value
Number
Average Value
Number
Average Value
Number
Average Value
LOANS ORIGINATED
50
$138,328
605
$148,496
618
$137,611
42
$30,188
82
$96,800
2
$31,410
APPLICATIONS APPROVED, NOT ACCEPTED
3
$171,667
63
$157,765
112
$132,608
13
$18,993
8
$105,142
3
$33,553
APPLICATIONS DENIED
6
$117,260
64
$135,644
337
$142,675
43
$58,652
19
$118,013
2
$71,780
APPLICATIONS WITHDRAWN
2
$132,405
44
$147,728
178
$163,038
16
$62,105
11
$79,644
0
$0
FILES CLOSED FOR INCOMPLETENESS
0
$0
10
$151,404
49
$143,117
2
$51,260
0
$0
0
$0
Aggregated Statistics For Year 2003 (Based on 8 partial tracts)
A) FHA, FSA/RHS & VA Home Purchase Loans
B) Conventional Home Purchase Loans
C) Refinancings
D) Home Improvement Loans
F) Non-occupant Loans on < 5 Family Dwellings (A B C & D)
Number
Average Value
Number
Average Value
Number
Average Value
Number
Average Value
Number
Average Value
LOANS ORIGINATED
76
$129,759
540
$135,486
1,825
$142,280
40
$21,013
68
$90,311
APPLICATIONS APPROVED, NOT ACCEPTED
0
$0
49
$129,176
191
$130,710
11
$60,869
7
$113,830
APPLICATIONS DENIED
13
$126,524
64
$104,018
391
$135,452
37
$36,334
7
$80,600
APPLICATIONS WITHDRAWN
7
$130,391
45
$154,497
239
$149,604
3
$50,777
8
$115,444
FILES CLOSED FOR INCOMPLETENESS
2
$121,565
11
$117,370
56
$155,062
1
$151,750
2
$68,140
Aggregated Statistics For Year 2002 (Based on 4 partial tracts)
A) FHA, FSA/RHS & VA Home Purchase Loans
B) Conventional Home Purchase Loans
C) Refinancings
D) Home Improvement Loans
F) Non-occupant Loans on < 5 Family Dwellings (A B C & D)
Number
Average Value
Number
Average Value
Number
Average Value
Number
Average Value
Number
Average Value
LOANS ORIGINATED
19
$127,863
200
$129,355
512
$129,961
32
$31,246
46
$93,167
APPLICATIONS APPROVED, NOT ACCEPTED
2
$114,405
17
$125,676
56
$105,696
4
$14,242
6
$59,913
APPLICATIONS DENIED
3
$109,433
40
$96,218
129
$95,000
20
$18,222
8
$48,698
APPLICATIONS WITHDRAWN
0
$0
19
$127,945
72
$119,282
3
$79,493
3
$43,913
FILES CLOSED FOR INCOMPLETENESS
0
$0
5
$99,384
14
$114,616
2
$46,460
0
$0
Aggregated Statistics For Year 2001 (Based on 4 partial tracts)
A) FHA, FSA/RHS & VA Home Purchase Loans
B) Conventional Home Purchase Loans
C) Refinancings
D) Home Improvement Loans
F) Non-occupant Loans on < 5 Family Dwellings (A B C & D)
Number
Average Value
Number
Average Value
Number
Average Value
Number
Average Value
Number
Average Value
LOANS ORIGINATED
62
$119,312
207
$125,604
416
$126,758
28
$30,570
37
$77,854
APPLICATIONS APPROVED, NOT ACCEPTED
3
$110,467
29
$113,817
41
$109,197
10
$19,796
5
$48,936
APPLICATIONS DENIED
5
$114,682
30
$82,193
128
$93,717
13
$28,125
5
$111,248
APPLICATIONS WITHDRAWN
5
$103,084
20
$92,246
54
$109,927
0
$0
3
$97,563
FILES CLOSED FOR INCOMPLETENESS
0
$0
2
$69,685
11
$52,850
0
$0
2
$69,685
Aggregated Statistics For Year 2000 (Based on 4 partial tracts)
A) FHA, FSA/RHS & VA Home Purchase Loans
B) Conventional Home Purchase Loans
C) Refinancings
D) Home Improvement Loans
F) Non-occupant Loans on < 5 Family Dwellings (A B C & D)
Number
Average Value
Number
Average Value
Number
Average Value
Number
Average Value
Number
Average Value
LOANS ORIGINATED
64
$116,965
287
$126,499
106
$95,004
27
$21,095
14
$82,199
APPLICATIONS APPROVED, NOT ACCEPTED
7
$88,513
40
$99,237
32
$96,296
8
$10,949
2
$75,880
APPLICATIONS DENIED
5
$69,356
74
$77,611
61
$87,186
22
$22,472
8
$60,395
APPLICATIONS WITHDRAWN
8
$90,980
29
$124,048
37
$76,252
5
$37,946
0
$0
FILES CLOSED FOR INCOMPLETENESS
0
$0
2
$66,590
7
$60,896
2
$11,615
0
$0
Aggregated Statistics For Year 1999 (Based on 5 partial tracts)
A) FHA, FSA/RHS & VA Home Purchase Loans
B) Conventional Home Purchase Loans
C) Refinancings
D) Home Improvement Loans
E) Loans on Dwellings For 5+ Families
F) Non-occupant Loans on < 5 Family Dwellings (A B C & D)
2002 - 2018 National Fire Incident Reporting System (NFIRS) incidents
Based on the data from the years 2002 - 2018 the average number of fire incidents per year is 35. The highest number of fire incidents - 53 took place in 2014, and the least - 17 in 2017. The data has a growing trend.
When looking into fire subcategories, the most incidents belonged to: Outside Fires (43.0%), and Structure Fires (41.0%).
Fire incident types reported to NFIRS in Zip Code 27282


 Nearest zip codes: 27407, 27260, 27263, 27265, 27409, 27262.
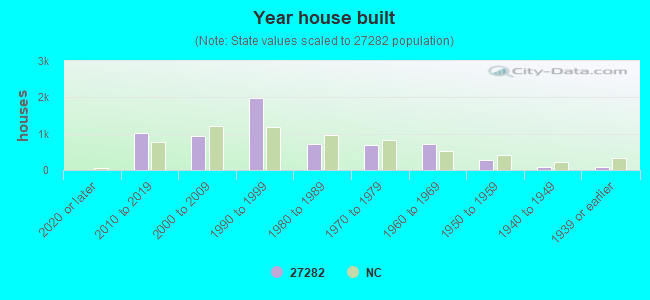


 Based on the data from the years 2002 - 2018 the average number of fire incidents per year is 35. The highest number of fire incidents - 53 took place in 2014, and the least - 17 in 2017. The data has a growing trend.
 When looking into fire subcategories, the most incidents belonged to: Outside Fires (43.0%), and Structure Fires (41.0%).