Jamestown, North Carolina Submit your own pictures of this town and show them to the world
OSM Map
General Map
Google Map
MSN Map
OSM Map
General Map
Google Map
MSN Map
OSM Map
General Map
Google Map
MSN Map
OSM Map
General Map
Google Map
MSN Map
Please wait while loading the map...
Population in 2022: 3,712 (100% urban, 0% rural). Population change since 2000: +20.2%Males: 1,862 Females: 1,850
March 2022 cost of living index in Jamestown: 91.2 (less than average, U.S. average is 100) Percentage of residents living in poverty in 2022: 5.3%for White Non-Hispanic residents , 16.3% for Black residents , 22.1% for Hispanic or Latino residents , 44.4% for two or more races residents )Business Search - 14 Million verified businesses
Data:
Median household income ($)
Median household income (% change since 2000)
Household income diversity
Ratio of average income to average house value (%)
Ratio of average income to average rent
Median household income ($) - White
Median household income ($) - Black or African American
Median household income ($) - Asian
Median household income ($) - Hispanic or Latino
Median household income ($) - American Indian and Alaska Native
Median household income ($) - Multirace
Median household income ($) - Other Race
Median household income for houses/condos with a mortgage ($)
Median household income for apartments without a mortgage ($)
Races - White alone (%)
Races - White alone (% change since 2000)
Races - Black alone (%)
Races - Black alone (% change since 2000)
Races - American Indian alone (%)
Races - American Indian alone (% change since 2000)
Races - Asian alone (%)
Races - Asian alone (% change since 2000)
Races - Hispanic (%)
Races - Hispanic (% change since 2000)
Races - Native Hawaiian and Other Pacific Islander alone (%)
Races - Native Hawaiian and Other Pacific Islander alone (% change since 2000)
Races - Two or more races (%)
Races - Two or more races (% change since 2000)
Races - Other race alone (%)
Races - Other race alone (% change since 2000)
Racial diversity
Unemployment (%)
Unemployment (% change since 2000)
Unemployment (%) - White
Unemployment (%) - Black or African American
Unemployment (%) - Asian
Unemployment (%) - Hispanic or Latino
Unemployment (%) - American Indian and Alaska Native
Unemployment (%) - Multirace
Unemployment (%) - Other Race
Population density (people per square mile)
Population - Males (%)
Population - Females (%)
Population - Males (%) - White
Population - Males (%) - Black or African American
Population - Males (%) - Asian
Population - Males (%) - Hispanic or Latino
Population - Males (%) - American Indian and Alaska Native
Population - Males (%) - Multirace
Population - Males (%) - Other Race
Population - Females (%) - White
Population - Females (%) - Black or African American
Population - Females (%) - Asian
Population - Females (%) - Hispanic or Latino
Population - Females (%) - American Indian and Alaska Native
Population - Females (%) - Multirace
Population - Females (%) - Other Race
Coronavirus confirmed cases (Apr 27, 2024)
Deaths caused by coronavirus (Apr 27, 2024)
Coronavirus confirmed cases (per 100k population) (Apr 27, 2024)
Deaths caused by coronavirus (per 100k population) (Apr 27, 2024)
Daily increase in number of cases (Apr 27, 2024)
Weekly increase in number of cases (Apr 27, 2024)
Cases doubled (in days) (Apr 27, 2024)
Hospitalized patients (Apr 18, 2022)
Negative test results (Apr 18, 2022)
Total test results (Apr 18, 2022)
COVID Vaccine doses distributed (per 100k population) (Sep 19, 2023)
COVID Vaccine doses administered (per 100k population) (Sep 19, 2023)
COVID Vaccine doses distributed (Sep 19, 2023)
COVID Vaccine doses administered (Sep 19, 2023)
Likely homosexual households (%)
Likely homosexual households (% change since 2000)
Likely homosexual households - Lesbian couples (%)
Likely homosexual households - Lesbian couples (% change since 2000)
Likely homosexual households - Gay men (%)
Likely homosexual households - Gay men (% change since 2000)
Cost of living index
Median gross rent ($)
Median contract rent ($)
Median monthly housing costs ($)
Median house or condo value ($)
Median house or condo value ($ change since 2000)
Mean house or condo value by units in structure - 1, detached ($)
Mean house or condo value by units in structure - 1, attached ($)
Mean house or condo value by units in structure - 2 ($)
Mean house or condo value by units in structure by units in structure - 3 or 4 ($)
Mean house or condo value by units in structure - 5 or more ($)
Mean house or condo value by units in structure - Boat, RV, van, etc. ($)
Mean house or condo value by units in structure - Mobile home ($)
Median house or condo value ($) - White
Median house or condo value ($) - Black or African American
Median house or condo value ($) - Asian
Median house or condo value ($) - Hispanic or Latino
Median house or condo value ($) - American Indian and Alaska Native
Median house or condo value ($) - Multirace
Median house or condo value ($) - Other Race
Median resident age
Resident age diversity
Median resident age - Males
Median resident age - Females
Median resident age - White
Median resident age - Black or African American
Median resident age - Asian
Median resident age - Hispanic or Latino
Median resident age - American Indian and Alaska Native
Median resident age - Multirace
Median resident age - Other Race
Median resident age - Males - White
Median resident age - Males - Black or African American
Median resident age - Males - Asian
Median resident age - Males - Hispanic or Latino
Median resident age - Males - American Indian and Alaska Native
Median resident age - Males - Multirace
Median resident age - Males - Other Race
Median resident age - Females - White
Median resident age - Females - Black or African American
Median resident age - Females - Asian
Median resident age - Females - Hispanic or Latino
Median resident age - Females - American Indian and Alaska Native
Median resident age - Females - Multirace
Median resident age - Females - Other Race
Commute - mean travel time to work (minutes)
Travel time to work - Less than 5 minutes (%)
Travel time to work - Less than 5 minutes (% change since 2000)
Travel time to work - 5 to 9 minutes (%)
Travel time to work - 5 to 9 minutes (% change since 2000)
Travel time to work - 10 to 19 minutes (%)
Travel time to work - 10 to 19 minutes (% change since 2000)
Travel time to work - 20 to 29 minutes (%)
Travel time to work - 20 to 29 minutes (% change since 2000)
Travel time to work - 30 to 39 minutes (%)
Travel time to work - 30 to 39 minutes (% change since 2000)
Travel time to work - 40 to 59 minutes (%)
Travel time to work - 40 to 59 minutes (% change since 2000)
Travel time to work - 60 to 89 minutes (%)
Travel time to work - 60 to 89 minutes (% change since 2000)
Travel time to work - 90 or more minutes (%)
Travel time to work - 90 or more minutes (% change since 2000)
Marital status - Never married (%)
Marital status - Now married (%)
Marital status - Separated (%)
Marital status - Widowed (%)
Marital status - Divorced (%)
Median family income ($)
Median family income (% change since 2000)
Median non-family income ($)
Median non-family income (% change since 2000)
Median per capita income ($)
Median per capita income (% change since 2000)
Median family income ($) - White
Median family income ($) - Black or African American
Median family income ($) - Asian
Median family income ($) - Hispanic or Latino
Median family income ($) - American Indian and Alaska Native
Median family income ($) - Multirace
Median family income ($) - Other Race
Median year house/condo built
Median year apartment built
Year house built - Built 2005 or later (%)
Year house built - Built 2000 to 2004 (%)
Year house built - Built 1990 to 1999 (%)
Year house built - Built 1980 to 1989 (%)
Year house built - Built 1970 to 1979 (%)
Year house built - Built 1960 to 1969 (%)
Year house built - Built 1950 to 1959 (%)
Year house built - Built 1940 to 1949 (%)
Year house built - Built 1939 or earlier (%)
Average household size
Household density (households per square mile)
Average household size - White
Average household size - Black or African American
Average household size - Asian
Average household size - Hispanic or Latino
Average household size - American Indian and Alaska Native
Average household size - Multirace
Average household size - Other Race
Occupied housing units (%)
Vacant housing units (%)
Owner occupied housing units (%)
Renter occupied housing units (%)
Vacancy status - For rent (%)
Vacancy status - For sale only (%)
Vacancy status - Rented or sold, not occupied (%)
Vacancy status - For seasonal, recreational, or occasional use (%)
Vacancy status - For migrant workers (%)
Vacancy status - Other vacant (%)
Residents with income below the poverty level (%)
Residents with income below 50% of the poverty level (%)
Children below poverty level (%)
Poor families by family type - Married-couple family (%)
Poor families by family type - Male, no wife present (%)
Poor families by family type - Female, no husband present (%)
Poverty status for native-born residents (%)
Poverty status for foreign-born residents (%)
Poverty among high school graduates not in families (%)
Poverty among people who did not graduate high school not in families (%)
Residents with income below the poverty level (%) - White
Residents with income below the poverty level (%) - Black or African American
Residents with income below the poverty level (%) - Asian
Residents with income below the poverty level (%) - Hispanic or Latino
Residents with income below the poverty level (%) - American Indian and Alaska Native
Residents with income below the poverty level (%) - Multirace
Residents with income below the poverty level (%) - Other Race
Air pollution - Air Quality Index (AQI)
Air pollution - CO
Air pollution - NO2
Air pollution - SO2
Air pollution - Ozone
Air pollution - PM10
Air pollution - PM25
Air pollution - Pb
Crime - Murders per 100,000 population
Crime - Rapes per 100,000 population
Crime - Robberies per 100,000 population
Crime - Assaults per 100,000 population
Crime - Burglaries per 100,000 population
Crime - Thefts per 100,000 population
Crime - Auto thefts per 100,000 population
Crime - Arson per 100,000 population
Crime - City-data.com crime index
Crime - Violent crime index
Crime - Property crime index
Crime - Murders per 100,000 population (5 year average)
Crime - Rapes per 100,000 population (5 year average)
Crime - Robberies per 100,000 population (5 year average)
Crime - Assaults per 100,000 population (5 year average)
Crime - Burglaries per 100,000 population (5 year average)
Crime - Thefts per 100,000 population (5 year average)
Crime - Auto thefts per 100,000 population (5 year average)
Crime - Arson per 100,000 population (5 year average)
Crime - City-data.com crime index (5 year average)
Crime - Violent crime index (5 year average)
Crime - Property crime index (5 year average)
1996 Presidential Elections Results (%) - Democratic Party (Clinton)
1996 Presidential Elections Results (%) - Republican Party (Dole)
1996 Presidential Elections Results (%) - Other
2000 Presidential Elections Results (%) - Democratic Party (Gore)
2000 Presidential Elections Results (%) - Republican Party (Bush)
2000 Presidential Elections Results (%) - Other
2004 Presidential Elections Results (%) - Democratic Party (Kerry)
2004 Presidential Elections Results (%) - Republican Party (Bush)
2004 Presidential Elections Results (%) - Other
2008 Presidential Elections Results (%) - Democratic Party (Obama)
2008 Presidential Elections Results (%) - Republican Party (McCain)
2008 Presidential Elections Results (%) - Other
2012 Presidential Elections Results (%) - Democratic Party (Obama)
2012 Presidential Elections Results (%) - Republican Party (Romney)
2012 Presidential Elections Results (%) - Other
2016 Presidential Elections Results (%) - Democratic Party (Clinton)
2016 Presidential Elections Results (%) - Republican Party (Trump)
2016 Presidential Elections Results (%) - Other
2020 Presidential Elections Results (%) - Democratic Party (Biden)
2020 Presidential Elections Results (%) - Republican Party (Trump)
2020 Presidential Elections Results (%) - Other
Ancestries Reported - Arab (%)
Ancestries Reported - Czech (%)
Ancestries Reported - Danish (%)
Ancestries Reported - Dutch (%)
Ancestries Reported - English (%)
Ancestries Reported - French (%)
Ancestries Reported - French Canadian (%)
Ancestries Reported - German (%)
Ancestries Reported - Greek (%)
Ancestries Reported - Hungarian (%)
Ancestries Reported - Irish (%)
Ancestries Reported - Italian (%)
Ancestries Reported - Lithuanian (%)
Ancestries Reported - Norwegian (%)
Ancestries Reported - Polish (%)
Ancestries Reported - Portuguese (%)
Ancestries Reported - Russian (%)
Ancestries Reported - Scotch-Irish (%)
Ancestries Reported - Scottish (%)
Ancestries Reported - Slovak (%)
Ancestries Reported - Subsaharan African (%)
Ancestries Reported - Swedish (%)
Ancestries Reported - Swiss (%)
Ancestries Reported - Ukrainian (%)
Ancestries Reported - United States (%)
Ancestries Reported - Welsh (%)
Ancestries Reported - West Indian (%)
Ancestries Reported - Other (%)
Educational Attainment - No schooling completed (%)
Educational Attainment - Less than high school (%)
Educational Attainment - High school or equivalent (%)
Educational Attainment - Less than 1 year of college (%)
Educational Attainment - 1 or more years of college (%)
Educational Attainment - Associate degree (%)
Educational Attainment - Bachelor's degree (%)
Educational Attainment - Master's degree (%)
Educational Attainment - Professional school degree (%)
Educational Attainment - Doctorate degree (%)
School Enrollment - Nursery, preschool (%)
School Enrollment - Kindergarten (%)
School Enrollment - Grade 1 to 4 (%)
School Enrollment - Grade 5 to 8 (%)
School Enrollment - Grade 9 to 12 (%)
School Enrollment - College undergrad (%)
School Enrollment - Graduate or professional (%)
School Enrollment - Not enrolled in school (%)
School enrollment - Public schools (%)
School enrollment - Private schools (%)
School enrollment - Not enrolled (%)
Median number of rooms in houses and condos
Median number of rooms in apartments
Housing units lacking complete plumbing facilities (%)
Housing units lacking complete kitchen facilities (%)
Density of houses
Urban houses (%)
Rural houses (%)
Households with people 60 years and over (%)
Households with people 65 years and over (%)
Households with people 75 years and over (%)
Households with one or more nonrelatives (%)
Households with no nonrelatives (%)
Population in households (%)
Family households (%)
Nonfamily households (%)
Population in families (%)
Family households with own children (%)
Median number of bedrooms in owner occupied houses
Mean number of bedrooms in owner occupied houses
Median number of bedrooms in renter occupied houses
Mean number of bedrooms in renter occupied houses
Median number of vehichles in owner occupied houses
Mean number of vehichles in owner occupied houses
Median number of vehichles in renter occupied houses
Mean number of vehichles in renter occupied houses
Mortgage status - with mortgage (%)
Mortgage status - with second mortgage (%)
Mortgage status - with home equity loan (%)
Mortgage status - with both second mortgage and home equity loan (%)
Mortgage status - without a mortgage (%)
Average family size
Average family size - White
Average family size - Black or African American
Average family size - Asian
Average family size - Hispanic or Latino
Average family size - American Indian and Alaska Native
Average family size - Multirace
Average family size - Other Race
Geographical mobility - Same house 1 year ago (%)
Geographical mobility - Moved within same county (%)
Geographical mobility - Moved from different county within same state (%)
Geographical mobility - Moved from different state (%)
Geographical mobility - Moved from abroad (%)
Place of birth - Born in state of residence (%)
Place of birth - Born in other state (%)
Place of birth - Native, outside of US (%)
Place of birth - Foreign born (%)
Housing units in structures - 1, detached (%)
Housing units in structures - 1, attached (%)
Housing units in structures - 2 (%)
Housing units in structures - 3 or 4 (%)
Housing units in structures - 5 to 9 (%)
Housing units in structures - 10 to 19 (%)
Housing units in structures - 20 to 49 (%)
Housing units in structures - 50 or more (%)
Housing units in structures - Mobile home (%)
Housing units in structures - Boat, RV, van, etc. (%)
House/condo owner moved in on average (years ago)
Renter moved in on average (years ago)
Year householder moved into unit - Moved in 1999 to March 2000 (%)
Year householder moved into unit - Moved in 1995 to 1998 (%)
Year householder moved into unit - Moved in 1990 to 1994 (%)
Year householder moved into unit - Moved in 1980 to 1989 (%)
Year householder moved into unit - Moved in 1970 to 1979 (%)
Year householder moved into unit - Moved in 1969 or earlier (%)
Means of transportation to work - Drove car alone (%)
Means of transportation to work - Carpooled (%)
Means of transportation to work - Public transportation (%)
Means of transportation to work - Bus or trolley bus (%)
Means of transportation to work - Streetcar or trolley car (%)
Means of transportation to work - Subway or elevated (%)
Means of transportation to work - Railroad (%)
Means of transportation to work - Ferryboat (%)
Means of transportation to work - Taxicab (%)
Means of transportation to work - Motorcycle (%)
Means of transportation to work - Bicycle (%)
Means of transportation to work - Walked (%)
Means of transportation to work - Other means (%)
Working at home (%)
Industry diversity
Most Common Industries - Agriculture, forestry, fishing and hunting, and mining (%)
Most Common Industries - Agriculture, forestry, fishing and hunting (%)
Most Common Industries - Mining, quarrying, and oil and gas extraction (%)
Most Common Industries - Construction (%)
Most Common Industries - Manufacturing (%)
Most Common Industries - Wholesale trade (%)
Most Common Industries - Retail trade (%)
Most Common Industries - Transportation and warehousing, and utilities (%)
Most Common Industries - Transportation and warehousing (%)
Most Common Industries - Utilities (%)
Most Common Industries - Information (%)
Most Common Industries - Finance and insurance, and real estate and rental and leasing (%)
Most Common Industries - Finance and insurance (%)
Most Common Industries - Real estate and rental and leasing (%)
Most Common Industries - Professional, scientific, and management, and administrative and waste management services (%)
Most Common Industries - Professional, scientific, and technical services (%)
Most Common Industries - Management of companies and enterprises (%)
Most Common Industries - Administrative and support and waste management services (%)
Most Common Industries - Educational services, and health care and social assistance (%)
Most Common Industries - Educational services (%)
Most Common Industries - Health care and social assistance (%)
Most Common Industries - Arts, entertainment, and recreation, and accommodation and food services (%)
Most Common Industries - Arts, entertainment, and recreation (%)
Most Common Industries - Accommodation and food services (%)
Most Common Industries - Other services, except public administration (%)
Most Common Industries - Public administration (%)
Occupation diversity
Most Common Occupations - Management, business, science, and arts occupations (%)
Most Common Occupations - Management, business, and financial occupations (%)
Most Common Occupations - Management occupations (%)
Most Common Occupations - Business and financial operations occupations (%)
Most Common Occupations - Computer, engineering, and science occupations (%)
Most Common Occupations - Computer and mathematical occupations (%)
Most Common Occupations - Architecture and engineering occupations (%)
Most Common Occupations - Life, physical, and social science occupations (%)
Most Common Occupations - Education, legal, community service, arts, and media occupations (%)
Most Common Occupations - Community and social service occupations (%)
Most Common Occupations - Legal occupations (%)
Most Common Occupations - Education, training, and library occupations (%)
Most Common Occupations - Arts, design, entertainment, sports, and media occupations (%)
Most Common Occupations - Healthcare practitioners and technical occupations (%)
Most Common Occupations - Health diagnosing and treating practitioners and other technical occupations (%)
Most Common Occupations - Health technologists and technicians (%)
Most Common Occupations - Service occupations (%)
Most Common Occupations - Healthcare support occupations (%)
Most Common Occupations - Protective service occupations (%)
Most Common Occupations - Fire fighting and prevention, and other protective service workers including supervisors (%)
Most Common Occupations - Law enforcement workers including supervisors (%)
Most Common Occupations - Food preparation and serving related occupations (%)
Most Common Occupations - Building and grounds cleaning and maintenance occupations (%)
Most Common Occupations - Personal care and service occupations (%)
Most Common Occupations - Sales and office occupations (%)
Most Common Occupations - Sales and related occupations (%)
Most Common Occupations - Office and administrative support occupations (%)
Most Common Occupations - Natural resources, construction, and maintenance occupations (%)
Most Common Occupations - Farming, fishing, and forestry occupations (%)
Most Common Occupations - Construction and extraction occupations (%)
Most Common Occupations - Installation, maintenance, and repair occupations (%)
Most Common Occupations - Production, transportation, and material moving occupations (%)
Most Common Occupations - Production occupations (%)
Most Common Occupations - Transportation occupations (%)
Most Common Occupations - Material moving occupations (%)
People in Group quarters - Institutionalized population (%)
People in Group quarters - Correctional institutions (%)
People in Group quarters - Federal prisons and detention centers (%)
People in Group quarters - Halfway houses (%)
People in Group quarters - Local jails and other confinement facilities (including police lockups) (%)
People in Group quarters - Military disciplinary barracks (%)
People in Group quarters - State prisons (%)
People in Group quarters - Other types of correctional institutions (%)
People in Group quarters - Nursing homes (%)
People in Group quarters - Hospitals/wards, hospices, and schools for the handicapped (%)
People in Group quarters - Hospitals/wards and hospices for chronically ill (%)
People in Group quarters - Hospices or homes for chronically ill (%)
People in Group quarters - Military hospitals or wards for chronically ill (%)
People in Group quarters - Other hospitals or wards for chronically ill (%)
People in Group quarters - Hospitals or wards for drug/alcohol abuse (%)
People in Group quarters - Mental (Psychiatric) hospitals or wards (%)
People in Group quarters - Schools, hospitals, or wards for the mentally retarded (%)
People in Group quarters - Schools, hospitals, or wards for the physically handicapped (%)
People in Group quarters - Institutions for the deaf (%)
People in Group quarters - Institutions for the blind (%)
People in Group quarters - Orthopedic wards and institutions for the physically handicapped (%)
People in Group quarters - Wards in general hospitals for patients who have no usual home elsewhere (%)
People in Group quarters - Wards in military hospitals for patients who have no usual home elsewhere (%)
People in Group quarters - Juvenile institutions (%)
People in Group quarters - Long-term care (%)
People in Group quarters - Homes for abused, dependent, and neglected children (%)
People in Group quarters - Residential treatment centers for emotionally disturbed children (%)
People in Group quarters - Training schools for juvenile delinquents (%)
People in Group quarters - Short-term care, detention or diagnostic centers for delinquent children (%)
People in Group quarters - Type of juvenile institution unknown (%)
People in Group quarters - Noninstitutionalized population (%)
People in Group quarters - College dormitories (includes college quarters off campus) (%)
People in Group quarters - Military quarters (%)
People in Group quarters - On base (%)
People in Group quarters - Barracks, unaccompanied personnel housing (UPH), (Enlisted/Officer), ;and similar group living quarters for military personnel (%)
People in Group quarters - Transient quarters for temporary residents (%)
People in Group quarters - Military ships (%)
People in Group quarters - Group homes (%)
People in Group quarters - Homes or halfway houses for drug/alcohol abuse (%)
People in Group quarters - Homes for the mentally ill (%)
People in Group quarters - Homes for the mentally retarded (%)
People in Group quarters - Homes for the physically handicapped (%)
People in Group quarters - Other group homes (%)
People in Group quarters - Religious group quarters (%)
People in Group quarters - Dormitories (%)
People in Group quarters - Agriculture workers' dormitories on farms (%)
People in Group quarters - Job Corps and vocational training facilities (%)
People in Group quarters - Other workers' dormitories (%)
People in Group quarters - Crews of maritime vessels (%)
People in Group quarters - Other nonhousehold living situations (%)
People in Group quarters - Other noninstitutional group quarters (%)
Residents speaking English at home (%)
Residents speaking English at home - Born in the United States (%)
Residents speaking English at home - Native, born elsewhere (%)
Residents speaking English at home - Foreign born (%)
Residents speaking Spanish at home (%)
Residents speaking Spanish at home - Born in the United States (%)
Residents speaking Spanish at home - Native, born elsewhere (%)
Residents speaking Spanish at home - Foreign born (%)
Residents speaking other language at home (%)
Residents speaking other language at home - Born in the United States (%)
Residents speaking other language at home - Native, born elsewhere (%)
Residents speaking other language at home - Foreign born (%)
Class of Workers - Employee of private company (%)
Class of Workers - Self-employed in own incorporated business (%)
Class of Workers - Private not-for-profit wage and salary workers (%)
Class of Workers - Local government workers (%)
Class of Workers - State government workers (%)
Class of Workers - Federal government workers (%)
Class of Workers - Self-employed workers in own not incorporated business and Unpaid family workers (%)
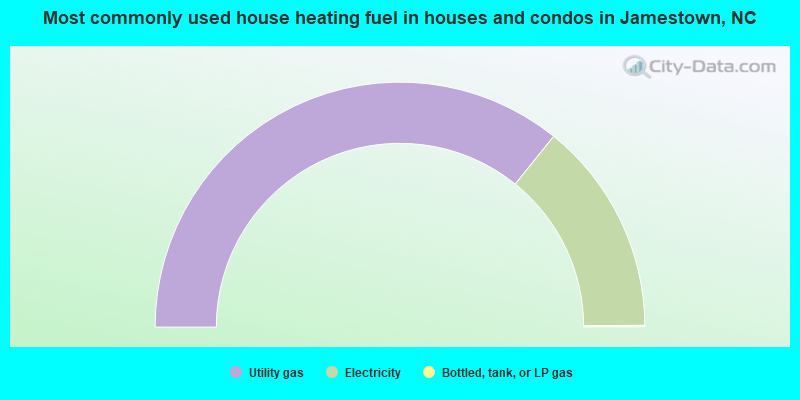
House heating fuel used in houses and condos - Utility gas (%)
House heating fuel used in houses and condos - Bottled, tank, or LP gas (%)
House heating fuel used in houses and condos - Electricity (%)
House heating fuel used in houses and condos - Fuel oil, kerosene, etc. (%)
House heating fuel used in houses and condos - Coal or coke (%)
House heating fuel used in houses and condos - Wood (%)
House heating fuel used in houses and condos - Solar energy (%)
House heating fuel used in houses and condos - Other fuel (%)
House heating fuel used in houses and condos - No fuel used (%)
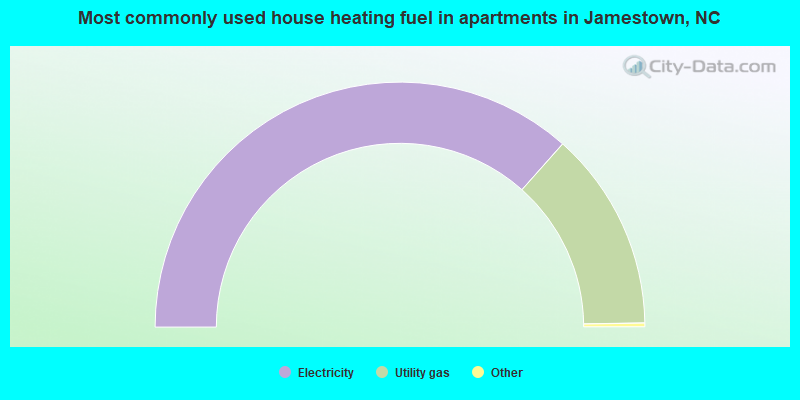
House heating fuel used in apartments - Utility gas (%)
House heating fuel used in apartments - Bottled, tank, or LP gas (%)
House heating fuel used in apartments - Electricity (%)
House heating fuel used in apartments - Fuel oil, kerosene, etc. (%)
House heating fuel used in apartments - Coal or coke (%)
House heating fuel used in apartments - Wood (%)
House heating fuel used in apartments - Solar energy (%)
House heating fuel used in apartments - Other fuel (%)
House heating fuel used in apartments - No fuel used (%)
Armed forces status - In Armed Forces (%)
Armed forces status - Civilian (%)
Armed forces status - Civilian - Veteran (%)
Armed forces status - Civilian - Nonveteran (%)
Fatal accidents locations in years 2005-2021
Fatal accidents locations in 2005
Fatal accidents locations in 2006
Fatal accidents locations in 2007
Fatal accidents locations in 2008
Fatal accidents locations in 2009
Fatal accidents locations in 2010
Fatal accidents locations in 2011
Fatal accidents locations in 2012
Fatal accidents locations in 2013
Fatal accidents locations in 2014
Fatal accidents locations in 2015
Fatal accidents locations in 2016
Fatal accidents locations in 2017
Fatal accidents locations in 2018
Fatal accidents locations in 2019
Fatal accidents locations in 2020
Fatal accidents locations in 2021
Alcohol use - People drinking some alcohol every month (%)
Alcohol use - People not drinking at all (%)
Alcohol use - Average days/month drinking alcohol
Alcohol use - Average drinks/week
Alcohol use - Average days/year people drink much
Audiometry - Average condition of hearing (%)
Audiometry - People that can hear a whisper from across a quiet room (%)
Audiometry - People that can hear normal voice from across a quiet room (%)
Audiometry - Ears ringing, roaring, buzzing (%)
Audiometry - Had a job exposure to loud noise (%)
Audiometry - Had off-work exposure to loud noise (%)
Blood Pressure & Cholesterol - Has high blood pressure (%)
Blood Pressure & Cholesterol - Checking blood pressure at home (%)
Blood Pressure & Cholesterol - Frequently checking blood cholesterol (%)
Blood Pressure & Cholesterol - Has high cholesterol level (%)
Consumer Behavior - Money monthly spent on food at supermarket/grocery store
Consumer Behavior - Money monthly spent on food at other stores
Consumer Behavior - Money monthly spent on eating out
Consumer Behavior - Money monthly spent on carryout/delivered foods
Consumer Behavior - Income spent on food at supermarket/grocery store (%)
Consumer Behavior - Income spent on food at other stores (%)
Consumer Behavior - Income spent on eating out (%)
Consumer Behavior - Income spent on carryout/delivered foods (%)
Current Health Status - General health condition (%)
Current Health Status - Blood donors (%)
Current Health Status - Has blood ever tested for HIV virus (%)
Current Health Status - Left-handed people (%)
Dermatology - People using sunscreen (%)
Diabetes - Diabetics (%)
Diabetes - Had a blood test for high blood sugar (%)
Diabetes - People taking insulin (%)
Diet Behavior & Nutrition - Diet health (%)
Diet Behavior & Nutrition - Milk product consumption (# of products/month)
Diet Behavior & Nutrition - Meals not home prepared (#/week)
Diet Behavior & Nutrition - Meals from fast food or pizza place (#/week)
Diet Behavior & Nutrition - Ready-to-eat foods (#/month)
Diet Behavior & Nutrition - Frozen meals/pizza (#/month)
Drug Use - People that ever used marijuana or hashish (%)
Drug Use - Ever used hard drugs (%)
Drug Use - Ever used any form of cocaine (%)
Drug Use - Ever used heroin (%)
Drug Use - Ever used methamphetamine (%)
Health Insurance - People covered by health insurance (%)
Kidney Conditions-Urology - Avg. # of times urinating at night
Medical Conditions - People with asthma (%)
Medical Conditions - People with anemia (%)
Medical Conditions - People with psoriasis (%)
Medical Conditions - People with overweight (%)
Medical Conditions - Elderly people having difficulties in thinking or remembering (%)
Medical Conditions - People who ever received blood transfusion (%)
Medical Conditions - People having trouble seeing even with glass/contacts (%)
Medical Conditions - People with arthritis (%)
Medical Conditions - People with gout (%)
Medical Conditions - People with congestive heart failure (%)
Medical Conditions - People with coronary heart disease (%)
Medical Conditions - People with angina pectoris (%)
Medical Conditions - People who ever had heart attack (%)
Medical Conditions - People who ever had stroke (%)
Medical Conditions - People with emphysema (%)
Medical Conditions - People with thyroid problem (%)
Medical Conditions - People with chronic bronchitis (%)
Medical Conditions - People with any liver condition (%)
Medical Conditions - People who ever had cancer or malignancy (%)
Mental Health - People who have little interest in doing things (%)
Mental Health - People feeling down, depressed, or hopeless (%)
Mental Health - People who have trouble sleeping or sleeping too much (%)
Mental Health - People feeling tired or having little energy (%)
Mental Health - People with poor appetite or overeating (%)
Mental Health - People feeling bad about themself (%)
Mental Health - People who have trouble concentrating on things (%)
Mental Health - People moving or speaking slowly or too fast (%)
Mental Health - People having thoughts they would be better off dead (%)
Oral Health - Average years since last visit a dentist
Oral Health - People embarrassed because of mouth (%)
Oral Health - People with gum disease (%)
Oral Health - General health of teeth and gums (%)
Oral Health - Average days a week using dental floss/device
Oral Health - Average days a week using mouthwash for dental problem
Oral Health - Average number of teeth
Pesticide Use - Households using pesticides to control insects (%)
Pesticide Use - Households using pesticides to kill weeds (%)
Physical Activity - People doing vigorous-intensity work activities (%)
Physical Activity - People doing moderate-intensity work activities (%)
Physical Activity - People walking or bicycling (%)
Physical Activity - People doing vigorous-intensity recreational activities (%)
Physical Activity - People doing moderate-intensity recreational activities (%)
Physical Activity - Average hours a day doing sedentary activities
Physical Activity - Average hours a day watching TV or videos
Physical Activity - Average hours a day using computer
Physical Functioning - People having limitations keeping them from working (%)
Physical Functioning - People limited in amount of work they can do (%)
Physical Functioning - People that need special equipment to walk (%)
Physical Functioning - People experiencing confusion/memory problems (%)
Physical Functioning - People requiring special healthcare equipment (%)
Prescription Medications - Average number of prescription medicines taking
Preventive Aspirin Use - Adults 40+ taking low-dose aspirin (%)
Reproductive Health - Vaginal deliveries (%)
Reproductive Health - Cesarean deliveries (%)
Reproductive Health - Deliveries resulted in a live birth (%)
Reproductive Health - Pregnancies resulted in a delivery (%)
Reproductive Health - Women breastfeeding newborns (%)
Reproductive Health - Women that had a hysterectomy (%)
Reproductive Health - Women that had both ovaries removed (%)
Reproductive Health - Women that have ever taken birth control pills (%)
Reproductive Health - Women taking birth control pills (%)
Reproductive Health - Women that have ever used Depo-Provera or injectables (%)
Reproductive Health - Women that have ever used female hormones (%)
Sexual Behavior - People 18+ that ever had sex (vaginal, anal, or oral) (%)
Sexual Behavior - Males 18+ that ever had vaginal sex with a woman (%)
Sexual Behavior - Males 18+ that ever performed oral sex on a woman (%)
Sexual Behavior - Males 18+ that ever had anal sex with a woman (%)
Sexual Behavior - Males 18+ that ever had any sex with a man (%)
Sexual Behavior - Females 18+ that ever had vaginal sex with a man (%)
Sexual Behavior - Females 18+ that ever performed oral sex on a man (%)
Sexual Behavior - Females 18+ that ever had anal sex with a man (%)
Sexual Behavior - Females 18+ that ever had any kind of sex with a woman (%)
Sexual Behavior - Average age people first had sex
Sexual Behavior - Average number of female sex partners in lifetime (males 18+)
Sexual Behavior - Average number of female vaginal sex partners in lifetime (males 18+)
Sexual Behavior - Average age people first performed oral sex on a woman (18+)
Sexual Behavior - Average number of woman performed oral sex on in lifetime (18+)
Sexual Behavior - Average number of male sex partners in lifetime (males 18+)
Sexual Behavior - Average number of male anal sex partners in lifetime (males 18+)
Sexual Behavior - Average age people first performed oral sex on a man (18+)
Sexual Behavior - Average number of male oral sex partners in lifetime (18+)
Sexual Behavior - People using protection when performing oral sex (%)
Sexual Behavior - Average number of times people have vaginal or anal sex a year
Sexual Behavior - People having sex without condom (%)
Sexual Behavior - Average number of male sex partners in lifetime (females 18+)
Sexual Behavior - Average number of male vaginal sex partners in lifetime (females 18+)
Sexual Behavior - Average number of female sex partners in lifetime (females 18+)
Sexual Behavior - Circumcised males 18+ (%)
Sleep Disorders - Average hours sleeping at night
Sleep Disorders - People that has trouble sleeping (%)
Smoking-Cigarette Use - People smoking cigarettes (%)
Taste & Smell - People 40+ having problems with smell (%)
Taste & Smell - People 40+ having problems with taste (%)
Taste & Smell - People 40+ that ever had wisdom teeth removed (%)
Taste & Smell - People 40+ that ever had tonsils teeth removed (%)
Taste & Smell - People 40+ that ever had a loss of consciousness because of a head injury (%)
Taste & Smell - People 40+ that ever had a broken nose or other serious injury to face or skull (%)
Taste & Smell - People 40+ that ever had two or more sinus infections (%)
Weight - Average height (inches)
Weight - Average weight (pounds)
Weight - Average BMI
Weight - People that are obese (%)
Weight - People that ever were obese (%)
Weight - People trying to lose weight (%)
Latest news from Jamestown, NC collected exclusively by city-data.com from local newspapers, TV, and radio stations
Ancestries: English (11.7%), Greek (9.1%), German (7.9%), American (7.7%), Irish (6.8%), Scotch-Irish (5.4%).
Current Local Time:
Land area: 2.66 square miles.
Population density: 1,393 people per square mile (low).
238 residents are foreign born (3.5% Latin America , 2.1% Africa ).
This town:
6.4%North Carolina:
8.3%
Median real estate property taxes paid for housing units with mortgages in 2022: $2,475 (0.8%)Median real estate property taxes paid for housing units with no mortgage in 2022: $2,857 (0.9%)
Nearest city with pop. 50,000+: High Point, NC
Nearest city with pop. 200,000+: Greensboro, NC
Nearest city with pop. 1,000,000+: Philadelphia, PA
Nearest cities:
Latitude: 36.00 N, Longitude: 79.94 W
Area code commonly used in this area: 336
Unemployment in December 2023: Here:
3.6%North Carolina:
3.2%
Population change in the 1990s: +347 (+12.7%).
Most common occupations in Jamestown, NC (%)
Both Males Females
Sales representatives, services, wholesale and manufacturing (7.5%)
Other management occupations, except farmers and farm managers (5.7%)
Top executives (4.7%)
Counselors, social workers, and other community and social service specialists (4.2%)
Other sales and related occupations, including supervisors (4.1%)
Preschool, kindergarten, elementary, and middle school teachers (4.0%)
Other office and administrative support workers, including supervisors (3.9%)
Sales representatives, services, wholesale and manufacturing (12.3%)
Top executives (7.9%)
Other sales and related occupations, including supervisors (6.1%)
Other production occupations, including supervisors (6.0%)
Engineers (5.3%)
Other management occupations, except farmers and farm managers (5.1%)
Retail sales workers, except cashiers (4.7%)
Registered nurses (7.0%)
Preschool, kindergarten, elementary, and middle school teachers (6.5%)
Other management occupations, except farmers and farm managers (6.3%)
Information and record clerks, except customer service representatives (5.4%)
Secretaries and administrative assistants (5.2%)
Counselors, social workers, and other community and social service specialists (4.7%)
Other office and administrative support workers, including supervisors (4.4%)
Tornado activity:
Jamestown-area historical tornado activity is near North Carolina state average. It is 20% smaller than the overall U.S. average.
On 5/22/1985, a category F3 (max. wind speeds 158-206 mph) tornado 16.7 miles away from the Jamestown town center caused between $500,000 and $5,000,000 in damages.
On 5/5/1989, a category F3 tornado 17.9 miles away from the town center injured 30 people and caused between $5,000,000 and $50,000,000 in damages.
Earthquake activity:
Jamestown-area historical earthquake activity is significantly above North Carolina state average. It is 31% smaller than the overall U.S. average. On 8/23/2011 at 17:51:04, a magnitude 5.8 (5.8 MW, Depth: 3.7 mi, Class: Moderate, Intensity: VI - VII) earthquake occurred 172.3 miles away from Jamestown center On 8/9/2020 at 12:07:37, a magnitude 5.1 (5.1 MW, Depth: 4.7 mi) earthquake occurred 72.5 miles away from the city center On 8/2/1974 at 08:52:09, a magnitude 4.9 (4.3 MB, 4.9 LG, Class: Light, Intensity: IV - V) earthquake occurred 206.3 miles away from the city center On 7/27/1980 at 18:52:21, a magnitude 5.2 (5.1 MB, 4.7 MS, 5.0 UK, 5.2 UK) earthquake occurred 268.6 miles away from Jamestown center On 12/9/2003 at 20:59:14, a magnitude 4.5 (4.5 MB, 4.5 LG) earthquake occurred 157.3 miles away from Jamestown center On 12/9/2003 at 20:59:18, a magnitude 4.5 (4.5 ML, Depth: 6.2 mi) earthquake occurred 159.4 miles away from Jamestown center Magnitude types: regional Lg-wave magnitude (LG), body-wave magnitude (MB), local magnitude (ML), surface-wave magnitude (MS), moment magnitude (MW) Natural disasters: The number of natural disasters in Guilford County (20) is greater than the US average (15).Major Disasters (Presidential) Declared: 11Emergencies Declared: 6Hurricanes: 8, Winter Storms: 3, Droughts: 2, Ice Storms: 2, Storms: 2, Tornadoes: 2, Blizzard: 1, Flood: 1, Freeze: 1, Snowfall: 1, Other: 1 (Note: some incidents may be assigned to more than one category). Hospitals and medical centers in Jamestown: THE ARC OF HIGH POINT, INC - ICF/MR (301 SOUTHRIDGE RD) ADAMS FARM LIVING AND REHABILITATION (5100 MACKAY ROAD)
THE SHANNON GRAY REHABILITATION AND RECOVERY CENTER (2005 SHANNON GRAY COURT)
BMA OF SOUTHWEST GREENSBORO (5020 MACKAY ROAD)
Amtrak stations near Jamestown: 5 miles: HIGH POINT (100 W. HIGH ST.) Services: partially wheelchair accessible, enclosed waiting area, public restrooms, public payphones, vending machines, paid short-term parking, paid long-term parking, call for car rental service, call for taxi service, public transit connection.
8 miles: GREENSBORO (2603 OAKLAND AVE.) Services: ticket office, fully wheelchair accessible, enclosed waiting area, public restrooms, public payphones, vending machines, free short-term parking, free long-term parking, call for car rental service, call for taxi service.
19 miles: WINSTON-SALEM (127 S. CHERRY ST.) - Bus Station Services: fully wheelchair accessible, enclosed waiting area, public restrooms, public payphones, vending machines, free short-term parking, free long-term parking, call for taxi service.
College/University in Jamestown: Guilford Technical Community College Full-time enrollment: 13,068; Location: 601 High Point Rd.; Public; Website: www.gtcc.edu)
Other colleges/universities with over 2000 students near Jamestown:
High Point University (about 4 miles; High Point, NC ; Full-time enrollment: 4,240)
Guilford College (about 8 miles; Greensboro, NC ; FT enrollment: 2,211)
University of North Carolina at Greensboro (about 9 miles; Greensboro, NC ; FT enrollment: 16,174)
North Carolina A & T State University (about 11 miles; Greensboro, NC ; FT enrollment: 9,805)
Davidson County Community College (about 17 miles; Thomasville, NC ; FT enrollment: 3,581)
Winston-Salem State University (about 18 miles; Winston-Salem, NC ; FT enrollment: 5,378)
Forsyth Technical Community College (about 20 miles; Winston Salem, NC ; FT enrollment: 7,190)
Public high schools in Jamestown: LUCY RAGSDALE HIGH Location: 1000 LUCY RAGSDALE DRIVE, Grades: 9-12)GTCC MIDDLE COLLEGE HIGH Location: 601 EAST MAIN STREET, Grades: 9-12)HAYNES INMAN EDUCATION CENTER Location: 200 HAYNES ROAD, Grades: PK-12)
C JOYNER GREENE EDUCATION CENTER Location: 604 EAST MAIN STREET, Grades: 9-12)
Public elementary/middle schools in Jamestown:
See full list of schools located in Jamestown Birthplace of: Clyde Simms - Soccer player, Michael Burton - College football player (East Carolina Pirates), Pep Young - Baseball player.
Guilford County has a predicted average indoor radon screening level less than 2 pCi/L (pico curies per liter) - Low Potential Average household size: This town:
2.5 peopleNorth Carolina:
2.5 people
Percentage of family households: This town:
73.1%Whole state:
66.7%
Percentage of households with unmarried partners: This town:
4.3%Whole state:
5.9%
Likely homosexual households (counted as self-reported same-sex unmarried-partner households)
Lesbian couples: 0.3% of all households Gay men: 0.4% of all households
Banks with branches in Jamestown (2011 data):
High Point Bank and Trust Company: Pennybyrn Branch, Pennybyrn Branch, Jamestown Branch. Info updated 2006/10/19: Bank assets: $790.5 mil, Deposits: $617.9 mil, headquarters in High Point, NC, negative income in the last year , Commercial Lending Specialization, 13 total offices , Holding Company: High Point Bank Corporation
NewBridge Bank: Jamestown Branch at 120 East Main Street, branch established on 2004/04/08. Info updated 2012/03/07: Bank assets: $1,733.4 mil, Deposits: $1,423.7 mil, headquarters in Greensboro, NC, positive income , Commercial Lending Specialization, 31 total offices , Holding Company: Newbridge Bancorp
Communityone Bank, National Association: Hilltop Branch at 5605 Hilltop Rd, branch established on 2008/08/13. Info updated 2007/12/11: Bank assets: $1,666.0 mil, Deposits: $1,443.4 mil, headquarters in Asheboro, NC, negative income in the last year , 46 total offices , Holding Company: Fnb United Corp.
Bank of America, National Association: Adams Farm Branch at 5013 Mackay Road, branch established on 1990/05/07. Info updated 2009/11/18: Bank assets: $1,451,969.3 mil, Deposits: $1,077,176.8 mil, headquarters in Charlotte, NC, positive income , 5782 total offices , Holding Company: Bank Of America Corporation
Wells Fargo Bank, National Association: Jamestown Branch at 124 East Main Street, branch established on 1962/03/15. Info updated 2011/04/05: Bank assets: $1,161,490.0 mil, Deposits: $905,653.0 mil, headquarters in Sioux Falls, SD, positive income , 6395 total offices , Holding Company: Wells Fargo & Company
Branch Banking and Trust Company: Jamestown Branch at 120 West Main Street, branch established on 1990/08/20. Info updated 2010/03/29: Bank assets: $168,867.6 mil, Deposits: $127,549.5 mil, headquarters in Winston Salem, NC, positive income , Commercial Lending Specialization, 1793 total offices , Holding Company: Bb&T Corporation
For population 15 years and over in Jamestown:
Never married: 24.7%Now married: 61.1%Separated: 1.2%Widowed: 3.3%Divorced: 9.8% For population 25 years and over in Jamestown:
High school or higher: 99.1%Bachelor's degree or higher: 50.1%Graduate or professional degree: 19.7%Unemployed: 2.5%Mean travel time to work (commute): 13.4 minutes
Education Gini index (Inequality in education) Here:
8.6North Carolina average:
11.7
Religion statistics for Jamestown, NC (based on Guilford County data)
Religion Adherents Congregations Evangelical Protestant 113,377 411 Mainline Protestant 74,143 178 Catholic 20,228 7 Black Protestant 16,255 44 Other 14,164 39 Orthodox 540 4 None 252,345 -
Source: Clifford Grammich, Kirk Hadaway, Richard Houseal, Dale E.Jones, Alexei Krindatch, Richie Stanley and Richard H.Taylor. 2012. 2010 U.S.Religion Census: Religious Congregations & Membership Study. Association of Statisticians of American Religious Bodies. Jones, Dale E., et al. 2002. Congregations and Membership in the United States 2000. Nashville, TN: Glenmary Research Center. Graphs represent county-level data
Food Environment Statistics: Number of grocery stores : 100Here :
2.16 / 10,000 pop.North Carolina :
2.05 / 10,000 pop.
Number of supercenters and club stores : 5Guilford County :
0.11 / 10,000 pop.North Carolina :
0.14 / 10,000 pop.
Number of convenience stores (no gas) : 57Here :
1.23 / 10,000 pop.North Carolina :
0.92 / 10,000 pop.
Number of convenience stores (with gas) : 182Here :
3.92 / 10,000 pop.North Carolina :
4.75 / 10,000 pop.
Number of full-service restaurants : 416Guilford County :
8.96 / 10,000 pop.State :
7.57 / 10,000 pop.
Adult diabetes rate : This county :
9.2%State :
9.8%
Adult obesity rate : Guilford County :
27.8%State :
28.3%
Low-income preschool obesity rate : This county :
14.9%North Carolina :
15.6%
Health and Nutrition: Healthy diet rate : Jamestown:
53.8%North Carolina:
48.9%
Average overall health of teeth and gums : Jamestown:
52.6%North Carolina:
46.1%
Average BMI : Jamestown:
28.3North Carolina:
28.8
People feeling badly about themselves : Here:
20.0%North Carolina:
20.7%
People not drinking alcohol at all : Jamestown:
9.3%North Carolina:
10.7%
Average hours sleeping at night : Here:
6.9North Carolina:
6.8
Overweight people : This city:
33.9%North Carolina:
33.7%
General health condition : Jamestown:
60.5%North Carolina:
55.8%
Average condition of hearing : This city:
80.1%North Carolina:
79.7%
More about Health and Nutrition of Jamestown, NC Residents
Local government employment and payroll (March 2022)
Function
Full-time employees
Monthly full-time payroll
Average yearly full-time wage
Part-time employees
Monthly part-time payroll
Parks and Recreation
13 $53,971 $49,819 13 $5,735 Water Supply
7 $36,193 $62,045 0 $0 Financial Administration
5 $29,255 $70,212 0 $0 Other Government Administration
3 $20,192 $80,768 1 $652 Solid Waste Management
2 $6,917 $41,502 0 $0
Totals for Government
30 $146,528 $58,611 14 $6,387
Jamestown government finances - Expenditure in 2017 (per resident):
Construction - Sewerage: $1,182,000 ($318.43)
Water Utilities: $1,038,000 ($279.63)Parks and Recreation: $20,000 ($5.39)Current Operations - Parks and Recreation: $1,269,000 ($341.86)
Sewerage: $741,000 ($199.62)Financial Administration: $491,000 ($132.27)Regular Highways: $370,000 ($99.68)Water Utilities: $365,000 ($98.33)Solid Waste Management: $292,000 ($78.66)Central Staff Services: $170,000 ($45.80)General Public Buildings: $103,000 ($27.75)General - Other: $79,000 ($21.28)Judicial and Legal Services: $24,000 ($6.47)Local Fire Protection: $5,000 ($1.35)Police Protection: $3,000 ($0.81)General - Interest on Debt: $28,000 ($7.54)
Intergovernmental to Local - Other - Sewerage: $710,000 ($191.27)
Other - Local Fire Protection: $442,000 ($119.07)Other - Police Protection: $339,000 ($91.33)Other - Water Utilities: $266,000 ($71.66)Other - Financial Administration: $10,000 ($2.69)Other Capital Outlay - Water Utilities: $180,000 ($48.49)
Sewerage: $97,000 ($26.13)Parks and Recreation: $68,000 ($18.32)Water Utilities - Interest on Debt: $41,000 ($11.05)
Jamestown government finances - Revenue in 2017 (per resident):
Charges - Sewerage: $2,455,000 ($661.37)
Parks and Recreation: $753,000 ($202.86)Solid Waste Management: $160,000 ($43.10)Miscellaneous Commercial Activities: $52,000 ($14.01)Local Intergovernmental - General Local Government Support: $56,000 ($15.09)
Miscellaneous - General Revenue - Other: $58,000 ($15.62)
Rents: $15,000 ($4.04)Donations From Private Sources: $7,000 ($1.89)Sale of Property: $2,000 ($0.54)Interest Earnings: $0 ($0.00)Revenue - Water Utilities: $982,000 ($264.55)
State Intergovernmental - General Local Government Support: $339,000 ($91.33)
Highways: $76,000 ($20.47)Tax - Property: $1,901,000 ($512.12)
General Sales and Gross Receipts: $568,000 ($153.02)Other License: $2,000 ($0.54)
Jamestown government finances - Debt in 2017 (per resident):
Long Term Debt - Beginning Outstanding - Unspecified Public Purpose: $1,342,000 ($361.53)
Outstanding Unspecified Public Purpose: $1,225,000 ($330.01)Retired Unspecified Public Purpose: $117,000 ($31.52)
6.88% of this county's 2021 resident taxpayers lived in other counties in 2020 ($56,409 average adjusted gross income )
Here:
6.88%North Carolina average:
8.85%
0.01% of residents moved from foreign countries ($118 average AGI )Guilford County:
0.01%North Carolina average:
0.04%
Top counties from which taxpayers relocated into this county between 2020 and 2021:
7.21% of this county's 2020 resident taxpayers moved to other counties in 2021 ($56,265 average adjusted gross income )
Here:
7.21%North Carolina average:
7.89%
0.01% of residents moved to foreign countries ($97 average AGI )Guilford County:
0.01%North Carolina average:
0.03%
Top counties to which taxpayers relocated from this county between 2020 and 2021:
Businesses in Jamestown, NC
Name Count Name Count
Ace Hardware 1 Rite Aid 1 Advance Auto Parts 1 Starbucks 1 Domino's Pizza 1 Subway 2 FedEx 2 U-Haul 1 Kincaid 1 UPS 3 Lane Furniture 1 YMCA 1
Strongest AM radio stations in Jamestown:
WTRU (830 AM; 50 kW; KERNERSVILLE, NC; Owner: TRUTH BROADCASTING CORPORATION)
WIST (790 AM; 2 kW; THOMASVILLE, NC; Owner: GHB RADIO, INC.)
WWBG (1470 AM; 10 kW; GREENSBORO, NC; Owner: TRUTH BROADCASTING COPORATION)
WCOG (1320 AM; 5 kW; GREENSBORO, NC; Owner: TRUTH BROADCASTING CORPORATION)
WMFR (1230 AM; 1 kW; HIGH POINT, NC; Owner: INFINITY RADIO OPERATIONS INC.)
WGOS (1070 AM; daytime; 1 kW; HIGH POINT, NC; Owner: RITCHY BROADCASTING CO., INC.)
WOKX (1590 AM; 1 kW; HIGH POINT, NC; Owner: EASTERN BROADCASTING GROUP, INC.)
WPTF (680 AM; 50 kW; RALEIGH, NC; Owner: FIRST STATE COMMUNICATIONS)
WSJS (600 AM; 5 kW; WINSTON-SALEM, NC)
WSML (1200 AM; 10 kW; GRAHAM, NC; Owner: INFINITY RADIO OPERATIONS INC.)
WFTK (1030 AM; daytime; 50 kW; WAKE FOREST, NC; Owner: POSITIVE RADIO GROUP, INC.)
WKXR (1260 AM; 5 kW; ASHEBORO, NC; Owner: RANDOLPH BROADCASTING, INC.)
WPET (950 AM; 1 kW; GREENSBORO, NC; Owner: ENTERCOM GREENSBORO LICENSE, LLC)
Strongest FM radio stations in Jamestown:
WQMG-FM (97.1 FM; GREENSBORO, NC; Owner: ENTERCOM GREENSBORO LICENSE, LLC)
WOZN (98.7 FM; GREENSBORO, NC; Owner: ENTERCOM GREENSBORO LICENSE, LLC)
WVBZ (100.3 FM; HIGH POINT, NC; Owner: CAPSTAR TX LIMITED PARTNERSHIP)
WMAG (99.5 FM; HIGH POINT, NC; Owner: CAPSTAR TX LIMITED PARTNERSHIP)
WIST-FM (98.3 FM; THOMASVILLE, NC; Owner: WEAM QUALITY RADIO CORP.)
WKRR (92.3 FM; ASHEBORO, NC; Owner: DICK BROADCASTING COMPANY, INC. OF TENNESSEE)
WFDD (88.5 FM; WINSTON-SALEM, NC; Owner: WAKE FOREST UNIVERSITY)
WKZL (107.5 FM; WINSTON-SALEM, NC; Owner: DICK BROADCASTING COMPANY, INC. OF TENNESSEE)
WHPE-FM (95.5 FM; HIGH POINT, NC; Owner: BIBLE BROADCASTING NETWORK, INC.)
WJMH (102.1 FM; REIDSVILLE, NC; Owner: ENTERCOM GREENSBORO LICENSE, LLC)
WHPU (90.3 FM; HIGH POINT, NC; Owner: TRUSTEES OF HIGH POINT COLLEGE, INC.)
WMQX-FM (93.1 FM; WINSTON-SALEM, NC; Owner: ENTERCOM GREENSBORO LICENSE, LLC)
WNAA (90.1 FM; GREENSBORO, NC; Owner: NC AGRICULTURAL & TECHNICAL STATE UNIVERSITY)
WUAG (103.1 FM; GREENSBORO, NC; Owner: U. OF NORTH CAROLINA AT GREENSBORO)
WQFS (90.9 FM; GREENSBORO, NC; Owner: GUILFORD COLLEGE)
WKXU (101.1 FM; BURLINGTON, NC; Owner: CAROLINA RADIO GROUP, INC.)
WGBT (94.5 FM; EDEN, NC; Owner: CLEAR CHANNEL BROADCASTING LICENSES, INC.)
WTQR (104.1 FM; WINSTON-SALEM, NC; Owner: CLEAR CHANNEL BROADCASTING LICENSES, INC.)
W285DJ (104.9 FM; MOUNT AIRY, NC; Owner: TRIAD FAMILY NETWORK, INC,)
WFMX (105.7 FM; STATESVILLE, NC; Owner: MERCURY BROADCASTING COMPANY, INC.)
TV broadcast stations around Jamestown:
WFMY-TV (Channel 2; GREENSBORO, NC; Owner: WFMY TELEVISION CORPORATION)
WUPN-TV (Channel 48; GREENSBORO, NC; Owner: WUPN LICENSEE, LLC)
WXLV-TV (Channel 45; WINSTON-SALEM, NC; Owner: WXLV LICENSEE, LLC)
WTWB-TV (Channel 20; LEXINGTON, NC; Owner: WTWB OF THE TRIAD, LLC)
WLXI-TV (Channel 61; GREENSBORO, NC; Owner: TRI-STATE CHRISTIAN TV, INC.)
WGHP (Channel 8; HIGH POINT, NC; Owner: WGHP LICENSE, INC.)
WGPX (Channel 16; BURLINGTON, NC; Owner: PAXSON GREENSBORO LICENSE, INC.)
WUNC-TV (Channel 4; CHAPEL HILL, NC; Owner: UNIVERSITY OF NORTH CAROLINA)
WAXN (Channel 64; KANNAPOLIS, NC; Owner: WSOC-TV HOLDINGS, INC.)
Jamestown fatal accident statistics for 1975 - 2021
Jamestown fatal accident list:
Sep 18, 2018 08:08 PM, Ssr-1355, Vehicles: 1, Persons: 1, Fatalities: 1, Drunk persons involved: 1Lat: 35.993125, Lon: -79.917739, Vehicles: 1, Persons: 1, Fatalities: 1, Drunk persons involved: 1Lat: 35.978710, Lon: -79.936730, Vehicles: 2, Persons: 2, Fatalities: 1Vehicles: 1, Persons: 3, Fatalities: 1, Drunk persons involved: 1Vehicles: 3, Persons: 4, Fatalities: 1, Drunk persons involved: 1Vehicles: 1, Persons: 2, Fatalities: 1, Drunk persons involved: 1Vehicles: 2, Persons: 3, Fatalities: 1, Drunk persons involved: 1
National Bridge Inventory (NBI) Statistics 11 Number of bridges121ft / 37.2m Total length87,600 Total average daily traffic8,823 Total average daily truck traffic
New bridges - historical statistics
1 1920-1929 2 1950-1959 1 1970-1979 2 1980-1989 1 1990-1999 4 2000-2009
See full National Bridge Inventory statistics for Jamestown, NC
FCC Registered Antenna Towers: 43 (
See the full list of FCC Registered Antenna Towers in Jamestown )
FCC Registered Broadcast Land Mobile Towers: 12 (
See the full list of FCC Registered Broadcast Land Mobile Towers in Jamestown, NC )
FCC Registered Microwave Towers: 4
NC-GSB048D, 250 Robbins Avenue (Lat: 35.990139 Lon: -79.955278), Type: Tank, Structure height: 39.6 m, Call Sign: WQEM512, Assigned Frequencies: 21875.0 MHz, 21825.0 MHz, 21825.0 MHz, 21925.0 MHz, Grant Date: 02/02/2016, Expiration Date: 03/06/2026, Cancellation Date: 04/05/2022, Certifier: Nadja S Sodos-Wallace, Registrant: T-Mobile Usa, Inc., 12920 Se 38th Street, Bellevue, WA 98006, Phone: (425) 383-8401, Fax: (425) 383-4840, Email:
NC-GSB040A, Jay Cee Fairgrounds Lot (Lat: 36.025083 Lon: -79.962806), Type: Ltower, Structure height: 65.8 m, Overall height: 70.4 m, Call Sign: WQEP525, Assigned Frequencies: 17765.0 MHz, 17840.0 MHz, 11225.0 MHz, 11305.0 MHz, Grant Date: 02/17/2016, Expiration Date: 03/17/2026, Cancellation Date: 05/04/2023, Certifier: Nadja S Sodos-Wallace, Registrant: T-Mobile Usa, Inc., 12920 Se 38th Street, Bellevue, WA 98006, Phone: (425) 383-8401, Email:
HIGH POINT EAST NC, 6000 Kersey Valley Road (Lat: 35.962222 Lon: -79.924472), Type: Tower, Structure height: 48.7 m, Overall height: 54.8 m, Call Sign: WQIJ876, Assigned Frequencies: 11605.0 MHz, Grant Date: 02/29/2008, Expiration Date: 02/28/2018, Cancellation Date: 08/29/2009, Certifier: William Chastain, Registrant: Radio Dynamics Corporation, Silver Spring, MD 20914, Phone: (301) 493-5171, Fax: (301) 576-4553, Email:
NC-GSB046D, Guilford Comm College (Lat: 36.001583 Lon: -79.917000), Type: Pole, Structure height: 51.8 m, Call Sign: WQLA670, Assigned Frequencies: 11505.0 MHz, 11505.0 MHz, 11505.0 MHz, 11505.0 MHz, 11505.0 MHz, 11505.0 MHz, 11585.0 MHz, 11585.0 MHz, 11585.0 MHz, 11585.0 MHz... (+6 more), Grant Date: 12/31/2019, Expiration Date: 11/13/2029, Cancellation Date: 10/20/2021, Certifier: Nadja S Sodos-Wallace, Registrant: T-Mobile Usa, Inc., 12920 Se 38th Street, Bellevue, WA 98006, Phone: (425) 383-8401, Fax: (425) 383-4840, Email:
FCC Registered Amateur Radio Licenses: 85 (
See the full list of FCC Registered Amateur Radio Licenses in Jamestown )
FAA Registered Aircraft: 14 (
See the full list of FAA Registered Aircraft in Jamestown )
Home Mortgage Disclosure Act Aggregated Statistics For Year 2009(Based on 3 partial tracts) A) FHA, FSA/RHS & VA B) Conventional C) Refinancings D) Home Improvement Loans F) Non-occupant Loans on Number Average Value Number Average Value Number Average Value Number Average Value Number Average Value
LOANS ORIGINATED 10 $133,486 13 $147,672 59 $168,804 2 $54,380 2 $166,595 APPLICATIONS APPROVED, NOT ACCEPTED 1 $160,070 1 $256,440 3 $147,660 0 $0 0 $0 APPLICATIONS DENIED 2 $106,570 2 $124,025 19 $154,114 2 $17,095 1 $134,110 APPLICATIONS WITHDRAWN 1 $105,870 2 $104,995 14 $142,711 0 $0 1 $94,850 FILES CLOSED FOR INCOMPLETENESS 0 $0 0 $0 6 $152,055 0 $0 0 $0
Aggregated Statistics For Year 2008(Based on 3 partial tracts) A) FHA, FSA/RHS & VA B) Conventional C) Refinancings D) Home Improvement Loans F) Non-occupant Loans on Number Average Value Number Average Value Number Average Value Number Average Value Number Average Value
LOANS ORIGINATED 11 $156,304 27 $166,435 33 $165,505 3 $58,700 6 $139,638 APPLICATIONS APPROVED, NOT ACCEPTED 1 $149,730 3 $174,667 9 $144,637 0 $0 2 $126,805 APPLICATIONS DENIED 2 $124,595 6 $167,638 24 $161,340 2 $43,710 2 $416,685 APPLICATIONS WITHDRAWN 1 $161,520 1 $159,920 13 $171,949 1 $80,960 1 $127,620 FILES CLOSED FOR INCOMPLETENESS 0 $0 0 $0 2 $145,840 0 $0 0 $0
Aggregated Statistics For Year 2007(Based on 3 partial tracts) A) FHA, FSA/RHS & VA B) Conventional C) Refinancings D) Home Improvement Loans F) Non-occupant Loans on Number Average Value Number Average Value Number Average Value Number Average Value Number Average Value
LOANS ORIGINATED 11 $145,461 54 $140,762 38 $154,017 4 $59,482 10 $162,589 APPLICATIONS APPROVED, NOT ACCEPTED 1 $107,170 7 $118,754 9 $91,283 2 $40,540 2 $105,355 APPLICATIONS DENIED 3 $144,847 12 $140,899 29 $191,623 9 $57,440 3 $155,560 APPLICATIONS WITHDRAWN 0 $0 4 $125,432 14 $156,956 1 $105,610 2 $77,430 FILES CLOSED FOR INCOMPLETENESS 0 $0 4 $168,390 3 $258,210 0 $0 0 $0
Aggregated Statistics For Year 2006(Based on 3 partial tracts) A) FHA, FSA/RHS & VA B) Conventional C) Refinancings D) Home Improvement Loans E) Loans on Dwellings For 5+ Families F) Non-occupant Loans on G) Loans On Manufactured Number Average Value Number Average Value Number Average Value Number Average Value Number Average Value Number Average Value Number Average Value
LOANS ORIGINATED 4 $159,302 49 $135,361 50 $135,108 6 $49,995 1 $272,440 9 $110,074 0 $0 APPLICATIONS APPROVED, NOT ACCEPTED 0 $0 6 $113,110 13 $142,593 2 $34,975 0 $0 1 $131,950 0 $0 APPLICATIONS DENIED 0 $0 7 $110,033 39 $144,444 8 $83,111 0 $0 2 $147,510 1 $73,730 APPLICATIONS WITHDRAWN 0 $0 4 $131,232 16 $154,412 2 $65,925 0 $0 1 $66,270 0 $0 FILES CLOSED FOR INCOMPLETENESS 0 $0 2 $171,120 8 $133,680 0 $0 0 $0 1 $53,580 0 $0
Aggregated Statistics For Year 2005(Based on 3 partial tracts) A) FHA, FSA/RHS & VA B) Conventional C) Refinancings D) Home Improvement Loans F) Non-occupant Loans on G) Loans On Manufactured Number Average Value Number Average Value Number Average Value Number Average Value Number Average Value Number Average Value
LOANS ORIGINATED 4 $167,875 59 $130,735 53 $135,605 6 $58,195 8 $96,494 0 $0 APPLICATIONS APPROVED, NOT ACCEPTED 1 $101,460 4 $124,192 11 $131,897 1 $41,720 1 $35,280 0 $0 APPLICATIONS DENIED 1 $172,550 9 $120,633 34 $148,731 6 $44,095 1 $103,440 2 $42,540 APPLICATIONS WITHDRAWN 0 $0 7 $134,980 21 $131,386 2 $90,680 1 $103,460 1 $68,380 FILES CLOSED FOR INCOMPLETENESS 0 $0 2 $89,820 5 $125,836 0 $0 0 $0 0 $0
Aggregated Statistics For Year 2004(Based on 3 partial tracts) A) FHA, FSA/RHS & VA B) Conventional C) Refinancings D) Home Improvement Loans F) Non-occupant Loans on G) Loans On Manufactured Number Average Value Number Average Value Number Average Value Number Average Value Number Average Value Number Average Value
LOANS ORIGINATED 5 $144,356 53 $147,527 55 $131,842 5 $26,396 8 $88,774 0 $0 APPLICATIONS APPROVED, NOT ACCEPTED 0 $0 8 $168,729 10 $119,275 1 $10,200 1 $117,480 1 $22,950 APPLICATIONS DENIED 0 $0 7 $132,550 30 $144,190 5 $40,824 2 $125,550 0 $0 APPLICATIONS WITHDRAWN 0 $0 4 $162,475 16 $154,594 2 $53,725 1 $64,570 0 $0 FILES CLOSED FOR INCOMPLETENESS 0 $0 1 $83,030 5 $140,898 0 $0 0 $0 0 $0
Aggregated Statistics For Year 2003(Based on 3 partial tracts) A) FHA, FSA/RHS & VA B) Conventional C) Refinancings D) Home Improvement Loans F) Non-occupant Loans on Number Average Value Number Average Value Number Average Value Number Average Value Number Average Value
LOANS ORIGINATED 6 $136,153 48 $129,778 140 $137,895 5 $23,852 7 $88,614 APPLICATIONS APPROVED, NOT ACCEPTED 0 $0 4 $106,310 17 $131,228 1 $68,220 1 $61,180 APPLICATIONS DENIED 1 $179,240 8 $104,089 34 $125,442 3 $46,990 1 $73,620 APPLICATIONS WITHDRAWN 1 $96,420 3 $155,737 22 $142,535 0 $0 1 $39,700 FILES CLOSED FOR INCOMPLETENESS 0 $0 1 $97,410 5 $172,572 0 $0 0 $0
Aggregated Statistics For Year 2002(Based on 3 partial tracts) A) FHA, FSA/RHS & VA B) Conventional C) Refinancings D) Home Improvement Loans F) Non-occupant Loans on Number Average Value Number Average Value Number Average Value Number Average Value Number Average Value
LOANS ORIGINATED 3 $149,797 40 $132,613 102 $133,084 6 $33,277 9 $90,792 APPLICATIONS APPROVED, NOT ACCEPTED 0 $0 3 $117,067 11 $110,835 1 $11,340 1 $64,280 APPLICATIONS DENIED 1 $75,660 7 $102,461 24 $98,157 4 $16,332 1 $72,640 APPLICATIONS WITHDRAWN 0 $0 4 $127,400 14 $119,095 1 $49,720 0 $0 FILES CLOSED FOR INCOMPLETENESS 0 $0 1 $117,500 3 $105,533 0 $0 0 $0
Aggregated Statistics For Year 2001(Based on 3 partial tracts) A) FHA, FSA/RHS & VA B) Conventional C) Refinancings D) Home Improvement Loans F) Non-occupant Loans on Number Average Value Number Average Value Number Average Value Number Average Value Number Average Value
LOANS ORIGINATED 11 $125,934 41 $130,815 82 $129,608 5 $31,250 7 $81,857 APPLICATIONS APPROVED, NOT ACCEPTED 1 $71,230 5 $130,254 8 $116,285 2 $18,585 1 $50,630 APPLICATIONS DENIED 1 $100,520 6 $75,638 25 $94,132 3 $25,157 1 $106,780 APPLICATIONS WITHDRAWN 1 $109,590 4 $94,622 10 $114,886 0 $0 1 $59,550 FILES CLOSED FOR INCOMPLETENESS 0 $0 0 $0 2 $56,985 0 $0 0 $0
Aggregated Statistics For Year 2000(Based on 3 partial tracts) A) FHA, FSA/RHS & VA B) Conventional C) Refinancings D) Home Improvement Loans F) Non-occupant Loans on Number Average Value Number Average Value Number Average Value Number Average Value Number Average Value
LOANS ORIGINATED 13 $114,338 57 $129,525 20 $99,180 4 $25,008 3 $78,223 APPLICATIONS APPROVED, NOT ACCEPTED 1 $104,630 8 $98,725 6 $103,418 1 $13,940 0 $0 APPLICATIONS DENIED 1 $65,900 15 $77,867 12 $86,514 4 $24,678 2 $49,845 APPLICATIONS WITHDRAWN 2 $76,570 6 $123,623 7 $74,599 1 $53,750 0 $0 FILES CLOSED FOR INCOMPLETENESS 0 $0 0 $0 1 $91,740 0 $0 0 $0
Aggregated Statistics For Year 1999(Based on 1 full and 3 partial tracts) A) FHA, FSA/RHS & VA B) Conventional C) Refinancings D) Home Improvement Loans E) Loans on Dwellings For 5+ Families F) Non-occupant Loans on Number Average Value Number Average Value Number Average Value Number Average Value Number Average Value Number Average Value
LOANS ORIGINATED 87 $117,601 348 $124,904 210 $107,128 18 $17,341 1 $4,515,390 21 $95,063 APPLICATIONS APPROVED, NOT ACCEPTED 1 $116,000 27 $85,657 46 $96,021 8 $33,019 0 $0 2 $85,685 APPLICATIONS DENIED 6 $114,007 99 $73,859 82 $99,461 19 $11,402 0 $0 5 $82,728 APPLICATIONS WITHDRAWN 4 $101,502 24 $139,356 60 $109,090 10 $42,917 0 $0 2 $67,715 FILES CLOSED FOR INCOMPLETENESS 1 $167,030 5 $118,312 16 $106,041 0 $0 0 $0 0 $0
Detailed HMDA statistics for the following Tracts:
0164.02
, 0165.02
Private Mortgage Insurance Companies Aggregated Statistics For Year 2009(Based on 3 partial tracts) A) Conventional B) Refinancings Number Average Value Number Average Value
LOANS ORIGINATED 3 $126,867 3 $189,303 APPLICATIONS APPROVED, NOT ACCEPTED 1 $101,540 1 $337,280 APPLICATIONS DENIED 1 $96,420 0 $0 APPLICATIONS WITHDRAWN 0 $0 1 $141,790 FILES CLOSED FOR INCOMPLETENESS 0 $0 0 $0
Aggregated Statistics For Year 2008(Based on 3 partial tracts) A) Conventional B) Refinancings C) Non-occupant Loans on Number Average Value Number Average Value Number Average Value
LOANS ORIGINATED 10 $177,636 4 $177,755 1 $218,640 APPLICATIONS APPROVED, NOT ACCEPTED 2 $178,660 0 $0 1 $83,820 APPLICATIONS DENIED 0 $0 1 $206,390 0 $0 APPLICATIONS WITHDRAWN 0 $0 0 $0 0 $0 FILES CLOSED FOR INCOMPLETENESS 0 $0 0 $0 0 $0
Aggregated Statistics For Year 2007(Based on 3 partial tracts) A) Conventional B) Refinancings C) Non-occupant Loans on Number Average Value Number Average Value Number Average Value
LOANS ORIGINATED 15 $149,073 5 $159,168 1 $108,450 APPLICATIONS APPROVED, NOT ACCEPTED 1 $183,150 2 $172,515 0 $0 APPLICATIONS DENIED 0 $0 0 $0 0 $0 APPLICATIONS WITHDRAWN 1 $151,850 1 $115,010 0 $0 FILES CLOSED FOR INCOMPLETENESS 0 $0 0 $0 0 $0
Aggregated Statistics For Year 2006(Based on 3 partial tracts) A) Conventional B) Refinancings Number Average Value Number Average Value
LOANS ORIGINATED 7 $157,656 4 $190,892 APPLICATIONS APPROVED, NOT ACCEPTED 1 $249,200 1 $104,480 APPLICATIONS DENIED 0 $0 0 $0 APPLICATIONS WITHDRAWN 0 $0 0 $0 FILES CLOSED FOR INCOMPLETENESS 0 $0 0 $0
Aggregated Statistics For Year 2005(Based on 3 partial tracts) A) Conventional B) Refinancings C) Non-occupant Loans on Number Average Value Number Average Value Number Average Value
LOANS ORIGINATED 6 $158,068 4 $137,798 1 $105,560 APPLICATIONS APPROVED, NOT ACCEPTED 0 $0 1 $208,390 0 $0 APPLICATIONS DENIED 0 $0 0 $0 0 $0 APPLICATIONS WITHDRAWN 0 $0 1 $84,650 0 $0 FILES CLOSED FOR INCOMPLETENESS 0 $0 0 $0 0 $0
Aggregated Statistics For Year 2004(Based on 3 partial tracts) A) Conventional B) Refinancings C) Non-occupant Loans on Number Average Value Number Average Value Number Average Value
LOANS ORIGINATED 10 $157,696 7 $130,941 1 $130,220 APPLICATIONS APPROVED, NOT ACCEPTED 0 $0 4 $120,595 0 $0 APPLICATIONS DENIED 0 $0 0 $0 0 $0 APPLICATIONS WITHDRAWN 0 $0 1 $87,280 0 $0 FILES CLOSED FOR INCOMPLETENESS 0 $0 0 $0 0 $0
Aggregated Statistics For Year 2003(Based on 3 partial tracts) A) Conventional B) Refinancings C) Non-occupant Loans on Number Average Value Number Average Value Number Average Value
LOANS ORIGINATED 13 $145,652 21 $135,739 1 $72,130 APPLICATIONS APPROVED, NOT ACCEPTED 1 $167,740 4 $118,730 0 $0 APPLICATIONS DENIED 0 $0 0 $0 0 $0 APPLICATIONS WITHDRAWN 0 $0 1 $104,690 0 $0 FILES CLOSED FOR INCOMPLETENESS 0 $0 0 $0 0 $0
Aggregated Statistics For Year 2002(Based on 3 partial tracts) A) Conventional B) Refinancings C) Non-occupant Loans on Number Average Value Number Average Value Number Average Value
LOANS ORIGINATED 10 $149,223 16 $137,881 1 $148,620 APPLICATIONS APPROVED, NOT ACCEPTED 2 $122,910 3 $140,530 0 $0 APPLICATIONS DENIED 0 $0 0 $0 0 $0 APPLICATIONS WITHDRAWN 0 $0 1 $134,970 0 $0 FILES CLOSED FOR INCOMPLETENESS 0 $0 0 $0 0 $0
Aggregated Statistics For Year 2001(Based on 3 partial tracts) A) Conventional B) Refinancings C) Non-occupant Loans on Number Average Value Number Average Value Number Average Value
LOANS ORIGINATED 10 $147,109 10 $154,222 1 $76,400 APPLICATIONS APPROVED, NOT ACCEPTED 2 $120,105 1 $107,580 0 $0 APPLICATIONS DENIED 0 $0 0 $0 0 $0 APPLICATIONS WITHDRAWN 0 $0 1 $100,200 0 $0 FILES CLOSED FOR INCOMPLETENESS 0 $0 0 $0 0 $0
Aggregated Statistics For Year 2000(Based on 3 partial tracts) A) Conventional B) Refinancings Number Average Value Number Average Value
LOANS ORIGINATED 18 $143,524 3 $133,047 APPLICATIONS APPROVED, NOT ACCEPTED 3 $141,577 0 $0 APPLICATIONS DENIED 1 $69,950 0 $0 APPLICATIONS WITHDRAWN 0 $0 0 $0 FILES CLOSED FOR INCOMPLETENESS 0 $0 0 $0
Aggregated Statistics For Year 1999(Based on 1 full and 3 partial tracts) A) Conventional B) Refinancings C) Non-occupant Loans on Number Average Value Number Average Value Number Average Value
LOANS ORIGINATED 174 $135,689 36 $129,878 4 $112,672 APPLICATIONS APPROVED, NOT ACCEPTED 14 $126,776 7 $128,091 1 $107,200 APPLICATIONS DENIED 2 $161,885 0 $0 0 $0 APPLICATIONS WITHDRAWN 4 $189,645 0 $0 0 $0 FILES CLOSED FOR INCOMPLETENESS 0 $0 1 $142,000 0 $0
Detailed PMIC statistics for the following Tracts:
0164.02
, 0165.02
Most common first names in Jamestown, NC among deceased individuals Name Count Lived (average)
William 66 73.2 years Mary 54 78.3 years James 50 72.7 years John 49 76.4 years Charles 36 74.3 years Robert 33 74.3 years George 24 77.1 years Joseph 22 72.6 years Annie 21 83.2 years Dorothy 18 78.2 years
Most common last names in Jamestown, NC among deceased individuals Last name Count Lived (average)
Jones 35 74.8 years Brown 20 73.7 years Davis 18 76.0 years Smith 16 71.0 years Hill 14 74.7 years Williams 14 72.9 years Miller 14 77.4 years Hall 14 74.8 years Johnson 13 75.0 years Hodgin 12 82.6 years
Jamestown compared to North Carolina state average:
Unemployed percentage significantly below state average. Black race population percentage below state average. Renting percentage below state average. Length of stay since moving in significantly above state average. Number of rooms per house above state average. Percentage of population with a bachelor's degree or higher above state average.
#21 on the list of "Top 101 cities with the most residents born in Other Western Africa (population 500+)"
#16 on the list of "Top 101 counties with the highest number of infant deaths per 1000 residents 2007-2013 (pop. 50,000+)"
#31 on the list of "Top 101 counties with the lowest percentage of residents that drank alcohol in the past 30 days"
#34 on the list of "Top 101 counties with the most Mainline Protestant congregations"
#35 on the list of "Top 101 counties with the most Mainline Protestant adherents"
#41 on the list of "Top 101 counties with the highest average weight of females"
Top Patent Applicants
Steven Richard Bopp (31)
Mustafa Guzel (21)
Robert Carl Andrews (18)
Robert C. Andrews (14)
Shaobing Wu (12)
Jayanti Jaganatha Rao (11)
Kalpathy Santhosh (10)
Christopher Behme (10)
Michael Carroll (9)
Jeffrey C. Webster (9)
Total of 223 patent applications in 2008-2024.
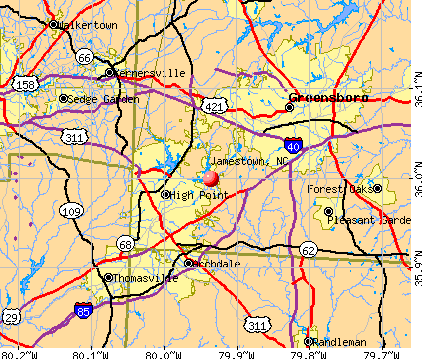


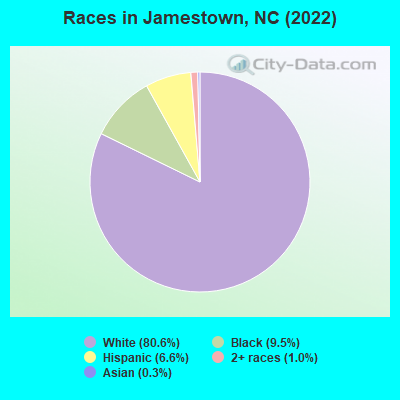
 Recent articles from our blog. Our writers, many of them Ph.D. graduates or candidates, create easy-to-read articles on a wide variety of topics.

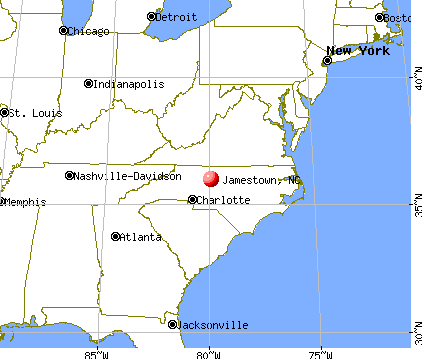
 (4.0 miles
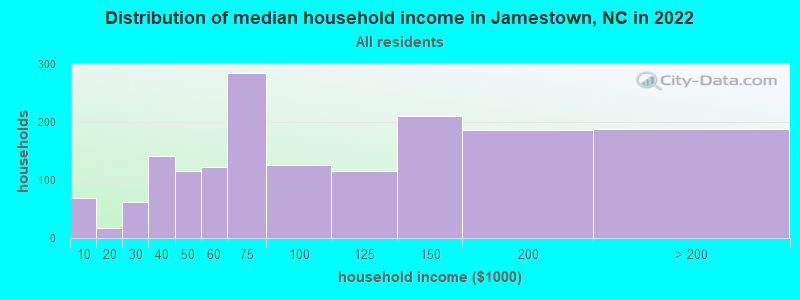
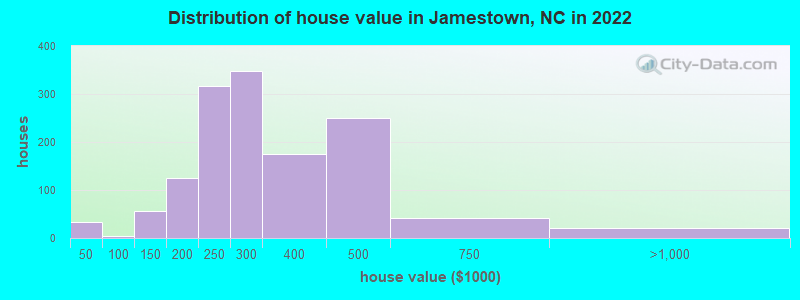
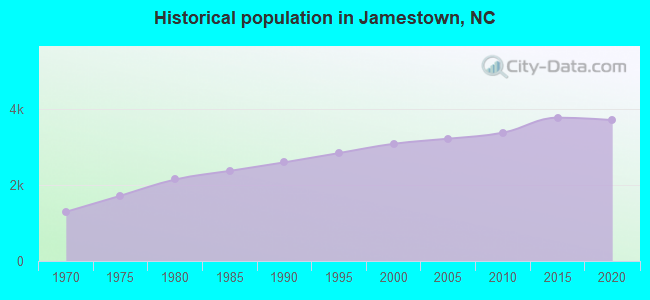
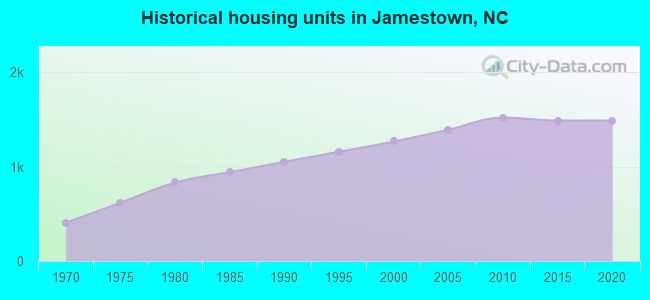
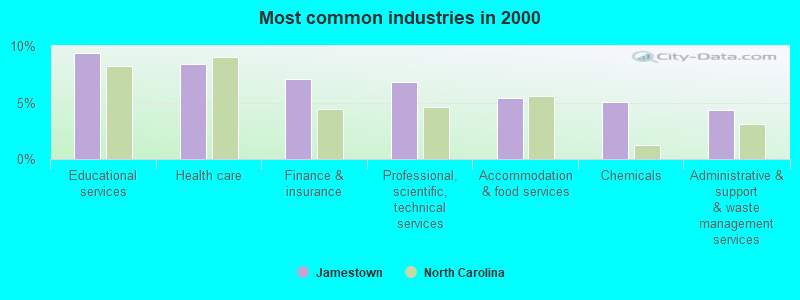
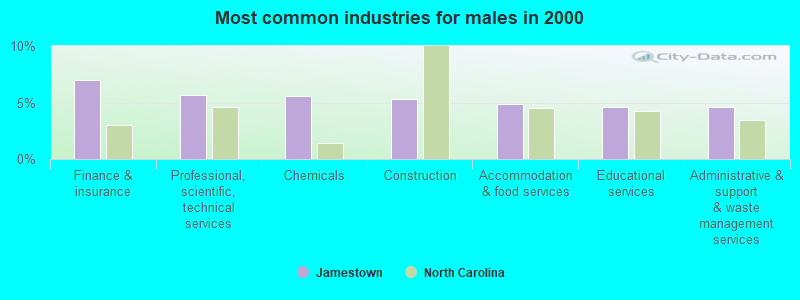
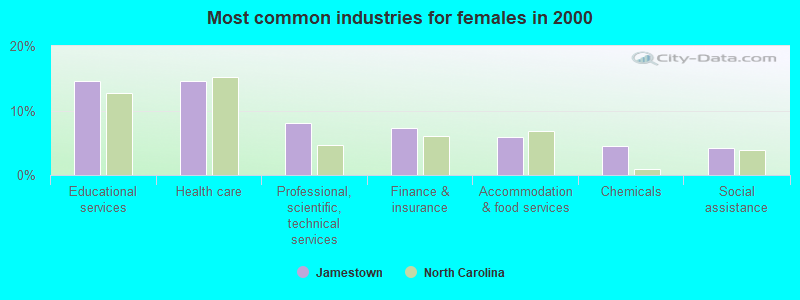
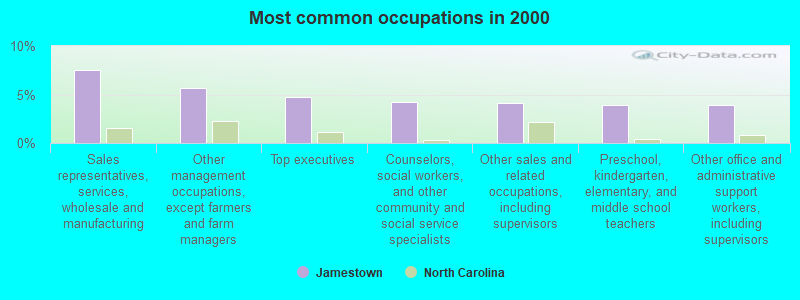
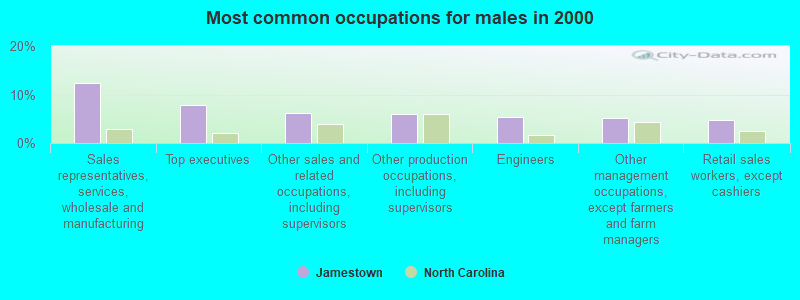
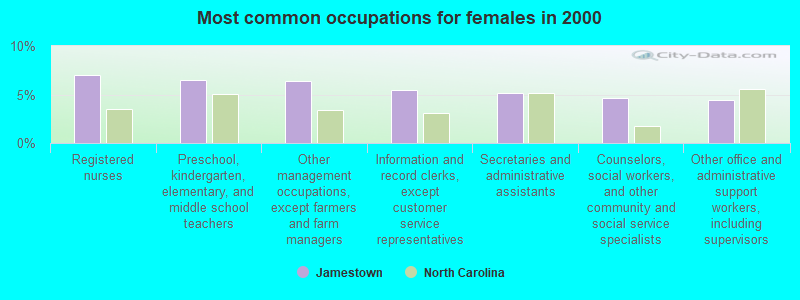
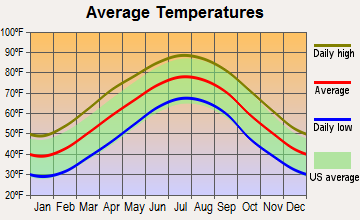
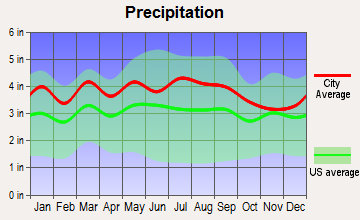
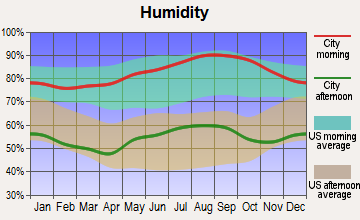
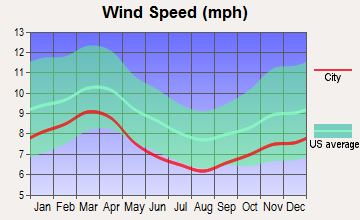
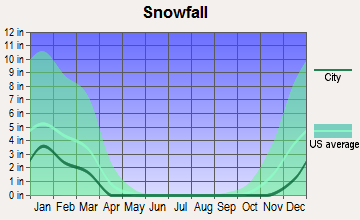

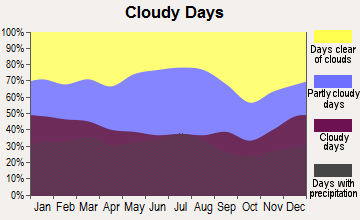
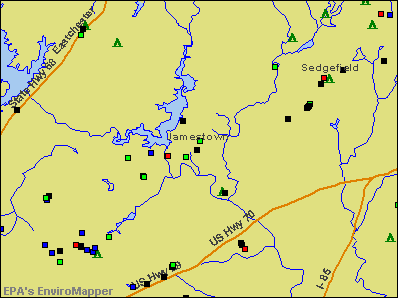

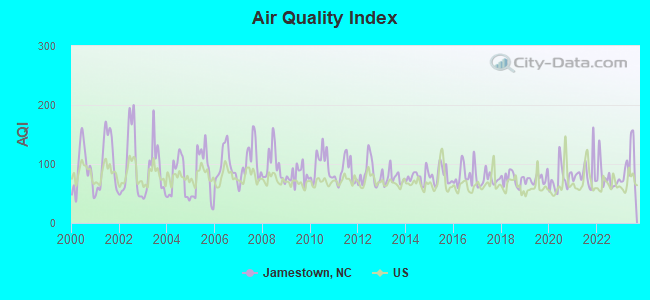
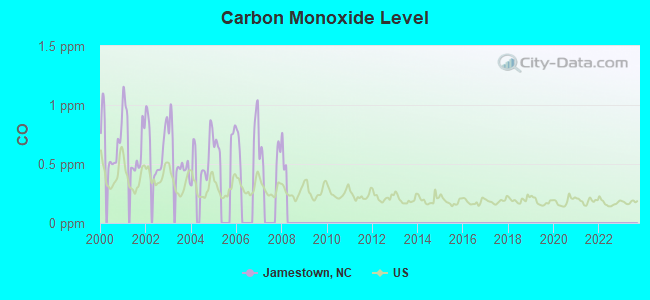
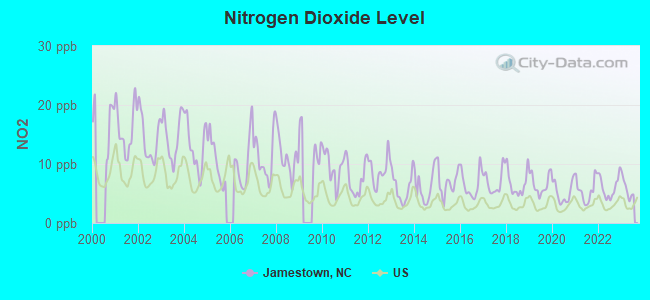
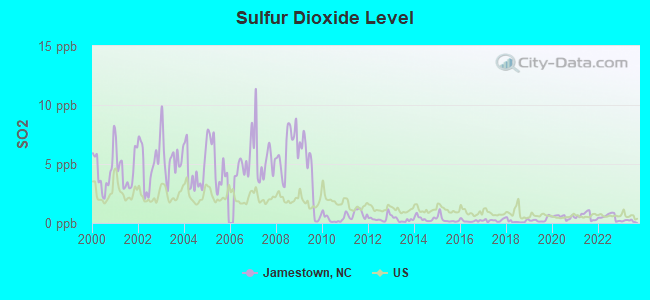
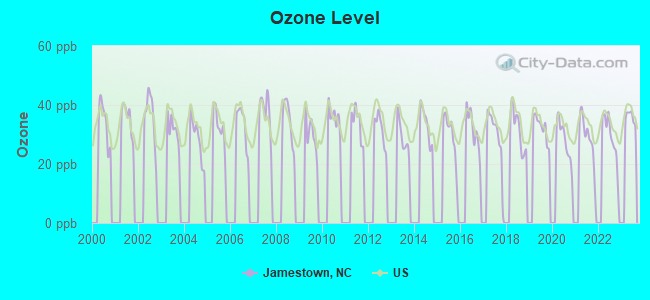
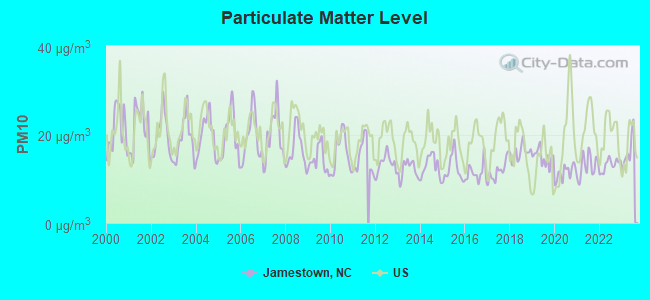
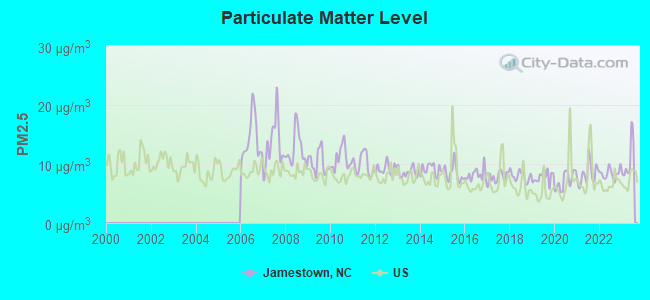

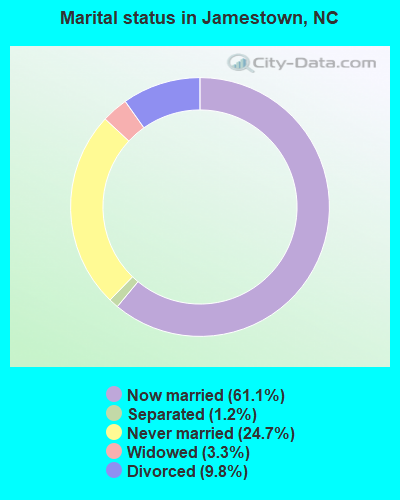
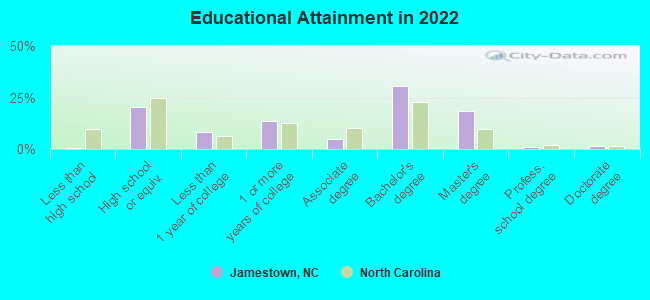
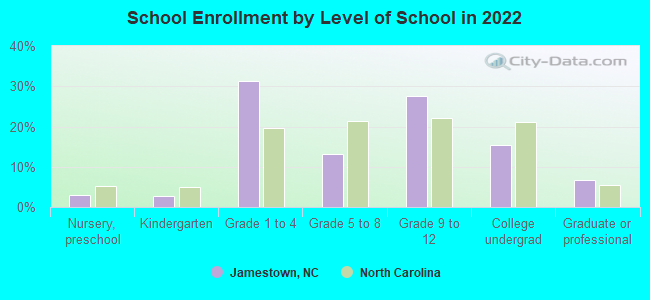
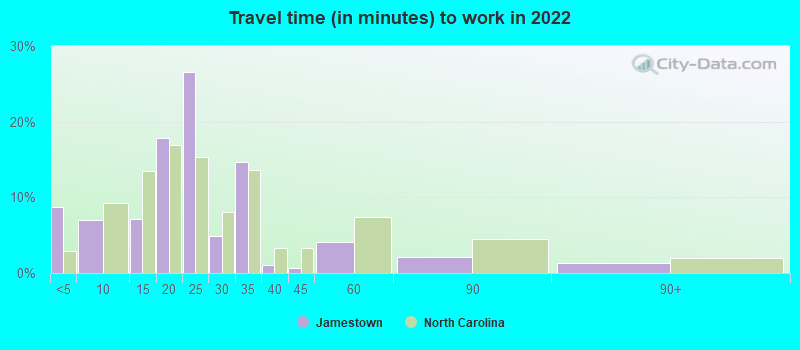
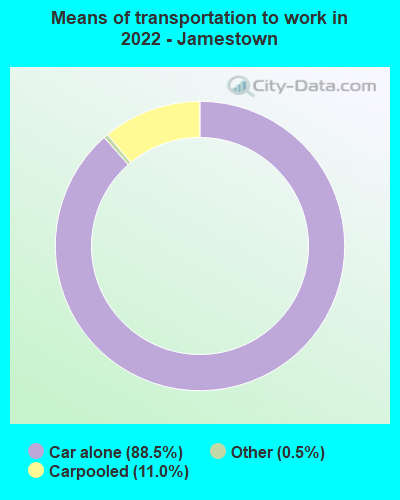
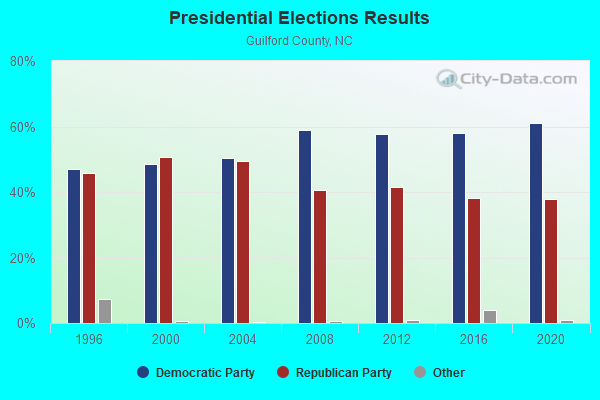
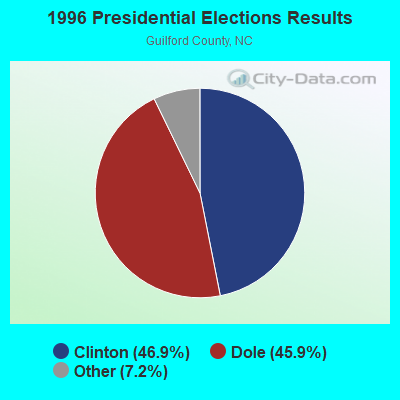
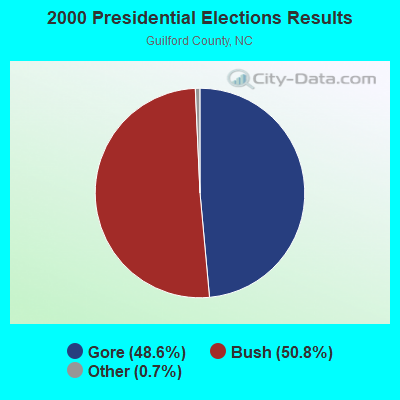
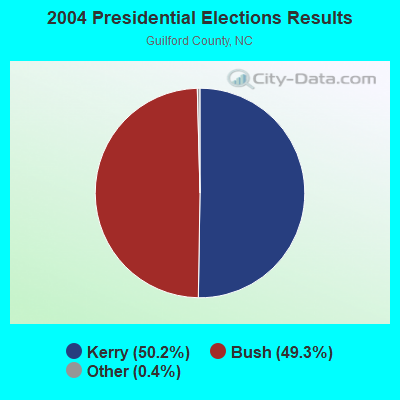
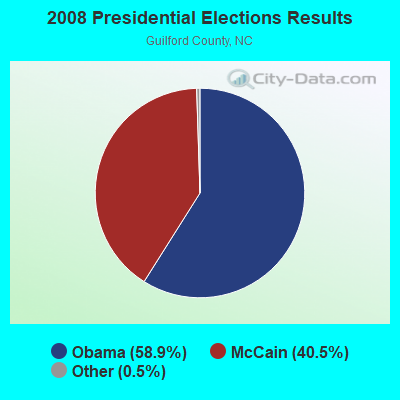
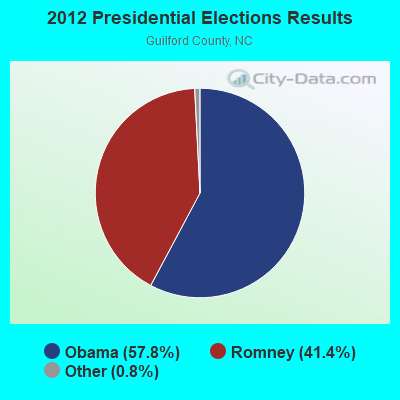
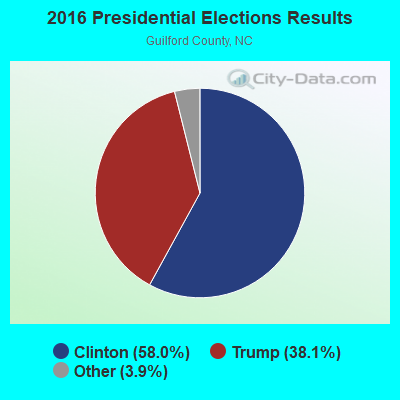
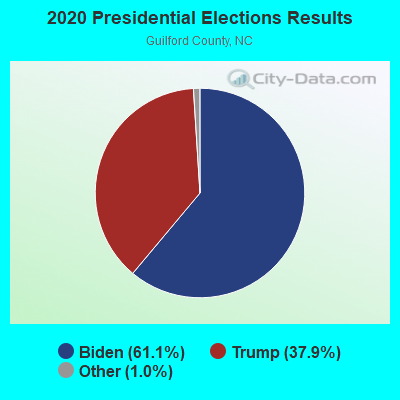
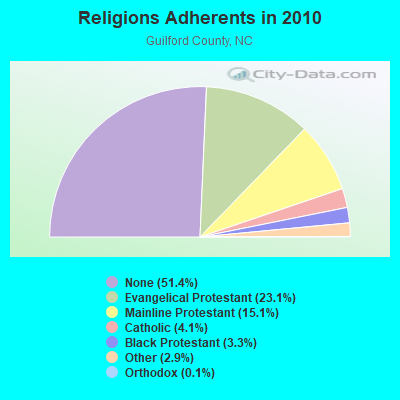
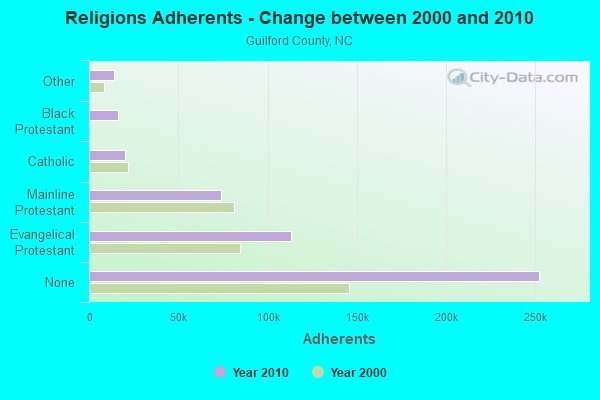
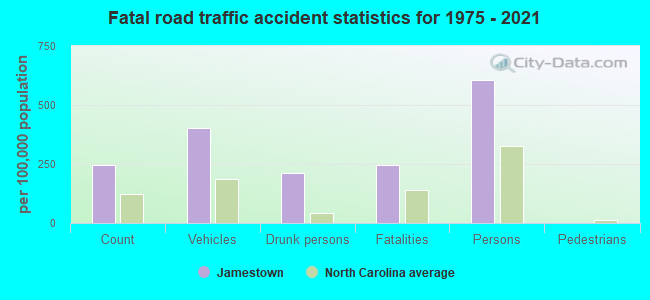
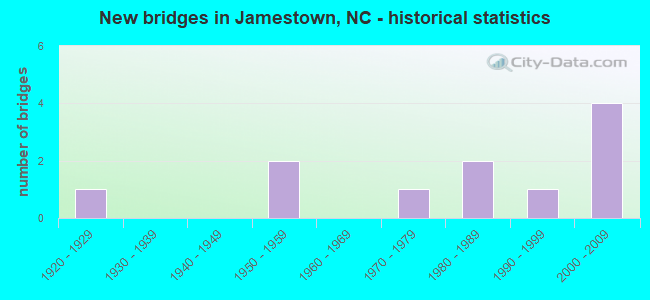
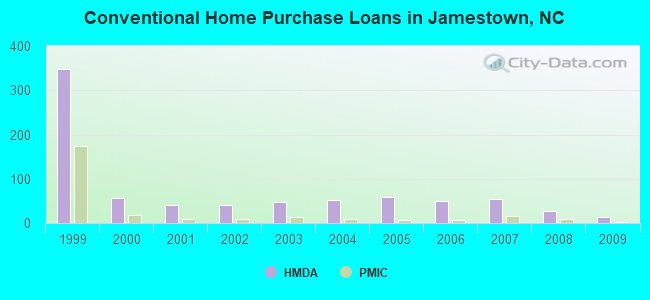
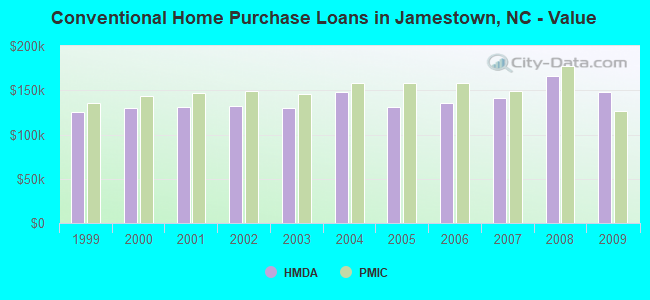
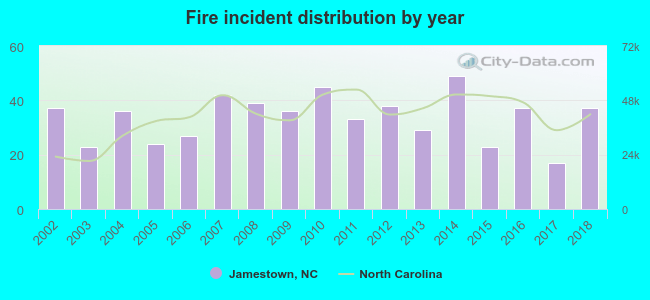 According to the data from the years 2002 - 2018 the average number of fires per year is 34. The highest number of fires - 49 took place in 2014, and the least - 17 in 2017. The data has a constant trend.
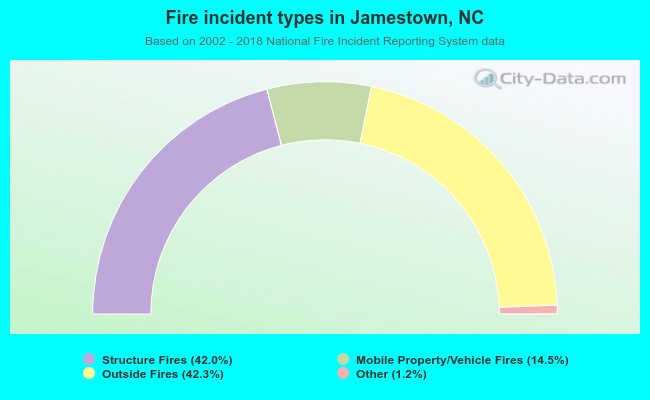 When looking into fire subcategories, the most incidents belonged to: Outside Fires (42.3%), and Structure Fires (42.0%).