Estimated zip code population in 2022: 46,541 Zip code population in 2010: 43,210 Zip code population in 2000: 43,420
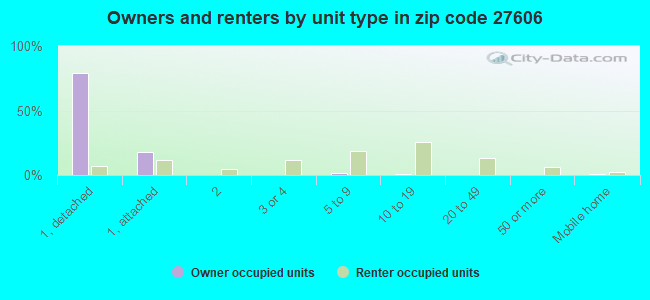
Houses and condos: 21,997 Renter-occupied apartments: 12,071
% of renters here:
62%
State:
33%
March 2022 cost of living index in zip code 27606: 96.7 (near average, U.S. average is 100)
Land area: 24.8 sq. mi. Water area: 0.9 sq. mi.
Population density: 1,877 people per square mile
(low).
OSM Map
General Map
Google Map
MSN Map
OSM Map
General Map
Google Map
MSN Map
OSM Map
General Map
Google Map
MSN Map
OSM Map
General Map
Google Map
MSN Map
Please wait while loading the map...
Real estate property taxes paid for housing units in 2022:
This zip code:
0.6% ($2,825)
North Carolina:
0.6% ($1,769)
Median real estate property taxes paid for housing units with mortgages in 2022: $2,763 (0.6%) Median real estate property taxes paid for housing units with no mortgage in 2022: $2,957 (0.6%)
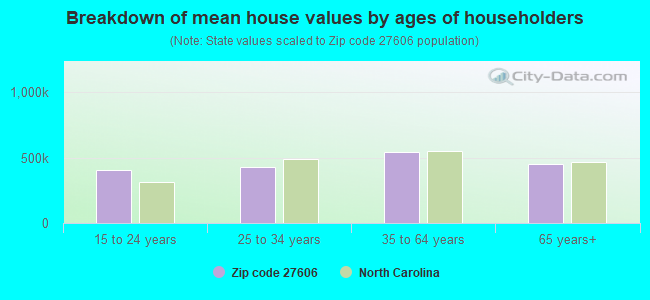
Estimated median house/condo value in 2022: $469,220
27606:
$469,220
North Carolina:
$280,600
According to our research of North Carolina and other state lists, there were 39 registered sex offenders living in 27606 zip code as of April 27, 2024. The ratio of all residents to sex offenders in zip code 27606 is 1,207 to 1. The ratio of registered sex offenders to all residents in this zip code is lower than the state average.
Median resident age:
This zip code:
30.2 years
North Carolina median age:
39.2 years
Average household size:
This zip code:
2.3 people
North Carolina:
2.4 people
Averages for the 2020 tax year for zip code 27606, filed in 2021:
Average Adjusted Gross Income (AGI) in 2020: $71,044 (Individual Income Tax Returns)
Here:
$71,044
State:
$70,020
Salary/wage: $61,560 (reported on 86.6% of returns)
Here:
$61,560
State:
$58,387
(% of AGI for various income ranges: 1286.9% for AGIs below $25k, 3903.0% for AGIs $25k-50k, 7159.4% for AGIs $50k-75k, 10516.2% for AGIs $75k-100k, 19244.3% for AGIs $100k-200k, 82814.9% for AGIs over 200k)
Taxable interest for individuals: $1,303 (reported on 31.7% of returns)
This zip code:
$1,303
North Carolina:
$1,479
(% of AGI for various income ranges: 10.8% for AGIs below $25k, 12.4% for AGIs $25k-50k, 39.8% for AGIs $50k-75k, 58.1% for AGIs $75k-100k, 172.3% for AGIs $100k-200k, 860.7% for AGIs over 200k)
Ordinary dividends: $6,006 (reported on 22.6% of returns)
Here:
$6,006
State:
$7,888
(% of AGI for various income ranges: 17.2% for AGIs below $25k, 25.1% for AGIs $25k-50k, 84.0% for AGIs $50k-75k, 154.3% for AGIs $75k-100k, 544.4% for AGIs $100k-200k, 3585.3% for AGIs over 200k)
Net capital gain/loss in AGI: +$16,207 (reported on 21.1% of returns)
Here:
+$16,207
State:
+$23,652
(% of AGI for various income ranges: 13.0% for AGIs below $25k, 30.9% for AGIs $25k-50k, 86.5% for AGIs $50k-75k, 204.1% for AGIs $75k-100k, 802.8% for AGIs $100k-200k, 12445.3% for AGIs over 200k)
Profit/loss from business: +$10,621 (reported on 17.3% of returns)
Here:
+$10,621
State:
+$11,710
(% of AGI for various income ranges: 127.5% for AGIs below $25k, 161.5% for AGIs $25k-50k, 225.4% for AGIs $50k-75k, 297.4% for AGIs $75k-100k, 360.0% for AGIs $100k-200k, 2690.9% for AGIs over 200k)
Taxable individual retirement arrangement distribution: $19,680 (reported on 6.2% of returns)
27606:
$19,680
North Carolina:
$20,247
(% of AGI for various income ranges: 23.3% for AGIs below $25k, 42.7% for AGIs $25k-50k, 145.4% for AGIs $50k-75k, 228.2% for AGIs $75k-100k, 812.8% for AGIs $100k-200k, 1459.6% for AGIs over 200k)
Self-employed (Keogh) retirement plans: $20,300 (reported on 0.6% of returns)
27606:
$20,300
North Carolina:
$26,749
(% of AGI for various income ranges: 5.0% for AGIs $25k-50k, 18.7% for AGIs $100k-200k, 434.0% for AGIs over 200k)
Total itemized deductions: $32,285 (reported on 8.3% of returns)
Here:
$32,285
State:
$34,549
(% of AGI for various income ranges: 25.5% for AGIs below $25k, 76.4% for AGIs $25k-50k, 239.4% for AGIs $50k-75k, 436.9% for AGIs $75k-100k, 1288.4% for AGIs $100k-200k, 5640.9% for AGIs over 200k)
Charity contributions: $12,997 (reported on 6.9% of returns)
Here:
$12,997
State:
$13,360
(% of AGI for various income ranges: 2.4% for AGIs below $25k, 14.8% for AGIs $25k-50k, 42.0% for AGIs $50k-75k, 83.3% for AGIs $75k-100k, 365.2% for AGIs $100k-200k, 2552.0% for AGIs over 200k)
Taxes paid: $7,984 (reported on 8.3% of returns)
27606:
$7,984
State:
$7,586
(% of AGI for various income ranges: 3.2% for AGIs below $25k, 12.9% for AGIs $25k-50k, 58.1% for AGIs $50k-75k, 128.0% for AGIs $75k-100k, 383.4% for AGIs $100k-200k, 1238.9% for AGIs over 200k)
Earned income credit: $1,924 (reported on 14.6% of returns)
Here:
$1,924
State:
$2,337
(% of AGI for various income ranges: 69.7% for AGIs below $25k, 44.6% for AGIs $25k-50k)
Percentage of individuals using paid preparers for their 2020 taxes: 92.9%
Here:
93%
State:
93%
(% for various income ranges: 92.3% for AGIs below $25k, 94.2% for AGIs $25k-50k, 93.0% for AGIs $50k-75k, 90.8% for AGIs $75k-100k, 92.0% for AGIs $100k-200k, 93.9% for AGIs over 200k)
Averages for the 2012 tax year for zip code 27606, filed in 2013:
Average Adjusted Gross Income (AGI) in 2012: $54,363 (Individual Income Tax Returns)
Here:
$54,363
State:
$54,937
Salary/wage: $45,706 (reported on 89.2% of returns)
Here:
$45,706
State:
$46,336
(% of AGI for various income ranges: 86.1% for AGIs below $25k, 88.6% for AGIs $25k-50k, 81.1% for AGIs $50k-75k, 75.3% for AGIs $75k-100k, 78.0% for AGIs $100k-200k, 56.2% for AGIs over 200k)
Taxable interest for individuals: $1,043 (reported on 35.5% of returns)
This zip code:
$1,043
North Carolina:
$1,298
(% of AGI for various income ranges: 0.5% for AGIs below $25k, 0.4% for AGIs $25k-50k, 0.6% for AGIs $50k-75k, 0.8% for AGIs $75k-100k, 0.9% for AGIs $100k-200k, 0.7% for AGIs over 200k)
Ordinary dividends: $4,560 (reported on 20.6% of returns)
Here:
$4,560
State:
$6,213
(% of AGI for various income ranges: 1.1% for AGIs below $25k, 0.6% for AGIs $25k-50k, 1.4% for AGIs $50k-75k, 1.6% for AGIs $75k-100k, 1.8% for AGIs $100k-200k, 2.8% for AGIs over 200k)
Net capital gain/loss in AGI: +$12,396 (reported on 16.2% of returns)
Here:
+$12,396
State:
+$12,740
(% of AGI for various income ranges: 0.1% for AGIs below $25k, 0.1% for AGIs $25k-50k, 0.6% for AGIs $50k-75k, 0.7% for AGIs $75k-100k, 1.5% for AGIs $100k-200k, 12.1% for AGIs over 200k)
Profit/loss from business: +$11,891 (reported on 14.5% of returns)
Here:
+$11,891
State:
+$10,311
(% of AGI for various income ranges: 6.7% for AGIs below $25k, 2.2% for AGIs $25k-50k, 1.7% for AGIs $50k-75k, 2.3% for AGIs $75k-100k, 2.8% for AGIs $100k-200k, 3.7% for AGIs over 200k)
Taxable individual retirement arrangement distribution: $13,303 (reported on 6.5% of returns)
27606:
$13,303
North Carolina:
$15,575
(% of AGI for various income ranges: 1.3% for AGIs below $25k, 1.0% for AGIs $25k-50k, 1.8% for AGIs $50k-75k, 2.6% for AGIs $75k-100k, 2.3% for AGIs $100k-200k, 0.9% for AGIs over 200k)
Self-employment retirement plans: $16,450 (reported on 0.6% of returns)
27606:
$16,450
North Carolina:
$21,078
(% of AGI for various income ranges: 0.2% for AGIs $50k-75k, 0.3% for AGIs $100k-200k, 0.4% for AGIs over 200k)
Total itemized deductions: $22,879 (19% of AGI, reported on 29.0% of returns)
Here:
$22,879
State:
$23,438
Here:
18.6% of AGI
State:
21.5% of AGI
(% of AGI for various income ranges: 5.6% for AGIs below $25k, 7.6% for AGIs $25k-50k, 12.7% for AGIs $50k-75k, 15.7% for AGIs $75k-100k, 16.0% for AGIs $100k-200k, 12.4% for AGIs over 200k)
Charity contributions: $4,484 (reported on 24.1% of returns)
Here:
$4,484
State:
$4,687
(% of AGI for various income ranges: 0.6% for AGIs below $25k, 0.8% for AGIs $25k-50k, 1.9% for AGIs $50k-75k, 2.5% for AGIs $75k-100k, 2.8% for AGIs $100k-200k, 2.3% for AGIs over 200k)
Taxes paid: $9,581 (reported on 29.0% of returns)
27606:
$9,581
State:
$8,823
(% of AGI for various income ranges: 1.0% for AGIs below $25k, 1.8% for AGIs $25k-50k, 4.1% for AGIs $50k-75k, 6.5% for AGIs $75k-100k, 7.1% for AGIs $100k-200k, 6.8% for AGIs over 200k)
Earned income credit: $2,002 (reported on 15.9% of returns)
Here:
$2,002
State:
$2,376
(% of AGI for various income ranges: 4.6% for AGIs below $25k, 0.7% for AGIs $25k-50k)
Percentage of individuals using paid preparers for their 2012 taxes: 37.6%
Here:
38%
State:
53%
(% for various income ranges: 35.4% for AGIs below $25k, 33.8% for AGIs $25k-50k, 40.1% for AGIs $50k-75k, 40.7% for AGIs $75k-100k, 43.7% for AGIs $100k-200k, 61.5% for AGIs over 200k)
Averages for the 2004 tax year for zip code 27606, filed in 2005:
Average Adjusted Gross Income (AGI) in 2004: $43,280 (Individual Income Tax Returns)
Here:
$43,280
State:
$45,376
Salary/wage: $38,790 (reported on 90.0% of returns)
Here:
$38,790
State:
$39,442
(% of AGI for various income ranges: 123.3% for AGIs below $10k, 89.5% for AGIs $10k-25k, 88.7% for AGIs $25k-50k, 81.4% for AGIs $50k-75k, 78.6% for AGIs $75k-100k, 73.1% for AGIs over 100k)
Taxable interest for individuals: $1,187 (reported on 41.4% of returns)
This zip code:
$1,187
North Carolina:
$1,515
(% of AGI for various income ranges: 2.6% for AGIs below $10k, 1.0% for AGIs $10k-25k, 0.9% for AGIs $25k-50k, 1.3% for AGIs $50k-75k, 1.2% for AGIs $75k-100k, 1.1% for AGIs over 100k)
Taxable dividends: $2,202 (reported on 23.7% of returns)
Here:
$2,202
State:
$4,016
(% of AGI for various income ranges: 2.3% for AGIs below $10k, 0.6% for AGIs $10k-25k, 0.9% for AGIs $25k-50k, 1.3% for AGIs $50k-75k, 1.3% for AGIs $75k-100k, 1.4% for AGIs over 100k)
Net capital gain/loss: +$7,397 (reported on 18.9% of returns)
Here:
+$7,397
State:
+$11,152
(% of AGI for various income ranges: -1.7% for AGIs below $10k, -0.4% for AGIs $10k-25k, 0.3% for AGIs $25k-50k, 0.7% for AGIs $50k-75k, 1.1% for AGIs $75k-100k, 7.2% for AGIs over 100k)
Profit/loss from business: +$10,795 (reported on 12.2% of returns)
Here:
+$10,795
State:
+$9,490
(% of AGI for various income ranges: 5.0% for AGIs below $10k, 3.3% for AGIs $10k-25k, 2.1% for AGIs $25k-50k, 2.2% for AGIs $50k-75k, 3.5% for AGIs $75k-100k, 3.4% for AGIs over 100k)
Profit/loss from farming: +$739 (reported on 0.3% of returns)
Here:
+$739
State:
-$3,231
(% of AGI for various income ranges: -0.0% for AGIs $10k-25k, -0.0% for AGIs $50k-75k, 0.0% for AGIs over 100k)
IRA payment deduction: $2,792 (reported on 2.4% of returns)
27606:
$2,792
North Carolina:
$2,967
(% of AGI for various income ranges: 0.1% for AGIs below $10k, 0.1% for AGIs $10k-25k, 0.2% for AGIs $25k-50k, 0.2% for AGIs $50k-75k, 0.2% for AGIs $75k-100k, 0.1% for AGIs over 100k)
Self-employed pension: $13,336 (reported on 0.9% of returns)
Here:
$13,336
North Carolina:
$14,754
(% of AGI for various income ranges: 0.0% for AGIs $10k-25k, 0.1% for AGIs $50k-75k, 0.4% for AGIs $75k-100k, 0.5% for AGIs over 100k)
Total itemized deductions: $17,647 (21% of AGI, reported on 34.4% of returns)
Here:
$17,647
State:
$19,464
Here:
20.9% of AGI
State:
22.7% of AGI
(% of AGI for various income ranges: 10.8% for AGIs below $10k, 6.7% for AGIs $10k-25k, 9.5% for AGIs $25k-50k, 15.4% for AGIs $50k-75k, 17.9% for AGIs $75k-100k, 16.4% for AGIs over 100k)
Charity contributions deductions: $3,974 (4% of AGI, reported on 27.3% of returns)
Here:
$3,974
State:
$4,035
Here:
4.0% of AGI
State:
4.5% of AGI
(% of AGI for various income ranges: 0.5% for AGIs below $10k, 0.7% for AGIs $10k-25k, 1.3% for AGIs $25k-50k, 2.5% for AGIs $50k-75k, 3.1% for AGIs $75k-100k, 3.4% for AGIs over 100k)
Total tax: $6,783 (reported on 75.5% of returns)
27606:
$6,783
State:
$7,257
(% of AGI for various income ranges: 2.8% for AGIs below $10k, 4.6% for AGIs $10k-25k, 8.0% for AGIs $25k-50k, 10.3% for AGIs $50k-75k, 10.9% for AGIs $75k-100k, 16.6% for AGIs over 100k)
Earned income credit: $1,528 (reported on 11.3% of returns)
Here:
$1,528
State:
$1,851
Percentage of individuals using paid preparers for their 2004 taxes: 39.2%
Here:
39%
State:
62%
(% for various income ranges: 32.7% for AGIs below $10k, 39.8% for AGIs $10k-25k, 39.2% for AGIs $25k-50k, 41.0% for AGIs $50k-75k, 41.8% for AGIs $75k-100k, 49.0% for AGIs over 100k)
Likely homosexual households (counted as self-reported same-sex unmarried-partner households)
Lesbian couples: 0.2% of all households
Gay men: 0.6% of all households
Household received Food Stamps/SNAP in the past 12 months: 1,177 Household did not receive Food Stamps/SNAP in the past 12 months: 18,298
Women who had a birth in the past 12 months: 772 (582 now married, 194 unmarried) Women who did not have a birth in the past 12 months: 13,251 (3,981 now married, 9,233 unmarried)
Housing units in zip code 27606 with a mortgage: 5,246 (482 second mortgage, 3 home equity loan, 469 both second mortgage and home equity loan) Houses without a mortgage: 94
Median monthly owner costs for units with a mortgage: $1,712 Median monthly owner costs for units without a mortgage: $542
Residents with income below the poverty level in 2022:
This zip code:
17.0%
Whole state:
12.8%
Residents with income below 50% of the poverty level in 2022:
This zip code:
6.7%
Whole state:
6.8%
Median number of rooms in houses and condos:
Here:
7.2
State:
6.4
Median number of rooms in apartments:
Here:
3.9
State:
4.4
Notable locations in this zip code not listed on our city pages
Notable locations in zip code 27606: Bev Jones Crossroads (A), Dorton Arena (B), Central Prison (C), Avent Ferry Convention Center (D), Avent Ferry Complex (E), Athens Drive Community Library (F), Raleigh Fire Station Number 8 (G), Joyner Visitor Center (H), Raleigh Fire Station Number 20 (I), Governor Morehead School Library (J), George Worsley Administrative Services Complex (K), McKimmon Center (L), Don E Ellis Laboratories (M), Magnolia Cottage (N). Display/hide their locations on the map
Shopping Centers: Swift Creek Shopping Center (1), South Hills Mall Shopping Center (2), Mission Valley Shopping Center (3). Display/hide their locations on the map
Churches in zip code 27606 include: Westover United Methodist Church (A), Western Boulevard Presbyterian Church (B), Trinity Community Church (C), Triangle Vineyard Christian Fellowship (D), Triangle Community Church First Church of God (E), Swift Creek Christian Fellowship Church (F), South Hills Baptist Church (G), Religious Science Church of Raleigh (H), Raleigh Church of Christ (I). Display/hide their locations on the map
Cemeteries: Franklin Cemetery (1), Jones Cemetery (2), Macedonia Cemetery (3), Patrick Cemetery (4), Stephenson Cemetery (5). Display/hide their locations on the map
Lakes and reservoirs: Woodys Lake (A), Dover Pond A (B), Dix Hill Conference Center Pond (C), Silver Lake (D), Yates Millpond (E), Lake Raleigh (F). Display/hide their locations on the map
Parks in zip code 27606 include: Pullen Park (1), Kentwood Park (2), Kaplan Park (3), Lake Johnson Nature Park (4), Powell Drive Park (5), Lake Wheeler Park (6). Display/hide their locations on the map
4,668 married couples with children.
2,092 single-parent households (304 men, 1,788 women).
76.0% of residents of 27606 zip code speak English at home.
7.3% of residents speak Spanish at home (60% very well, 15% well, 14% not well, 11% not at all).
7.6% of residents speak other Indo-European language at home (69% very well, 23% well, 6% not well, 1% not at all).
4.1% of residents speak Asian or Pacific Island language at home (67% very well, 26% well, 3% not well, 4% not at all).
5.7% of residents speak other language at home (66% very well, 24% well, 6% not well, 4% not at all).
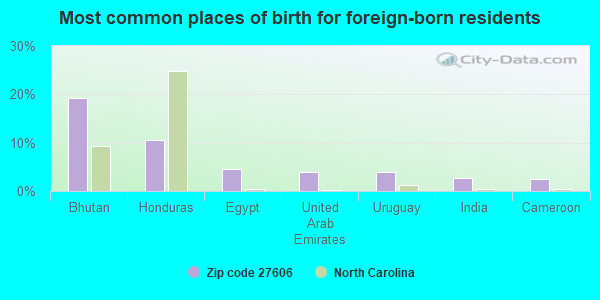
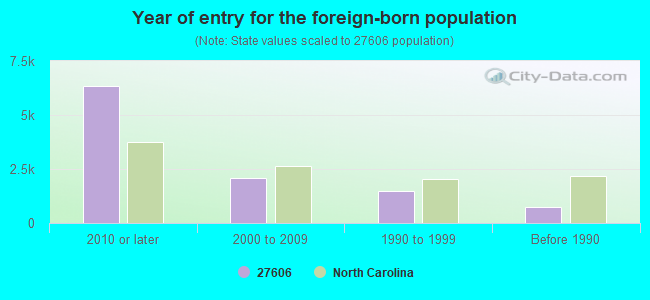
Foreign born population: 8,843 (19.0%) (33.7% of them are naturalized citizens)
ABB TRANSMISSION TECH INS (1021 MAIN CAMPUS DR in RALEIGH, NC)
Conditionally Exempt Small Quantity Generators, less than 100 kg/month of hazardous waste (Resource Conservation and Recovery Act (tracking hazardous waste)) - notification Organizations: ABB POWER T&D CO INC (CONTACT/OWNER)
B & M BODY WORKS INC (5717 WESTERN BLVD in CARY, NC)
Conditionally Exempt Small Quantity Generators, less than 100 kg/month of hazardous waste (Resource Conservation and Recovery Act (tracking hazardous waste)) - notification Organizations: HASSAN BONKDAR (CONTACT/OWNER)
Housing units lacking complete plumbing facilities: 0.1% Housing units lacking complete kitchen facilities: 0.2%
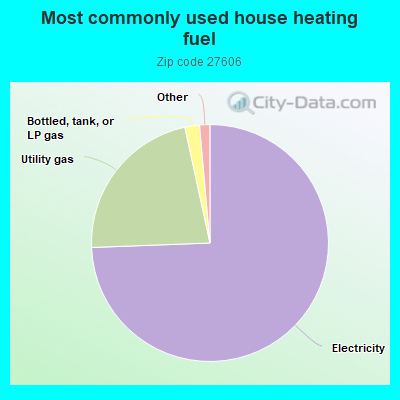
74.4%Electricity
22.2%Utility gas
2.0%Bottled, tank, or LP gas
Population in 1990: 29,446. Population change in the 1990s: +13,974 (+47.5%).
Place of birth for U.S.-born residents:
This state: 19,727
Northeast: 5,616
Midwest: 3,170
South: 6,879
West: 1,336
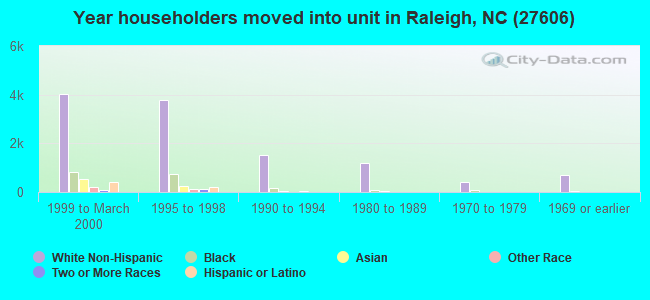
33% of the 27606 zip code residents lived in the same house 5 years ago. Out of people who lived in different houses, 36% lived in this county. Out of people who lived in different counties, 50% lived in North Carolina.
80% of the 27606 zip code residents lived in the same house 1 year ago. Out of people who lived in different houses, 49% moved from this county. Out of people who lived in different houses, 14% moved from different county within same state. Out of people who lived in different houses, 20% moved from different state. Out of people who lived in different houses, 11% moved from abroad.
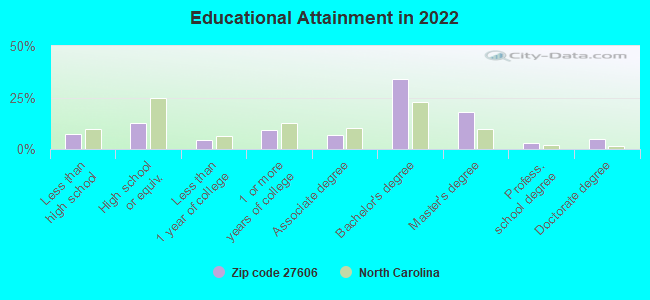
Private vs. public school enrollment:
Students in private schools in grades 1 to 8 (elementary and middle school): 677
Here:
25.1%
North Carolina:
13.8%
Students in private schools in grades 9 to 12 (high school): 205
Here:
17.8%
North Carolina:
11.9%
Students in private undergraduate colleges: 405
Here:
8.9%
North Carolina:
19.3%
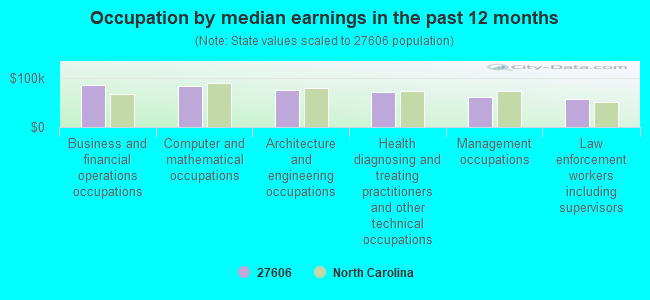
Occupation by median earnings in the past 12 months ($)
85,412Business and financial operations occupations
85,282Computer and mathematical occupations
75,624Architecture and engineering occupations
71,449Health diagnosing and treating practitioners and other technical occupations
62,690Management occupations
57,616Law enforcement workers including supervisors
Companies with biggest federal contracts located in this zip code (RALEIGH, NC):
GREENHORNE & OMARA, INC (5565 CENTERVIEW DRIVE, SUI) : $4,843,599 in 131 contractsfrom 2000 to 2006
Contracts for Architect - Engineer Services (including landscaping, interior layout, and designing), Land Surveys, Cadastral Services (non-construction), Engineering Drafting Services, Other Architect and Engineering Services, and moreby Air Force, U.S. Army Corps of Engineers - civil program financing only, Army Signed by year:2000: $182,485; 2001: $396,802; 2002: $584,786; 2003: $1,318,488; 2004: $1,124,402; 2005: $613,079; 2006: $623,557.
Biggest contracts:
$272,814 with Air Force for Architect - Engineer Services (including landscaping, interior layout, and designing). Signed on 2003-09-28. Completion date: 2004-09-27.
$213,809 with U.S. Army Corps of Engineers - civil program financing only for Land Surveys, Cadastral Services (non-construction). Signed on 2003-03-13. Completion date: 2003-10-09.
$213,719 with Air Force for Engineering Drafting Services. Signed on 2003-03-05. Completion date: 2004-03-04.
$211,013, same as above.Signed on 2002-07-25. Completion date: 2002-08-09.
WESTON SOLUTIONS, INC (4917 WATERS EDGE DRIVE) : $3,571,561 in 52 contractsfrom 2000 to 2006
Contracts for Architect - Engineer Services (including landscaping, interior layout, and designing), Other Architect and Engineering Services by Army, U.S. Army Corps of Engineers - civil program financing only Signed by year:2000: $37,515; 2001: $0; 2002: $630,909; 2003: $450,826; 2004: $917,172; 2005: $1,104,278; 2006: $430,861.
Biggest contracts:
$287,818 with Army for Architect - Engineer Services (including landscaping, interior layout, and designing). Taking place in VA. Signed on 2005-03-21. Completion date: 2005-02-28.
$250,967, same as above.Signed on 2005-09-29. Completion date: 2005-09-20.
$173,690 with Army for Architect - Engineer Services (including landscaping, interior layout, and designing). Taking place in FL. Signed on 2006-02-02. Completion date: 2006-02-17.
$159,987 with Army for Architect - Engineer Services (including landscaping, interior layout, and designing). Taking place in GA. Signed on 2005-09-01. Completion date: 2005-08-29.
STANTEC CONSULTING SERVICES IN (801 JONES FRANKLIN RD, SUI) : $1,133,135 in 38 contractsfrom 1999 to 2005
Contracts for Engineering Drafting Services, Environmental Studies and Assessments, Administrative and Service Buildings by Air Force, U.S. Army Corps of Engineers - civil program financing only, Army Signed by year:2000: $243,671; 2001: $575,328; 2002: $174,110; 2003: $24,384; 2004: $73,940; 2005: $7,410; 2006: $0.
Biggest contracts:
$136,065 with Air Force for Engineering Drafting Services. Signed on 2001-07-11. Completion date: 2001-12-10.
$89,769, same as above.Signed on 2001-09-20. Completion date: 2002-10-10.
$85,146, same as above.Signed on 2001-05-18. Completion date: 2001-07-27.
$68,339, same as above.Signed on 2000-12-14. Completion date: 2001-07-27.
CAROLINA UNMANNED VEHICLES, IN (4105 GRAHAM-NEWTON ROAD; small business) : $917,470 in 4 contractsfrom 2000 to 2004
$600,000 with Air Force for Other Defense -- Applied Research and Exploratory Development (R&D). Signed on 2004-08-25. Completion date: 2006-05-31.
$147,908, same as above.Signed on 2004-12-16. Completion date: 2006-05-31.
$99,717 with Air Force for Other Defense -- Management and Support (R&D). Signed on 2003-06-09. Completion date: 2004-05-16.
$69,845 with Army for Defense Electronics and Communication Equipment -- Basic Research (R&D). Signed on 2000-12-26. Completion date: 2001-06-21.
NITRONEX CORPORATION (628 HUTTON STREET; small business) : $695,889 in 9 contractsfrom 1999 to 2003
Contracts for Other Defense -- Operational Systems Development (R&D), Other Defense -- Management and Support (R&D), Defense Electronics and Communication Equipment -- Management and Support (R&D), Defense Electronics and Communication Equipment -- Applied Research and Exploratory Development (R&D) by Navy, Air Force Signed by year:2000: $134,989; 2001: $295,000; 2002: $174,019; 2003: $26,881; 2004: $0; 2005: $0; 2006: $0.
Biggest contracts:
$200,000 with Navy for Other Defense -- Operational Systems Development (R&D). Signed on 2001-08-30. Completion date: 2001-10-31.
$174,019 with Navy for Other Defense -- Management and Support (R&D). Signed on 2002-09-16. Completion date: 2003-07-31.
$70,000 with Navy for Defense Electronics and Communication Equipment -- Management and Support (R&D). Signed on 2000-06-02. Completion date: 2000-12-01.
$65,000 with Navy for Other Defense -- Operational Systems Development (R&D). Signed on 2001-04-20. Completion date: 2001-10-31.
EPIC GAMES, INC (5511 CAPITAL CENTER DR # 6; small business) : $525,499 in 4 contractsfrom 2003 to 2005
$250,000 with Army for ADP Software. Signed on 2004-12-13. Completion date: 2003-12-31.
$250,000, same as above.Signed on 2003-12-19. Completion date: 2003-12-31.
$12,999 with Department of Defense for ADP Software. Signed on 2005-08-30. Completion date: 2005-09-07.
$12,500 with Army for ADP Software. Signed on 2004-07-27. Completion date: 2003-12-31.
APPEALING PRODUCTS, INC (3400 SWIFT DR; small business) : $347,204 in 7 contractsfrom 2005 to 2006
Contracts for Hazardous Substance Analysis by Army Signed by year:2000: $0; 2001: $0; 2002: $0; 2003: $0; 2004: $0; 2005: $282,000; 2006: $65,204.
Biggest contracts:
$100,000 with Army for Hazardous Substance Analysis. Signed on 2005-05-17. Completion date: 2006-04-17.
$100,000, same as above.Signed on 2005-07-15. Completion date: 2006-04-17.
$53,104, same as above.Signed on 2006-01-12. Completion date: 2006-04-17.
$50,000, same as above.Signed on 2005-04-18. Completion date: 2006-04-17.
GREENHORNE & O''MARA, INC (5565 CENTERVIEW DR SUITE 1) : $154,425 in 19 contractsfrom 2001 to 2005
Contracts for Architect - Engineer Services (including landscaping, interior layout, and designing), Motors, Electrical, Other Architect and Engineering Services by National Park Service, Defense Logistics Agency, Army Signed by year:2000: $0; 2001: $15,000; 2002: $88,778; 2003: $23,662; 2004: $1,587; 2005: $25,398; 2006: $0.
Biggest contracts:
$57,000 with National Park Service for Architect - Engineer Services (including landscaping, interior layout, and designing). Taking place in MD. Signed on 2002-09-15. Completion date: 2002-12-15.
$25,398 with Defense Logistics Agency for Motors, Electrical. Taking place in NY. Signed on 2005-03-10. Completion date: 2005-11-05.
$24,000 with National Park Service for Architect - Engineer Services (including landscaping, interior layout, and designing). Taking place in MD. Signed on 2002-09-15. Completion date: 2002-11-15.
$15,000, same as above.Signed on 2001-09-15. Completion date: 2002-06-15.
NORTH CAROLINA ST UNIV (COLLEGE OF VET MEDICINE)
$73,510 with National Institutes of Health for Scientific Data Studies. Signed on 2003-12-17. Completion date: 2004-10-31.
ABB INC (1021 MAIN CAMPUS DRIVE) : $43,579 in 4 contractsfrom 2004 to 2006
$19,740 with Army for Electrical Hardware and Supplies. Taking place in KY. Signed on 2004-09-20. Completion date: 2004-09-30.
$19,740 with U.S. Army Corps of Engineers - civil program financing only for Electrical Hardware and Supplies. Taking place in KY. Signed on 2004-09-20. Completion date: 2004-09-30.
$5,000 with Army for Maintenance, Repair and Rebuilding of Equipment -- Mechanical Power Transmission Equipment. Taking place in WI. Signed on 2005-08-10. Completion date: 2005-08-31.
-$901, same as above.Signed on 2006-01-31. Completion date: 2005-08-31.
Top industries in this zip code by the number of employees in 2005:
Health Care and Social Assistance: General Medical and Surgical Hospitals (500-999 employees: 1 establishment)
Management of Companies and Enterprises: Corporate, Subsidiary, and Regional Managing Offices (250-499: 1, 50-99: 1, 20-49: 1, 1-4: 1)
Administrative and Support and Waste Management and Remediation Services: Temporary Help Services (100-249: 1, 50-99: 2, 20-49: 2, 1-4: 4)
Other Services (except Public Administration): Other Similar Organizations (except Business, Professional, Labor, and Political Organizations) (250-499: 1, 10-19: 1)
Wholesale Trade: Construction and Mining (except Oil Well) Machinery and Equipment Merchant Wholesalers (250-499: 1, 5-9: 2)
People in group quarters in 2010:
2,124 people in college/university student housing
870 people in state prisons
55 people in group homes intended for adults
23 people in emergency and transitional shelters (with sleeping facilities) for people experiencing homelessness
18 people in workers' group living quarters and job corps centers
16 people in residential treatment centers for adults
People in group quarters in 2000:
6,419 people in college dormitories (includes college quarters off campus)
1,055 people in state prisons
65 people in nursing homes
30 people in unknown juvenile institutions
20 people in other nonhousehold living situations
16 people in homes for the physically handicapped
8 people in other noninstitutional group quarters
7 people in homes for the mentally ill
7 people in homes for the mentally retarded
6 people in job corps and vocational training facilities
Fatal accident statistics in 2014:
Fatal accident count: 4
Vehicles involved in fatal accidents: 5
Fatal accidents caused by drunken drivers: 3
Fatalities: 4
Persons involved in fatal accidents: 9
Pedestrians involved in fatal accidents: 0
Fatal accident statistics in 2013:
Fatal accident count: 2
Vehicles involved in fatal accidents: 3
Fatal accidents caused by drunken drivers: 0
Fatalities: 2
Persons involved in fatal accidents: 3
Pedestrians involved in fatal accidents: 0
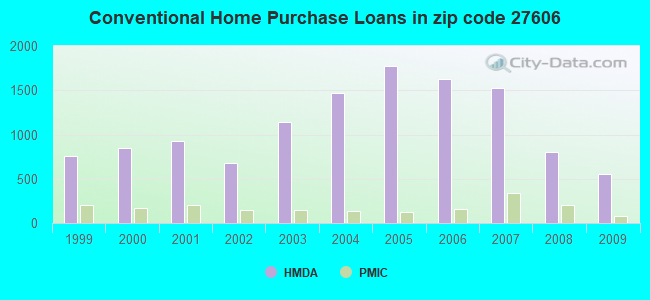
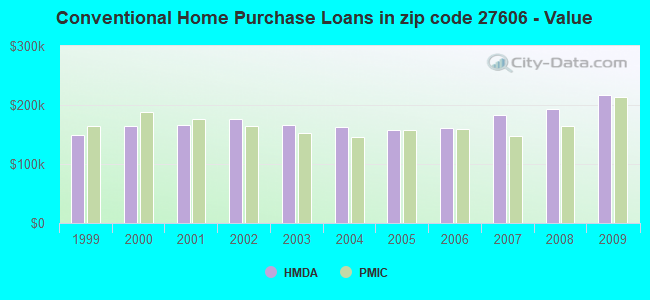
Home Mortgage Disclosure Act Aggregated Statistics For Year 2009 (Based on 4 full and 14 partial tracts)
A) FHA, FSA/RHS & VA Home Purchase Loans
B) Conventional Home Purchase Loans
C) Refinancings
D) Home Improvement Loans
E) Loans on Dwellings For 5+ Families
F) Non-occupant Loans on < 5 Family Dwellings (A B C & D)
G) Loans On Manufactured Home Dwelling (A B C & D)
Number
Average Value
Number
Average Value
Number
Average Value
Number
Average Value
Number
Average Value
Number
Average Value
Number
Average Value
LOANS ORIGINATED
212
$171,667
558
$217,489
2,072
$221,187
49
$175,076
20
$624,648
148
$158,063
8
$49,274
APPLICATIONS APPROVED, NOT ACCEPTED
12
$182,622
34
$274,425
126
$211,397
5
$110,348
0
$0
9
$111,872
3
$68,360
APPLICATIONS DENIED
25
$180,676
71
$195,287
366
$244,684
22
$72,260
2
$312,085
69
$131,580
5
$27,956
APPLICATIONS WITHDRAWN
30
$155,680
74
$175,395
298
$241,965
8
$124,246
0
$0
34
$129,755
2
$25,885
FILES CLOSED FOR INCOMPLETENESS
3
$200,240
15
$289,567
99
$236,434
7
$149,424
0
$0
9
$127,018
1
$347,250
Aggregated Statistics For Year 2008 (Based on 4 full and 14 partial tracts)
A) FHA, FSA/RHS & VA Home Purchase Loans
B) Conventional Home Purchase Loans
C) Refinancings
D) Home Improvement Loans
E) Loans on Dwellings For 5+ Families
F) Non-occupant Loans on < 5 Family Dwellings (A B C & D)
G) Loans On Manufactured Home Dwelling (A B C & D)
Number
Average Value
Number
Average Value
Number
Average Value
Number
Average Value
Number
Average Value
Number
Average Value
Number
Average Value
LOANS ORIGINATED
179
$164,552
799
$194,059
1,037
$205,274
51
$109,440
18
$7,556,668
329
$138,713
14
$30,594
APPLICATIONS APPROVED, NOT ACCEPTED
9
$117,602
89
$231,463
137
$196,557
14
$87,849
0
$0
37
$158,210
4
$69,100
APPLICATIONS DENIED
26
$158,798
103
$193,984
300
$222,180
55
$84,431
0
$0
70
$129,738
9
$42,450
APPLICATIONS WITHDRAWN
21
$159,789
88
$277,811
186
$224,849
17
$204,026
0
$0
39
$133,260
0
$0
FILES CLOSED FOR INCOMPLETENESS
2
$130,490
11
$363,123
37
$230,201
8
$142,066
0
$0
10
$131,182
0
$0
Aggregated Statistics For Year 2007 (Based on 4 full and 14 partial tracts)
A) FHA, FSA/RHS & VA Home Purchase Loans
B) Conventional Home Purchase Loans
C) Refinancings
D) Home Improvement Loans
E) Loans on Dwellings For 5+ Families
F) Non-occupant Loans on < 5 Family Dwellings (A B C & D)
G) Loans On Manufactured Home Dwelling (A B C & D)
Number
Average Value
Number
Average Value
Number
Average Value
Number
Average Value
Number
Average Value
Number
Average Value
Number
Average Value
LOANS ORIGINATED
42
$142,694
1,522
$183,490
890
$185,998
110
$102,872
14
$4,527,824
475
$121,856
10
$50,664
APPLICATIONS APPROVED, NOT ACCEPTED
5
$119,548
155
$178,004
174
$147,522
28
$61,037
0
$0
50
$114,217
1
$26,220
APPLICATIONS DENIED
8
$154,865
170
$181,881
368
$175,310
60
$71,755
0
$0
85
$142,702
12
$49,862
APPLICATIONS WITHDRAWN
1
$111,550
161
$173,769
156
$212,906
13
$149,562
0
$0
31
$123,776
1
$37,650
FILES CLOSED FOR INCOMPLETENESS
0
$0
25
$136,798
48
$282,635
3
$255,507
0
$0
9
$75,078
0
$0
Aggregated Statistics For Year 2006 (Based on 4 full and 14 partial tracts)
A) FHA, FSA/RHS & VA Home Purchase Loans
B) Conventional Home Purchase Loans
C) Refinancings
D) Home Improvement Loans
E) Loans on Dwellings For 5+ Families
F) Non-occupant Loans on < 5 Family Dwellings (A B C & D)
G) Loans On Manufactured Home Dwelling (A B C & D)
Number
Average Value
Number
Average Value
Number
Average Value
Number
Average Value
Number
Average Value
Number
Average Value
Number
Average Value
LOANS ORIGINATED
71
$146,548
1,632
$161,204
863
$161,160
81
$76,950
10
$4,799,494
510
$107,041
13
$98,103
APPLICATIONS APPROVED, NOT ACCEPTED
2
$95,515
150
$163,771
142
$144,775
13
$39,366
0
$0
38
$115,447
6
$65,947
APPLICATIONS DENIED
9
$101,927
224
$149,871
317
$169,010
61
$80,058
0
$0
75
$112,684
15
$75,541
APPLICATIONS WITHDRAWN
9
$155,966
141
$171,008
185
$189,867
14
$78,727
2
$1,083,120
44
$141,473
1
$35,920
FILES CLOSED FOR INCOMPLETENESS
4
$135,550
34
$180,023
63
$186,040
3
$29,427
0
$0
4
$43,420
0
$0
Aggregated Statistics For Year 2005 (Based on 4 full and 14 partial tracts)
A) FHA, FSA/RHS & VA Home Purchase Loans
B) Conventional Home Purchase Loans
C) Refinancings
D) Home Improvement Loans
E) Loans on Dwellings For 5+ Families
F) Non-occupant Loans on < 5 Family Dwellings (A B C & D)
G) Loans On Manufactured Home Dwelling (A B C & D)
Number
Average Value
Number
Average Value
Number
Average Value
Number
Average Value
Number
Average Value
Number
Average Value
Number
Average Value
LOANS ORIGINATED
78
$118,634
1,773
$157,768
1,031
$175,668
93
$81,273
13
$3,973,272
513
$116,416
23
$38,309
APPLICATIONS APPROVED, NOT ACCEPTED
8
$110,448
146
$142,101
173
$134,642
14
$38,972
0
$0
73
$97,908
7
$47,727
APPLICATIONS DENIED
8
$143,786
201
$129,841
322
$150,484
74
$79,092
1
$197,010
86
$121,283
34
$46,447
APPLICATIONS WITHDRAWN
7
$145,380
169
$163,366
231
$160,396
18
$108,476
1
$8,173,450
77
$129,829
4
$54,750
FILES CLOSED FOR INCOMPLETENESS
0
$0
48
$139,743
119
$177,267
2
$79,300
0
$0
15
$104,083
1
$40,340
Aggregated Statistics For Year 2004 (Based on 4 full and 14 partial tracts)
A) FHA, FSA/RHS & VA Home Purchase Loans
B) Conventional Home Purchase Loans
C) Refinancings
D) Home Improvement Loans
E) Loans on Dwellings For 5+ Families
F) Non-occupant Loans on < 5 Family Dwellings (A B C & D)
G) Loans On Manufactured Home Dwelling (A B C & D)
Number
Average Value
Number
Average Value
Number
Average Value
Number
Average Value
Number
Average Value
Number
Average Value
Number
Average Value
LOANS ORIGINATED
106
$134,106
1,468
$161,883
1,318
$169,012
62
$66,252
8
$842,738
538
$103,327
13
$65,695
APPLICATIONS APPROVED, NOT ACCEPTED
4
$98,828
120
$168,460
139
$162,183
8
$67,508
0
$0
47
$113,779
7
$47,201
APPLICATIONS DENIED
10
$134,860
138
$148,550
338
$148,522
46
$37,371
0
$0
71
$119,568
27
$42,987
APPLICATIONS WITHDRAWN
9
$145,556
125
$179,101
247
$171,419
12
$58,003
0
$0
40
$121,001
7
$70,660
FILES CLOSED FOR INCOMPLETENESS
5
$157,370
31
$232,020
63
$184,464
4
$62,018
0
$0
5
$104,010
0
$0
Aggregated Statistics For Year 2003 (Based on 4 full and 14 partial tracts)
A) FHA, FSA/RHS & VA Home Purchase Loans
B) Conventional Home Purchase Loans
C) Refinancings
D) Home Improvement Loans
E) Loans on Dwellings For 5+ Families
F) Non-occupant Loans on < 5 Family Dwellings (A B C & D)
Number
Average Value
Number
Average Value
Number
Average Value
Number
Average Value
Number
Average Value
Number
Average Value
LOANS ORIGINATED
137
$121,401
1,143
$166,386
3,946
$164,634
41
$30,146
8
$1,356,470
611
$104,614
APPLICATIONS APPROVED, NOT ACCEPTED
3
$124,973
62
$167,361
290
$155,225
8
$40,302
0
$0
51
$98,504
APPLICATIONS DENIED
12
$98,348
114
$138,192
403
$147,691
32
$24,313
0
$0
63
$111,770
APPLICATIONS WITHDRAWN
11
$135,069
98
$153,004
381
$164,478
7
$12,997
0
$0
43
$98,526
FILES CLOSED FOR INCOMPLETENESS
2
$109,240
25
$228,101
92
$168,227
0
$0
0
$0
13
$121,405
Aggregated Statistics For Year 2002 (Based on 2 full and 10 partial tracts)
A) FHA, FSA/RHS & VA Home Purchase Loans
B) Conventional Home Purchase Loans
C) Refinancings
D) Home Improvement Loans
E) Loans on Dwellings For 5+ Families
F) Non-occupant Loans on < 5 Family Dwellings (A B C & D)
Number
Average Value
Number
Average Value
Number
Average Value
Number
Average Value
Number
Average Value
Number
Average Value
LOANS ORIGINATED
67
$123,416
682
$176,125
2,380
$186,244
37
$43,364
1
$403,440
178
$109,482
APPLICATIONS APPROVED, NOT ACCEPTED
2
$141,430
65
$129,994
156
$165,785
10
$22,246
0
$0
5
$88,600
APPLICATIONS DENIED
3
$150,940
123
$108,059
252
$135,546
16
$33,250
0
$0
32
$134,914
APPLICATIONS WITHDRAWN
3
$145,873
41
$222,917
218
$172,490
5
$48,154
0
$0
17
$115,674
FILES CLOSED FOR INCOMPLETENESS
3
$157,613
18
$233,991
80
$182,097
0
$0
0
$0
8
$72,425
Aggregated Statistics For Year 2001 (Based on 2 full and 10 partial tracts)
A) FHA, FSA/RHS & VA Home Purchase Loans
B) Conventional Home Purchase Loans
C) Refinancings
D) Home Improvement Loans
E) Loans on Dwellings For 5+ Families
F) Non-occupant Loans on < 5 Family Dwellings (A B C & D)
Number
Average Value
Number
Average Value
Number
Average Value
Number
Average Value
Number
Average Value
Number
Average Value
LOANS ORIGINATED
99
$124,957
922
$166,697
1,460
$186,953
35
$59,413
2
$20,829,550
149
$117,123
APPLICATIONS APPROVED, NOT ACCEPTED
6
$131,843
72
$90,518
109
$155,869
12
$43,187
1
$166,080
7
$149,124
APPLICATIONS DENIED
5
$137,134
167
$63,503
174
$129,866
19
$33,361
0
$0
11
$136,968
APPLICATIONS WITHDRAWN
4
$110,322
68
$142,595
160
$149,235
4
$41,622
0
$0
7
$134,737
FILES CLOSED FOR INCOMPLETENESS
1
$71,950
11
$202,947
34
$160,118
0
$0
0
$0
5
$108,488
Aggregated Statistics For Year 2000 (Based on 2 full and 10 partial tracts)
A) FHA, FSA/RHS & VA Home Purchase Loans
B) Conventional Home Purchase Loans
C) Refinancings
D) Home Improvement Loans
F) Non-occupant Loans on < 5 Family Dwellings (A B C & D)
Number
Average Value
Number
Average Value
Number
Average Value
Number
Average Value
Number
Average Value
LOANS ORIGINATED
68
$125,650
848
$164,369
299
$149,901
63
$29,583
70
$105,181
APPLICATIONS APPROVED, NOT ACCEPTED
22
$62,793
72
$111,398
57
$126,921
22
$30,030
9
$85,759
APPLICATIONS DENIED
27
$67,714
176
$79,170
113
$139,442
21
$36,000
7
$95,764
APPLICATIONS WITHDRAWN
10
$114,631
78
$168,501
67
$105,313
8
$12,239
8
$81,460
FILES CLOSED FOR INCOMPLETENESS
2
$151,060
16
$180,973
17
$158,388
2
$13,025
2
$101,370
Aggregated Statistics For Year 1999 (Based on 2 full and 6 partial tracts)
A) FHA, FSA/RHS & VA Home Purchase Loans
B) Conventional Home Purchase Loans
C) Refinancings
D) Home Improvement Loans
E) Loans on Dwellings For 5+ Families
F) Non-occupant Loans on < 5 Family Dwellings (A B C & D)
2002 - 2018 National Fire Incident Reporting System (NFIRS) incidents
Based on the data from the years 2002 - 2018 the average number of fires per year is 61. The highest number of fires - 113 took place in 2005, and the least - 13 in 2007. The data has an increasing trend.
When looking into fire subcategories, the most reports belonged to: Outside Fires (42.9%), and Structure Fires (35.3%).
Fire incident types reported to NFIRS in Zip Code 27606


+$739
-$3,231
(% of AGI for various income ranges: -0.0% for AGIs $10k-25k, -0.0% for AGIs $50k-75k, 0.0% for AGIs over 100k) Nearest zip codes: 27518, 27607, 27511, 27605, 27601, 27608.
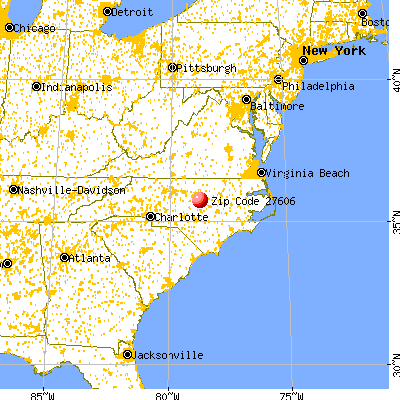


 Based on the data from the years 2002 - 2018 the average number of fires per year is 61. The highest number of fires - 113 took place in 2005, and the least - 13 in 2007. The data has an increasing trend.
 When looking into fire subcategories, the most reports belonged to: Outside Fires (42.9%), and Structure Fires (35.3%).