Estimated zip code population in 2022: 11,036 Zip code population in 2010: 9,450 Zip code population in 2000: 10,228
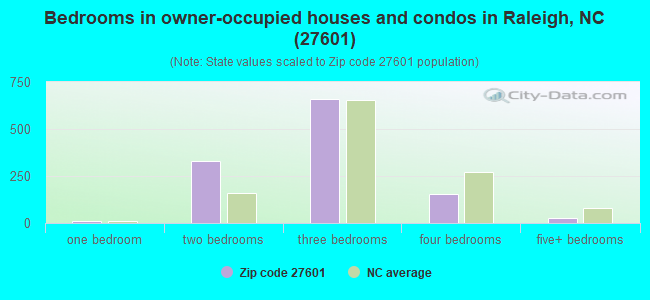
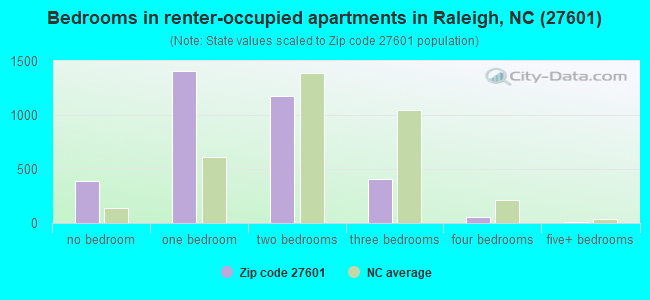
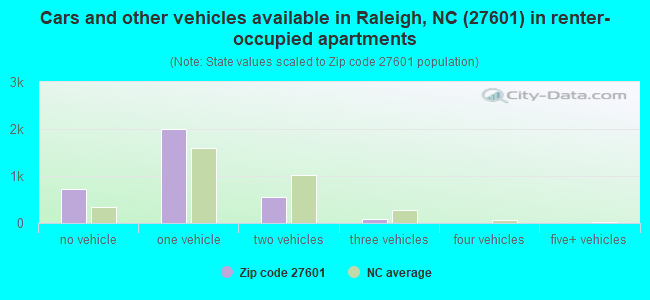
Houses and condos: 5,152 Renter-occupied apartments: 3,414
% of renters here:
74%
State:
33%
March 2022 cost of living index in zip code 27601: 99.5 (near average, U.S. average is 100)
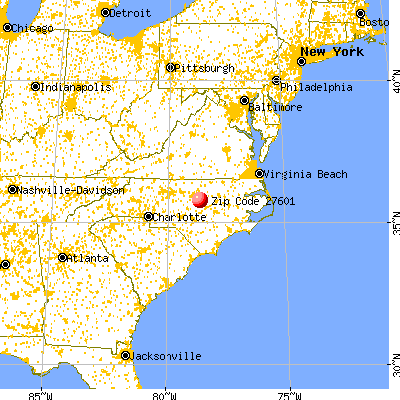
Land area: 1.8 sq. mi. Water area: 0.0 sq. mi.
Population density: 6,150 people per square mile
(high).
OSM Map
General Map
Google Map
MSN Map
OSM Map
General Map
Google Map
MSN Map
OSM Map
General Map
Google Map
MSN Map
OSM Map
General Map
Google Map
MSN Map
Please wait while loading the map...
Real estate property taxes paid for housing units in 2022:
This zip code:
0.6% ($3,694)
North Carolina:
0.6% ($1,769)
Median real estate property taxes paid for housing units with mortgages in 2022: $3,814 (0.6%) Median real estate property taxes paid for housing units with no mortgage in 2022: $2,310 (0.6%)
Averages for the 2020 tax year for zip code 27601, filed in 2021:
Average Adjusted Gross Income (AGI) in 2020: $78,423 (Individual Income Tax Returns)
Here:
$78,423
State:
$70,020
Salary/wage: $68,406 (reported on 90.9% of returns)
Here:
$68,406
State:
$58,387
(% of AGI for various income ranges: 1167.5% for AGIs below $25k, 4011.0% for AGIs $25k-50k, 7150.0% for AGIs $50k-75k, 11177.0% for AGIs $75k-100k, 22349.2% for AGIs $100k-200k, 76245.0% for AGIs over 200k)
Taxable interest for individuals: $1,525 (reported on 26.2% of returns)
This zip code:
$1,525
North Carolina:
$1,479
(% of AGI for various income ranges: 3.9% for AGIs below $25k, 7.4% for AGIs $25k-50k, 26.5% for AGIs $50k-75k, 27.8% for AGIs $75k-100k, 175.4% for AGIs $100k-200k, 737.5% for AGIs over 200k)
Ordinary dividends: $4,941 (reported on 21.9% of returns)
Here:
$4,941
State:
$7,888
(% of AGI for various income ranges: 4.2% for AGIs below $25k, 18.5% for AGIs $25k-50k, 40.6% for AGIs $50k-75k, 95.2% for AGIs $75k-100k, 253.2% for AGIs $100k-200k, 2829.2% for AGIs over 200k)
Net capital gain/loss in AGI: +$18,531 (reported on 20.6% of returns)
Here:
+$18,531
State:
+$23,652
(% of AGI for various income ranges: 7.3% for AGIs below $25k, 21.8% for AGIs $25k-50k, 51.7% for AGIs $50k-75k, 165.9% for AGIs $75k-100k, 484.1% for AGIs $100k-200k, 12370.8% for AGIs over 200k)
Profit/loss from business: +$16,678 (reported on 16.1% of returns)
Here:
+$16,678
State:
+$11,710
(% of AGI for various income ranges: 98.5% for AGIs below $25k, 117.0% for AGIs $25k-50k, 268.1% for AGIs $50k-75k, 248.5% for AGIs $75k-100k, 745.4% for AGIs $100k-200k, 4534.2% for AGIs over 200k)
Taxable individual retirement arrangement distribution: $19,543 (reported on 3.0% of returns)
27601:
$19,543
North Carolina:
$20,247
(% of AGI for various income ranges: 26.1% for AGIs $25k-50k, 76.2% for AGIs $50k-75k, 180.0% for AGIs $100k-200k, 1237.5% for AGIs over 200k)
Self-employed (Keogh) retirement plans: $39,325 (reported on 0.9% of returns)
27601:
$39,325
North Carolina:
$26,749
(% of AGI for various income ranges: 41.0% for AGIs $25k-50k, 1024.2% for AGIs over 200k)
Total itemized deductions: $27,825 (reported on 11.5% of returns)
Here:
$27,825
State:
$34,549
(% of AGI for various income ranges: 84.2% for AGIs $25k-50k, 196.0% for AGIs $50k-75k, 487.0% for AGIs $75k-100k, 1430.3% for AGIs $100k-200k, 5410.0% for AGIs over 200k)
Charity contributions: $7,937 (reported on 8.9% of returns)
Here:
$7,937
State:
$13,360
(% of AGI for various income ranges: 13.8% for AGIs $25k-50k, 36.7% for AGIs $50k-75k, 48.5% for AGIs $75k-100k, 189.2% for AGIs $100k-200k, 1775.8% for AGIs over 200k)
Taxes paid: $8,675 (reported on 11.5% of returns)
27601:
$8,675
State:
$7,586
(% of AGI for various income ranges: 16.9% for AGIs $25k-50k, 50.8% for AGIs $50k-75k, 175.2% for AGIs $75k-100k, 526.5% for AGIs $100k-200k, 1492.5% for AGIs over 200k)
Earned income credit: $2,242 (reported on 19.7% of returns)
Here:
$2,242
State:
$2,337
(% of AGI for various income ranges: 128.9% for AGIs below $25k, 55.7% for AGIs $25k-50k)
Percentage of individuals using paid preparers for their 2020 taxes: 94.8%
Here:
95%
State:
93%
(% for various income ranges: 93.4% for AGIs below $25k, 95.3% for AGIs $25k-50k, 95.2% for AGIs $50k-75k, 97.3% for AGIs $75k-100k, 94.1% for AGIs $100k-200k, 97.2% for AGIs over 200k)
Averages for the 2012 tax year for zip code 27601, filed in 2013:
Average Adjusted Gross Income (AGI) in 2012: $44,999 (Individual Income Tax Returns)
Here:
$44,999
State:
$54,937
Salary/wage: $39,861 (reported on 88.2% of returns)
Here:
$39,861
State:
$46,336
(% of AGI for various income ranges: 81.1% for AGIs below $25k, 88.2% for AGIs $25k-50k, 85.0% for AGIs $50k-75k, 87.2% for AGIs $75k-100k, 81.8% for AGIs $100k-200k, 59.5% for AGIs over 200k)
Taxable interest for individuals: $1,034 (reported on 21.9% of returns)
This zip code:
$1,034
North Carolina:
$1,298
(% of AGI for various income ranges: 0.2% for AGIs below $25k, 0.3% for AGIs $25k-50k, 0.3% for AGIs $50k-75k, 0.2% for AGIs $75k-100k, 0.9% for AGIs $100k-200k, 0.8% for AGIs over 200k)
Ordinary dividends: $8,768 (reported on 12.1% of returns)
Here:
$8,768
State:
$6,213
(% of AGI for various income ranges: 0.4% for AGIs below $25k, 0.8% for AGIs $25k-50k, 0.9% for AGIs $50k-75k, 0.2% for AGIs $75k-100k, 1.8% for AGIs $100k-200k, 6.6% for AGIs over 200k)
Net capital gain/loss in AGI: +$16,279 (reported on 10.1% of returns)
Here:
+$16,279
State:
+$12,740
(% of AGI for various income ranges: 0.2% for AGIs $25k-50k, 1.0% for AGIs $50k-75k, 0.2% for AGIs $75k-100k, 2.1% for AGIs $100k-200k, 12.1% for AGIs over 200k)
Profit/loss from business: +$13,688 (reported on 17.5% of returns)
Here:
+$13,688
State:
+$10,311
(% of AGI for various income ranges: 9.7% for AGIs below $25k, 2.4% for AGIs $25k-50k, 3.6% for AGIs $50k-75k, 5.4% for AGIs $75k-100k, 6.1% for AGIs $100k-200k, 4.7% for AGIs over 200k)
Taxable individual retirement arrangement distribution: $15,056 (reported on 2.7% of returns)
27601:
$15,056
North Carolina:
$15,575
(% of AGI for various income ranges: 1.1% for AGIs $25k-50k, 1.1% for AGIs $50k-75k, 2.7% for AGIs $100k-200k)
Total itemized deductions: $23,200 (20% of AGI, reported on 23.4% of returns)
Here:
$23,200
State:
$23,438
Here:
19.8% of AGI
State:
21.5% of AGI
(% of AGI for various income ranges: 3.7% for AGIs below $25k, 9.2% for AGIs $25k-50k, 10.8% for AGIs $50k-75k, 14.5% for AGIs $75k-100k, 16.3% for AGIs $100k-200k, 15.1% for AGIs over 200k)
Charity contributions: $3,766 (reported on 18.3% of returns)
Here:
$3,766
State:
$4,687
(% of AGI for various income ranges: 0.4% for AGIs below $25k, 1.4% for AGIs $25k-50k, 1.3% for AGIs $50k-75k, 1.8% for AGIs $75k-100k, 1.8% for AGIs $100k-200k, 2.0% for AGIs over 200k)
Taxes paid: $9,533 (reported on 23.1% of returns)
27601:
$9,533
State:
$8,823
(% of AGI for various income ranges: 0.8% for AGIs below $25k, 2.1% for AGIs $25k-50k, 3.5% for AGIs $50k-75k, 5.8% for AGIs $75k-100k, 7.7% for AGIs $100k-200k, 7.2% for AGIs over 200k)
Earned income credit: $2,578 (reported on 36.1% of returns)
Here:
$2,578
State:
$2,376
(% of AGI for various income ranges: 12.2% for AGIs below $25k, 1.2% for AGIs $25k-50k)
Percentage of individuals using paid preparers for their 2012 taxes: 44.7%
Here:
45%
State:
53%
(% for various income ranges: 45.7% for AGIs below $25k, 37.3% for AGIs $25k-50k, 41.4% for AGIs $50k-75k, 41.2% for AGIs $75k-100k, 54.2% for AGIs $100k-200k, 77.8% for AGIs over 200k)
Averages for the 2004 tax year for zip code 27601, filed in 2005:
Average Adjusted Gross Income (AGI) in 2004: $27,614 (Individual Income Tax Returns)
Here:
$27,614
State:
$45,376
Salary/wage: $23,947 (reported on 90.3% of returns)
Here:
$23,947
State:
$39,442
(% of AGI for various income ranges: 96.7% for AGIs below $10k, 90.3% for AGIs $10k-25k, 89.6% for AGIs $25k-50k, 79.4% for AGIs $50k-75k, 81.3% for AGIs $75k-100k, 54.9% for AGIs over 100k)
Taxable interest for individuals: $518 (reported on 18.7% of returns)
This zip code:
$518
North Carolina:
$1,515
(% of AGI for various income ranges: 0.5% for AGIs below $10k, 0.2% for AGIs $10k-25k, 0.2% for AGIs $25k-50k, 0.5% for AGIs $50k-75k, 0.2% for AGIs $75k-100k, 0.5% for AGIs over 100k)
Taxable dividends: $2,057 (reported on 10.2% of returns)
Here:
$2,057
State:
$4,016
(% of AGI for various income ranges: 1.2% for AGIs below $10k, 0.4% for AGIs $10k-25k, 0.8% for AGIs $25k-50k, 0.6% for AGIs $50k-75k, 1.2% for AGIs $75k-100k, 0.9% for AGIs over 100k)
Net capital gain/loss: +$13,211 (reported on 8.1% of returns)
Here:
+$13,211
State:
+$11,152
(% of AGI for various income ranges: 0.5% for AGIs below $10k, 0.4% for AGIs $10k-25k, 0.1% for AGIs $25k-50k, 0.7% for AGIs $50k-75k, 0.8% for AGIs $75k-100k, 12.4% for AGIs over 100k)
Profit/loss from business: +$9,714 (reported on 11.2% of returns)
Here:
+$9,714
State:
+$9,490
(% of AGI for various income ranges: 7.6% for AGIs below $10k, 2.3% for AGIs $10k-25k, 1.0% for AGIs $25k-50k, 7.7% for AGIs $50k-75k, 6.0% for AGIs over 100k)
IRA payment deduction: $1,684 (reported on 0.9% of returns)
27601:
$1,684
North Carolina:
$2,967
Total itemized deductions: $18,029 (24% of AGI, reported on 18.8% of returns)
Here:
$18,029
State:
$19,464
Here:
23.5% of AGI
State:
22.7% of AGI
(% of AGI for various income ranges: 4.2% for AGIs below $10k, 5.4% for AGIs $10k-25k, 11.6% for AGIs $25k-50k, 20.0% for AGIs $50k-75k, 19.5% for AGIs $75k-100k, 15.0% for AGIs over 100k)
Charity contributions deductions: $2,964 (4% of AGI, reported on 16.1% of returns)
Here:
$2,964
State:
$4,035
Here:
3.8% of AGI
State:
4.5% of AGI
(% of AGI for various income ranges: 1.0% for AGIs $10k-25k, 2.0% for AGIs $25k-50k, 2.5% for AGIs $50k-75k, 2.1% for AGIs $75k-100k, 2.0% for AGIs over 100k)
Total tax: $5,516 (reported on 52.0% of returns)
27601:
$5,516
State:
$7,257
(% of AGI for various income ranges: 1.8% for AGIs below $10k, 2.5% for AGIs $10k-25k, 6.7% for AGIs $25k-50k, 11.3% for AGIs $50k-75k, 13.6% for AGIs $75k-100k, 20.3% for AGIs over 100k)
Earned income credit: $1,866 (reported on 41.4% of returns)
Here:
$1,866
State:
$1,851
Percentage of individuals using paid preparers for their 2004 taxes: 62.1%
Here:
62%
State:
62%
(% for various income ranges: 65.6% for AGIs below $10k, 67.5% for AGIs $10k-25k, 49.3% for AGIs $25k-50k, 48.5% for AGIs $50k-75k, 53.8% for AGIs $75k-100k, 71.8% for AGIs over 100k)
Likely homosexual households (counted as self-reported same-sex unmarried-partner households)
Lesbian couples: 0.2% of all households
Gay men: 0.0% of all households
Household received Food Stamps/SNAP in the past 12 months: 932 Household did not receive Food Stamps/SNAP in the past 12 months: 3,749
Women who had a birth in the past 12 months: 119 (69 now married, 49 unmarried) Women who did not have a birth in the past 12 months: 2,889 (733 now married, 2,145 unmarried)
Housing units in zip code 27601 with a mortgage: 960 (102 second mortgage, 4 home equity loan, 74 both second mortgage and home equity loan) Median monthly owner costs for units with a mortgage: $2,213 Median monthly owner costs for units without a mortgage: $466
Residents with income below the poverty level in 2022:
This zip code:
19.5%
Whole state:
12.8%
Residents with income below 50% of the poverty level in 2022:
This zip code:
10.7%
Whole state:
6.8%
Median number of rooms in houses and condos:
Here:
5.8
State:
6.4
Median number of rooms in apartments:
Here:
3.3
State:
4.4
Notable locations in this zip code not listed on our city pages
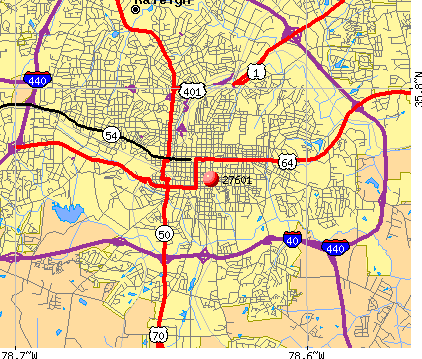
Notable locations in zip code 27601: Raleigh Fire Station Number 3 (A), Raleigh Fire Station Number 1 (B), Electronic Information Center Wake County Government Library (C). Display/hide their locations on the map
Churches in zip code 27601 include: Victory Tabernacle Church (A), United House of Prayer for All People (B), Union Baptist Church (C), Tupper Memorial Baptist Church (D), True Gospel Pentecostal Church (E), Trinity United Faith Center Church (F), Smith Temple Church Annex (G), Smith Temple Church (H), Shalom Christian Community Church (I). Display/hide their locations on the map
Tourist attractions (not listed on the city page) : International Visitors Council (118 South Person Street), Greater Raleigh Convention & Visitors Bureau (421 Fayetteville Street Suite 1505), IMAX Theatre at Exploris (Tours & Charters; 201 East Hargett Street).
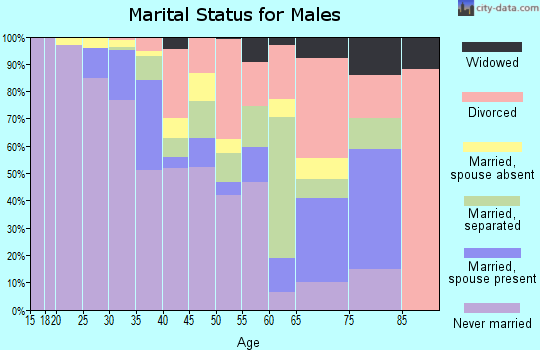
565 married couples with children.
935 single-parent households (63 men, 872 women).
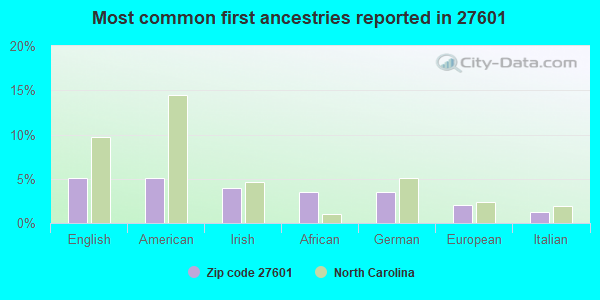
85.8% of residents of 27601 zip code speak English at home.
6.3% of residents speak Spanish at home (59% very well, 17% well, 15% not well, 9% not at all).
4.1% of residents speak other Indo-European language at home (97% very well, 3% well).
1.7% of residents speak Asian or Pacific Island language at home (45% very well, 55% well).
1.8% of residents speak other language at home (100% very well).
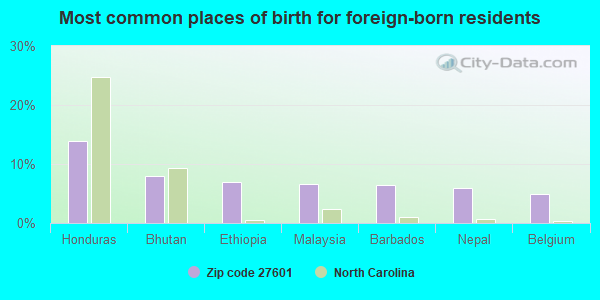
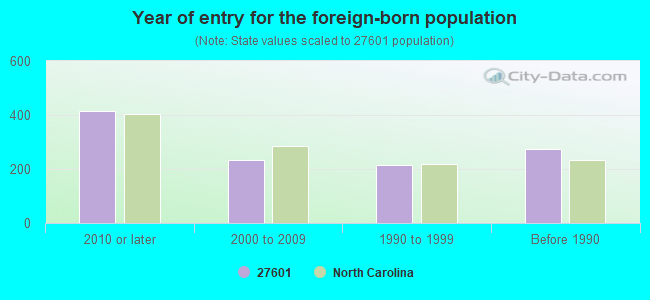
Foreign born population: 965 (8.7%) (59.3% of them are naturalized citizens)
Facilities with environmental interests located in this zip code:
ACME CLEANERS - NEW BERN AVE (331 NEW BERN AVE in RALEIGH, NC)
AIR MINOR (AIRS/AFS) STATE MASTER (North Carolina facility info) - AIR PROGRAM Small Quantity Generators, between 100 kg and 1000 kg of hazardous waste/month (Resource Conservation and Recovery Act (tracking hazardous waste)) - notification Business SIC classification: DRYCLEANING PLANTS, EXCEPT RUG CLEANING Organizations: SMITH-DIXON, INC. (CONTACT/OWNER)
BLOCK A-24 PARKING DECK (NORTH EAST QUAD OF CABARRUS ST. AND BLOUNT ST. in RALEIGH, NC)
AIR MINOR (AIRS/AFS) STATE MASTER (North Carolina facility info) - AIR PROGRAM Business SIC classification: AUTOMOBILE PARKING
ASHLAND CHEMICAL CO**INACTIVE** (1415 BLOODWORTH ST in RALEIGH, NC)
AIR MINOR (AIRS/AFS) HAZARDOUS WASTE BIENNIAL REPORTER (Resource Conservation and Recovery Act (tracking hazardous waste)) Small Quantity Generators, between 100 kg and 1000 kg of hazardous waste/month (Resource Conservation and Recovery Act (tracking hazardous waste)) TSD (Resource Conservation and Recovery Act (tracking hazardous waste)) - notification Business SIC classification: CHEMICALS AND ALLIED PRODUCTS Organizations: ASHLAND DISTRIBUTION CO. (CONTACT/OPERATOR)
, ASHLAND INC (CONTACT/OWNER)
Alternative names: ASHLAND DISTRIBUTION CO
BAKER CHARTER HIGH (330 S SALISBURY STREET in RALEIGH, NC)
(National Center for Education Statistics) - STATE ID-0
Housing units lacking complete plumbing facilities: 1.1% Housing units lacking complete kitchen facilities: 2.0%
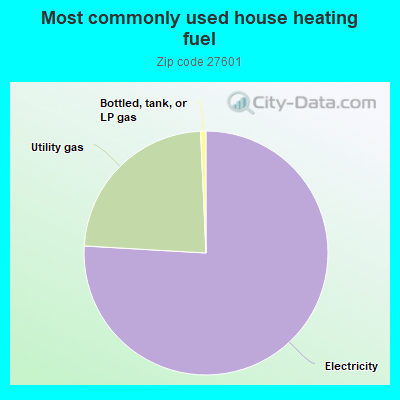
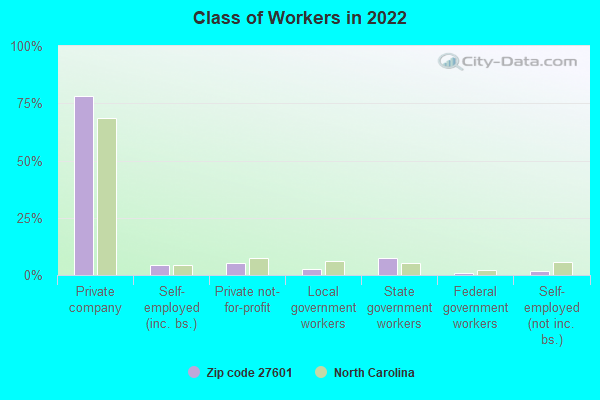
75.4%Electricity
23.2%Utility gas
0.7%Bottled, tank, or LP gas
Population in 1990: 9,810. Population change in the 1990s: +418 (+4.3%).
Place of birth for U.S.-born residents:
This state: 5,799
Northeast: 1,141
Midwest: 924
South: 1,402
West: 642
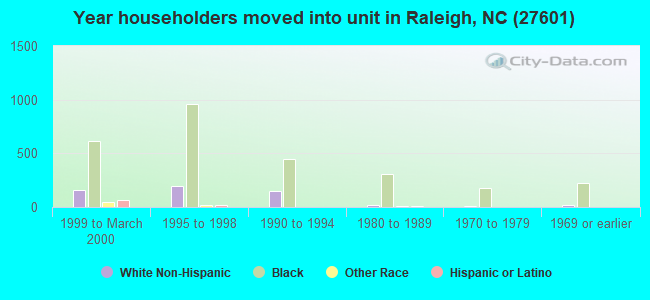
40% of the 27601 zip code residents lived in the same house 5 years ago. Out of people who lived in different houses, 62% lived in this county. Out of people who lived in different counties, 50% lived in North Carolina.
69% of the 27601 zip code residents lived in the same house 1 year ago. Out of people who lived in different houses, 48% moved from this county. Out of people who lived in different houses, 21% moved from different county within same state. Out of people who lived in different houses, 22% moved from different state. Out of people who lived in different houses, 1% moved from abroad.
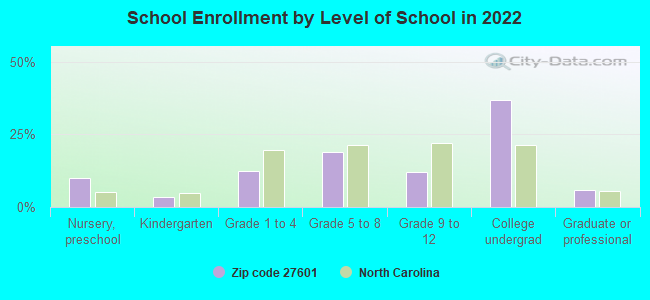
Private vs. public school enrollment:
Students in private schools in grades 1 to 8 (elementary and middle school): 116
Here:
15.4%
North Carolina:
13.8%
Students in private schools in grades 9 to 12 (high school):
Here:
0.0%
North Carolina:
11.9%
Students in private undergraduate colleges: 449
Here:
50.4%
North Carolina:
19.3%
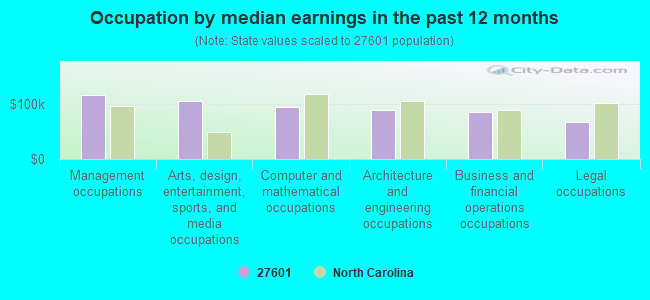
Occupation by median earnings in the past 12 months ($)
116,987Management occupations
107,164Arts, design, entertainment, sports, and media occupations
95,580Computer and mathematical occupations
90,535Architecture and engineering occupations
86,399Business and financial operations occupations
68,025Legal occupations
Companies with biggest federal contracts located in this zip code (RALEIGH, NC):
CAROLINA POWER & LIGHT CO (410 S WILMINGTON STREET) : $145,759,599 in 272 contractsfrom 1999 to 2006
Contracts for Electric Services, Other Utilities, Miscellaneous Items, Maintenance, Repair and Rebuilding of Equipment -- Valves, and moreby Army, Air Force, Public Buildings Service, Maritime Administration, and others Signed by year:2000: $31,422,770; 2001: $25,111,479; 2002: $29,701,715; 2003: $28,393,705; 2004: $3,527,028; 2005: $11,372,576; 2006: $9,348,627.
Biggest contracts:
$3,400,000 with Army for Electric Services. Signed on 2005-10-24. Completion date: 2009-01-01.
$3,035,392 with Air Force for Electric Services. Signed on 2002-05-22. Completion date: 2002-09-30.
$2,911,214 with Army for Electric Services. Signed on 2004-09-01. Completion date: 2004-09-30.
$2,810,694, same as above.Signed on 2000-10-01. Completion date: 2000-10-31.
NORTHCAROLINA NATURAL GAS CORP (411 FAYETTEVILLE STREET MA) : $34,191,998 in 116 contractsfrom 1999 to 2006
Contracts for Gas Services by Army, Air Force, Bureau of Prisoners/Federal Prison System, Department of Veterans Affairs, and others Signed by year:2000: $6,345,873; 2001: $4,503,483; 2002: $5,117,456; 2003: $3,285,381; 2004: $3,785,445; 2005: $6,676,021; 2006: $3,000,000.
Biggest contracts:
$2,700,000 with Army for Gas Services. Signed on 2005-12-15. Completion date: 2009-01-01.
$2,000,000, same as above.Signed on 2005-02-25. Completion date: 2009-01-01.
$1,500,000, same as above.Signed on 2006-03-20. Completion date: 2009-01-01.
$1,500,000, same as above.Signed on 2006-01-11. Completion date: 2009-01-01.
SUMMUS LTD (434 FAYETTEVILLE STREET MA; small business) : $912,626 in 4 contractsfrom 2000 to 2001
$300,000 with Navy for Other Defense -- Basic Research (R&D). Signed on 2000-01-07. Completion date: 2001-12-14.
$299,862, same as above.Signed on 2000-10-04. Completion date: 2002-01-06.
$166,718, same as above.Signed on 2001-03-30. Completion date: 2002-03-29.
$146,046, same as above.Signed on 2001-03-13. Completion date: 2001-09-30.
ENERGY SYSTEMS GROUP SE INC (421 FAYETTEVILLE STREET MA) : $777,613 in 5 contractsfrom 2003 to 2005
Contracts for Electric Services, Maintenance, Repair or Alteration of Real Property -- Other Airfield Structures, Installation of Equipment -- Miscellaneous, Maintenance, Repair and Rebuilding of Equipment -- Electrical and Electronic Equipment Components by Department of Veterans Affairs, Air Force Signed by year:2000: $0; 2001: $0; 2002: $0; 2003: $368,335; 2004: $107,321; 2005: $301,957; 2006: $0.
Biggest contracts:
$368,335 with Department of Veterans Affairs for Electric Services. Signed on 2003-10-01. Completion date: 2004-03-31.
$289,526 with Air Force for Maintenance, Repair or Alteration of Real Property -- Other Airfield Structures. Signed on 2005-09-20. Completion date: 2005-03-03.
$89,861 with Air Force for Installation of Equipment -- Miscellaneous. Signed on 2004-03-26. Completion date: 2004-08-19.
$17,460 with Air Force for Maintenance, Repair and Rebuilding of Equipment -- Electrical and Electronic Equipment Components. Taking place in SC. Signed on 2004-10-26. Completion date: 2005-09-30.
PHOENIX LTD PARTNERSHIP OF RALEIGH (434 FAYETTEVILLE ST. MALL; small business) : $288,088 in 29 contractsfrom 2003 to 2006
Contracts for Lease or Rental of Facilities -- Office Buildings by Public Buildings Service Signed by year:2000: $0; 2001: $0; 2002: $0; 2003: $13,666; 2004: $41,172; 2005: $123,458; 2006: $109,792.
Biggest contracts:
$13,724 with Public Buildings Service for Lease or Rental of Facilities -- Office Buildings. Signed on 2006-07-01. Completion date: 2006-09-30.
$13,724, same as above.Signed on 2006-04-01. Completion date: 2006-09-30.
$13,724, same as above.Signed on 2006-04-01. Completion date: 2006-09-30.
$13,724, same as above.Signed on 2006-07-01. Completion date: 2006-09-30.
OWENS ROOFING, INC (301 W CABARRUS STREET; small business) : $176,103 in 4 contractsfrom 1999 to 2001
$253,170 with Navy for Maintenance, Repair or Alteration of Real Property -- Other Warehouse Buildings. Signed on 2000-10-10. Completion date: 2001-04-22.
$3,401, same as above.Signed on 2001-06-18. Completion date: 2001-06-13.
$1,047, same as above.Signed on 2001-02-13. Completion date: 2001-06-01.
-$81,515 with Navy for Maintenance, Repair or Alteration of Real Property -- Other Industrial Buildings. Signed on 1999-11-08. Completion date: 1999-08-21.
CLP SERVICES, P C (900 S WILMINGTON ST; small business) : $121,224 in 10 contractsfrom 2003 to 2005
Contracts for Other Professional Services by Army Signed by year:2000: $0; 2001: $0; 2002: $0; 2003: $19,000; 2004: $91,144; 2005: $11,080; 2006: $0.
Biggest contracts:
$24,812 with Army for Other Professional Services. Signed on 2004-09-21. Completion date: 2004-12-31.
$24,165, same as above.Signed on 2005-09-22. Completion date: 2005-12-30.
$21,314 with Army for Other Professional Services. Taking place in MD. Signed on 2004-01-13. Completion date: 2004-09-30.
$19,178 with Army for Other Professional Services. Signed on 2004-03-30. Completion date: 2004-09-30.
SUMMUS INC (434 FAYETTEVILLE ST STE; small business)
$69,916 with Navy for Programming Services. Signed on 2003-07-11. Completion date: 2004-01-12.
LAYTON'S CATERING (223 W MARTIN ST; small business)
$26,586 with Army for Condiments and Related Products. Signed on 2004-05-12. Completion date: 2004-05-15.
TRANSPORTATION, NORTH CAROLINA (1 S WILIMINGTON ST 5TH FLR) : $8,856 in 5 contractsin 2004
Contracts for Site Preparation, Other Non-Building Structures by Army, U.S. Army Corps of Engineers - civil program financing only, National Oceanic and Atmospheric Administration/Under Secretary for Oceans and Atmosphere Signed by year:2000: $0; 2001: $0; 2002: $0; 2003: $0; 2004: $8,856; 2005: $0; 2006: $0.
Biggest contracts:
$12,000 with Army for Site Preparation. Signed on 2004-03-17. Completion date: 2004-05-31.
$12,000 with U.S. Army Corps of Engineers - civil program financing only for Site Preparation. Signed on 2004-03-17. Completion date: 2004-05-31.
$1,700 with National Oceanic and Atmospheric Administration/Under Secretary for Oceans and Atmosphere for Other Non-Building Structures. Signed on 2004-07-07. Completion date: 2004-07-09.
-$8,422 with Army for Site Preparation. Signed on 2004-06-30. Completion date: 2004-05-31.
Top industries in this zip code by the number of employees in 2005:
2005 - 2018 National Fire Incident Reporting System (NFIRS) incidents
According to the data from the years 2005 - 2018 the average number of fires per year is 573. The highest number of reported fire incidents - 862 took place in 2011, and the least - 0 in 2007. The data has an increasing trend.
When looking into fire subcategories, the most reports belonged to: Structure Fires (38.2%), and Outside Fires (35.3%).
Fire incident types reported to NFIRS in Zip Code 27601


 Nearest zip codes: 27605, 27608, 27609, 27606, 27604, 27610.


 According to the data from the years 2005 - 2018 the average number of fires per year is 573. The highest number of reported fire incidents - 862 took place in 2011, and the least - 0 in 2007. The data has an increasing trend.
 When looking into fire subcategories, the most reports belonged to: Structure Fires (38.2%), and Outside Fires (35.3%).