Estimated zip code population in 2022: 18,741 Zip code population in 2010: 21,591 Zip code population in 2000: 19,913
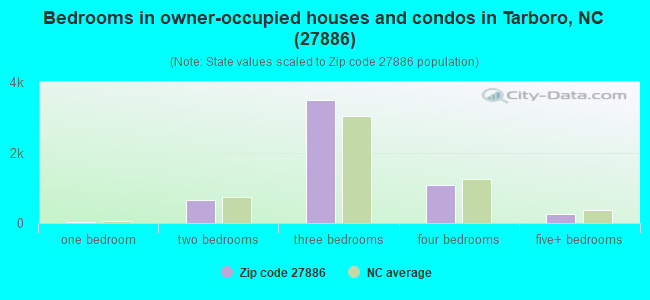
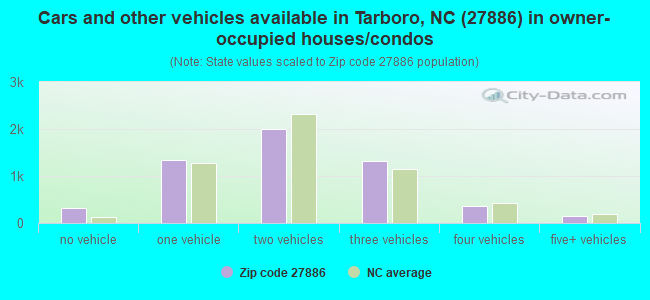
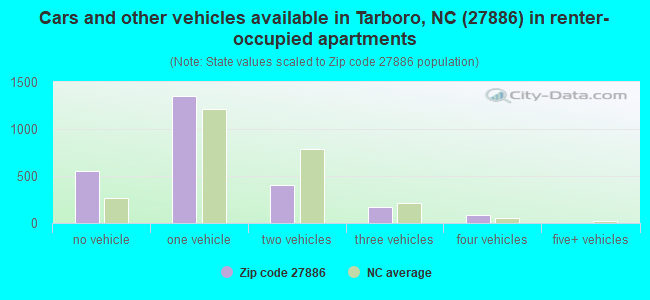
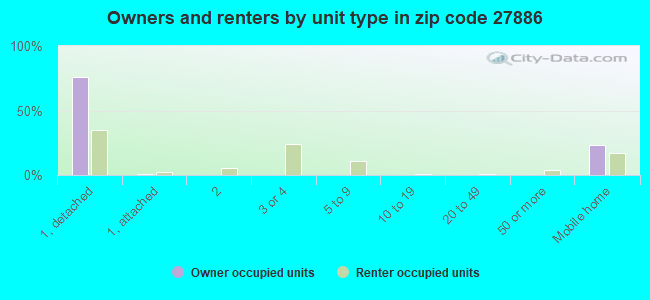
Houses and condos: 9,129 Renter-occupied apartments: 2,592
% of renters here:
32%
State:
33%
March 2022 cost of living index in zip code 27886: 84.5 (less than average, U.S. average is 100)
Land area: 192.9 sq. mi. Water area: 0.9 sq. mi.
Population density: 97 people per square mile
(very low).
OSM Map
General Map
Google Map
MSN Map
OSM Map
General Map
Google Map
MSN Map
OSM Map
General Map
Google Map
MSN Map
OSM Map
General Map
Google Map
MSN Map
Please wait while loading the map...
Real estate property taxes paid for housing units in 2022:
This zip code:
1.0% ($1,349)
North Carolina:
0.6% ($1,769)
Median real estate property taxes paid for housing units with mortgages in 2022: $1,384 (0.9%) Median real estate property taxes paid for housing units with no mortgage in 2022: $1,306 (1.0%)
Averages for the 2020 tax year for zip code 27886, filed in 2021:
Average Adjusted Gross Income (AGI) in 2020: $44,138 (Individual Income Tax Returns)
Here:
$44,138
State:
$70,020
Salary/wage: $37,013 (reported on 83.1% of returns)
Here:
$37,013
State:
$58,387
(% of AGI for various income ranges: 1273.3% for AGIs below $25k, 3972.5% for AGIs $25k-50k, 7192.2% for AGIs $50k-75k, 10741.0% for AGIs $75k-100k, 17860.0% for AGIs $100k-200k, 141525.0% for AGIs over 200k)
Taxable interest for individuals: $1,093 (reported on 22.3% of returns)
This zip code:
$1,093
North Carolina:
$1,479
(% of AGI for various income ranges: 6.2% for AGIs below $25k, 10.5% for AGIs $25k-50k, 29.4% for AGIs $50k-75k, 70.7% for AGIs $75k-100k, 192.8% for AGIs $100k-200k, 4175.0% for AGIs over 200k)
Ordinary dividends: $8,222 (reported on 10.2% of returns)
Here:
$8,222
State:
$7,888
(% of AGI for various income ranges: 10.7% for AGIs below $25k, 18.6% for AGIs $25k-50k, 73.3% for AGIs $50k-75k, 213.1% for AGIs $75k-100k, 911.2% for AGIs $100k-200k, 15640.0% for AGIs over 200k)
Net capital gain/loss in AGI: +$10,689 (reported on 8.9% of returns)
Here:
+$10,689
State:
+$23,652
(% of AGI for various income ranges: 5.0% for AGIs below $25k, 21.4% for AGIs $25k-50k, 90.0% for AGIs $50k-75k, 233.8% for AGIs $75k-100k, 778.0% for AGIs $100k-200k, 21825.0% for AGIs over 200k)
Profit/loss from business: +$5,826 (reported on 13.2% of returns)
Here:
+$5,826
State:
+$11,710
(% of AGI for various income ranges: 55.8% for AGIs below $25k, 40.4% for AGIs $25k-50k, 53.9% for AGIs $50k-75k, 272.4% for AGIs $75k-100k, 501.2% for AGIs $100k-200k, 9300.0% for AGIs over 200k)
Taxable individual retirement arrangement distribution: $15,054 (reported on 7.4% of returns)
27886:
$15,054
North Carolina:
$20,247
(% of AGI for various income ranges: 36.4% for AGIs below $25k, 70.6% for AGIs $25k-50k, 248.0% for AGIs $50k-75k, 642.4% for AGIs $75k-100k, 1226.8% for AGIs $100k-200k, 2855.0% for AGIs over 200k)
Total itemized deductions: $31,929 (reported on 4.0% of returns)
Here:
$31,929
State:
$34,549
(% of AGI for various income ranges: 25.8% for AGIs below $25k, 78.6% for AGIs $25k-50k, 310.6% for AGIs $50k-75k, 662.1% for AGIs $75k-100k, 962.8% for AGIs $100k-200k, 11405.0% for AGIs over 200k)
Charity contributions: $10,987 (reported on 3.5% of returns)
Here:
$10,987
State:
$13,360
(% of AGI for various income ranges: 2.8% for AGIs below $25k, 13.8% for AGIs $25k-50k, 94.8% for AGIs $50k-75k, 167.6% for AGIs $75k-100k, 322.8% for AGIs $100k-200k, 5240.0% for AGIs over 200k)
Taxes paid: $5,680 (reported on 4.1% of returns)
27886:
$5,680
State:
$7,586
(% of AGI for various income ranges: 2.5% for AGIs below $25k, 10.8% for AGIs $25k-50k, 51.1% for AGIs $50k-75k, 116.9% for AGIs $75k-100k, 219.6% for AGIs $100k-200k, 2455.0% for AGIs over 200k)
Earned income credit: $2,608 (reported on 29.9% of returns)
Here:
$2,608
State:
$2,337
(% of AGI for various income ranges: 165.8% for AGIs below $25k, 106.6% for AGIs $25k-50k)
Percentage of individuals using paid preparers for their 2020 taxes: 89.4%
Here:
89%
State:
93%
(% for various income ranges: 89.1% for AGIs below $25k, 90.2% for AGIs $25k-50k, 89.1% for AGIs $50k-75k, 87.0% for AGIs $75k-100k, 89.1% for AGIs $100k-200k, 92.3% for AGIs over 200k)
Averages for the 2012 tax year for zip code 27886, filed in 2013:
Average Adjusted Gross Income (AGI) in 2012: $36,926 (Individual Income Tax Returns)
Here:
$36,926
State:
$54,937
Salary/wage: $31,422 (reported on 85.9% of returns)
Here:
$31,422
State:
$46,336
(% of AGI for various income ranges: 81.6% for AGIs below $25k, 83.3% for AGIs $25k-50k, 71.2% for AGIs $50k-75k, 69.1% for AGIs $75k-100k, 66.4% for AGIs $100k-200k, 50.6% for AGIs over 200k)
Taxable interest for individuals: $1,137 (reported on 23.6% of returns)
This zip code:
$1,137
North Carolina:
$1,298
(% of AGI for various income ranges: 0.6% for AGIs below $25k, 0.5% for AGIs $25k-50k, 0.9% for AGIs $50k-75k, 0.6% for AGIs $75k-100k, 0.6% for AGIs $100k-200k, 1.6% for AGIs over 200k)
Ordinary dividends: $7,561 (reported on 12.3% of returns)
Here:
$7,561
State:
$6,213
(% of AGI for various income ranges: 0.8% for AGIs below $25k, 0.7% for AGIs $25k-50k, 1.7% for AGIs $50k-75k, 2.0% for AGIs $75k-100k, 2.7% for AGIs $100k-200k, 12.1% for AGIs over 200k)
Net capital gain/loss in AGI: +$5,832 (reported on 9.1% of returns)
Here:
+$5,832
State:
+$12,740
(% of AGI for various income ranges: 0.2% for AGIs $25k-50k, 0.3% for AGIs $50k-75k, 0.4% for AGIs $75k-100k, 2.0% for AGIs $100k-200k, 9.3% for AGIs over 200k)
Profit/loss from business: +$6,646 (reported on 10.8% of returns)
Here:
+$6,646
State:
+$10,311
(% of AGI for various income ranges: 3.9% for AGIs below $25k, 0.8% for AGIs $25k-50k, 1.6% for AGIs $50k-75k, 1.6% for AGIs $75k-100k, 3.1% for AGIs $100k-200k)
Taxable individual retirement arrangement distribution: $11,806 (reported on 7.7% of returns)
27886:
$11,806
North Carolina:
$15,575
(% of AGI for various income ranges: 1.9% for AGIs below $25k, 1.7% for AGIs $25k-50k, 2.5% for AGIs $50k-75k, 3.1% for AGIs $75k-100k, 3.6% for AGIs $100k-200k, 2.8% for AGIs over 200k)
Total itemized deductions: $19,601 (25% of AGI, reported on 21.4% of returns)
Here:
$19,601
State:
$23,438
Here:
24.7% of AGI
State:
21.5% of AGI
(% of AGI for various income ranges: 5.8% for AGIs below $25k, 9.3% for AGIs $25k-50k, 14.2% for AGIs $50k-75k, 13.5% for AGIs $75k-100k, 15.5% for AGIs $100k-200k, 12.8% for AGIs over 200k)
Charity contributions: $4,928 (reported on 18.2% of returns)
Here:
$4,928
State:
$4,687
(% of AGI for various income ranges: 0.8% for AGIs below $25k, 1.7% for AGIs $25k-50k, 3.1% for AGIs $50k-75k, 3.2% for AGIs $75k-100k, 3.6% for AGIs $100k-200k, 3.0% for AGIs over 200k)
Taxes paid: $6,799 (reported on 21.3% of returns)
27886:
$6,799
State:
$8,823
(% of AGI for various income ranges: 0.9% for AGIs below $25k, 2.0% for AGIs $25k-50k, 3.8% for AGIs $50k-75k, 4.3% for AGIs $75k-100k, 6.3% for AGIs $100k-200k, 10.4% for AGIs over 200k)
Earned income credit: $2,716 (reported on 35.6% of returns)
Here:
$2,716
State:
$2,376
(% of AGI for various income ranges: 11.5% for AGIs below $25k, 1.7% for AGIs $25k-50k)
Percentage of individuals using paid preparers for their 2012 taxes: 56.0%
Here:
56%
State:
53%
(% for various income ranges: 56.9% for AGIs below $25k, 49.8% for AGIs $25k-50k, 58.1% for AGIs $50k-75k, 60.4% for AGIs $75k-100k, 67.4% for AGIs $100k-200k, 77.8% for AGIs over 200k)
Averages for the 2004 tax year for zip code 27886, filed in 2005:
Average Adjusted Gross Income (AGI) in 2004: $35,375 (Individual Income Tax Returns)
Here:
$35,375
State:
$45,376
Salary/wage: $29,417 (reported on 88.3% of returns)
Here:
$29,417
State:
$39,442
(% of AGI for various income ranges: 133.8% for AGIs below $10k, 87.1% for AGIs $10k-25k, 84.7% for AGIs $25k-50k, 79.3% for AGIs $50k-75k, 73.5% for AGIs $75k-100k, 46.4% for AGIs over 100k)
Taxable interest for individuals: $1,387 (reported on 30.4% of returns)
This zip code:
$1,387
North Carolina:
$1,515
(% of AGI for various income ranges: 3.5% for AGIs below $10k, 0.9% for AGIs $10k-25k, 0.8% for AGIs $25k-50k, 0.9% for AGIs $50k-75k, 0.9% for AGIs $75k-100k, 1.9% for AGIs over 100k)
Taxable dividends: $6,503 (reported on 14.8% of returns)
Here:
$6,503
State:
$4,016
(% of AGI for various income ranges: 3.9% for AGIs below $10k, 0.7% for AGIs $10k-25k, 0.9% for AGIs $25k-50k, 1.7% for AGIs $50k-75k, 2.6% for AGIs $75k-100k, 6.2% for AGIs over 100k)
Net capital gain/loss: +$6,977 (reported on 11.3% of returns)
Here:
+$6,977
State:
+$11,152
(% of AGI for various income ranges: 2.2% for AGIs below $10k, 0.0% for AGIs $10k-25k, 0.2% for AGIs $25k-50k, 0.5% for AGIs $50k-75k, 0.9% for AGIs $75k-100k, 7.1% for AGIs over 100k)
Profit/loss from business: +$6,933 (reported on 10.3% of returns)
Here:
+$6,933
State:
+$9,490
(% of AGI for various income ranges: 4.7% for AGIs below $10k, 1.7% for AGIs $10k-25k, 1.0% for AGIs $25k-50k, 1.3% for AGIs $50k-75k, 1.6% for AGIs $75k-100k, 3.6% for AGIs over 100k)
Profit/loss from farming: +$4,659 (reported on 0.5% of returns)
Here:
+$4,659
State:
-$3,231
IRA payment deduction: $2,784 (reported on 1.0% of returns)
27886:
$2,784
North Carolina:
$2,967
(% of AGI for various income ranges: 0.0% for AGIs $10k-25k, 0.1% for AGIs $25k-50k, 0.1% for AGIs $50k-75k, 0.2% for AGIs $75k-100k)
Self-employed pension: $6,294 (reported on 0.2% of returns)
Here:
$6,294
North Carolina:
$14,754
Total itemized deductions: $16,808 (22% of AGI, reported on 24.6% of returns)
Here:
$16,808
State:
$19,464
Here:
21.6% of AGI
State:
22.7% of AGI
(% of AGI for various income ranges: 11.9% for AGIs below $10k, 6.3% for AGIs $10k-25k, 11.0% for AGIs $25k-50k, 14.1% for AGIs $50k-75k, 15.3% for AGIs $75k-100k, 12.8% for AGIs over 100k)
Charity contributions deductions: $4,260 (5% of AGI, reported on 21.9% of returns)
Here:
$4,260
State:
$4,035
Here:
5.2% of AGI
State:
4.5% of AGI
(% of AGI for various income ranges: 1.1% for AGIs below $10k, 1.0% for AGIs $10k-25k, 2.5% for AGIs $25k-50k, 3.5% for AGIs $50k-75k, 3.7% for AGIs $75k-100k, 2.9% for AGIs over 100k)
Total tax: $5,970 (reported on 60.0% of returns)
27886:
$5,970
State:
$7,257
(% of AGI for various income ranges: 3.1% for AGIs below $10k, 2.3% for AGIs $10k-25k, 5.7% for AGIs $25k-50k, 8.5% for AGIs $50k-75k, 10.5% for AGIs $75k-100k, 20.5% for AGIs over 100k)
Earned income credit: $2,089 (reported on 34.1% of returns)
Here:
$2,089
State:
$1,851
Percentage of individuals using paid preparers for their 2004 taxes: 64.8%
Here:
65%
State:
62%
(% for various income ranges: 60.1% for AGIs below $10k, 69.1% for AGIs $10k-25k, 61.9% for AGIs $25k-50k, 61.6% for AGIs $50k-75k, 63.2% for AGIs $75k-100k, 73.3% for AGIs over 100k)
Likely homosexual households (counted as self-reported same-sex unmarried-partner households)
Lesbian couples: 0.6% of all households
Gay men: 0.0% of all households
Household received Food Stamps/SNAP in the past 12 months: 1,883 Household did not receive Food Stamps/SNAP in the past 12 months: 6,304
Women who had a birth in the past 12 months: 295 (27 now married, 254 unmarried) Women who did not have a birth in the past 12 months: 3,550 (1,228 now married, 2,315 unmarried)
Housing units in zip code 27886 with a mortgage: 2,892 (374 second mortgage, 253 both second mortgage and home equity loan) Houses without a mortgage: 33
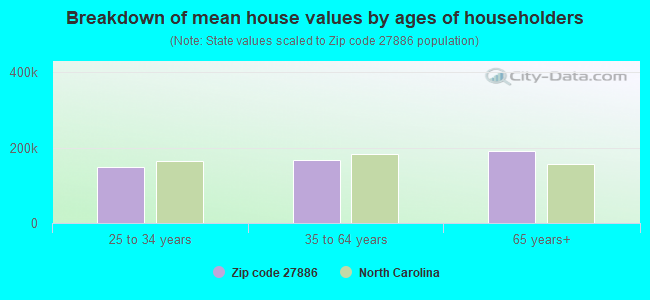
Median monthly owner costs for units with a mortgage: $1,221 Median monthly owner costs for units without a mortgage: $470
Residents with income below the poverty level in 2022:
This zip code:
20.9%
Whole state:
12.8%
Residents with income below 50% of the poverty level in 2022:
This zip code:
9.7%
Whole state:
6.8%
Median number of rooms in houses and condos:
Here:
6.1
State:
6.4
Median number of rooms in apartments:
Here:
4.2
State:
4.4
Notable locations in this zip code not listed on our city pages
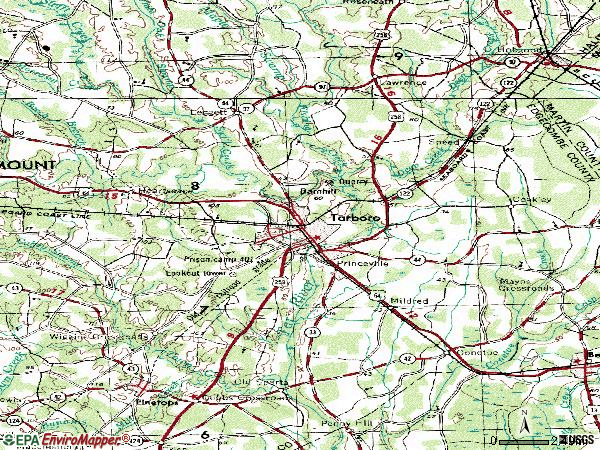
Notable locations in zip code 27886: Parker Landing (A), Dogtown (B), Suggs Landing (C), Edgecombe County Courthouse (D), Tarboro Town Hall (E), Princeville Town Hall (F), Alcohol Law Enforcement (G), Princeville Police Department (H), Tarboro Police Department (I), Edgecombe Criminal Division (J), Edgecombe County Sheriff's Office (K). Display/hide their locations on the map
Churches in zip code 27886 include: Bethlehem Church (A), Meetinghouse Church (B), Maple Springs Church (C), Grace Church (D), Old Salem Church (E), Calvary Church (F), Penders Chapel (G), Saint James Church (H), Batts Chapel (I). Display/hide their locations on the map
Cemeteries: Dancy Memorial Cemetery (1), Community Cemetery (2), County Home Cemetery (3), Hyde Cemetery (4), Manning Cemetery (5), Harrison Cemetery (6), Edgecombe Memorial Park (7). Display/hide their locations on the map
Streams, rivers, and creeks: Deep Creek (A), Crisp Creek (B), Savage Mill Run (C), Longs Branch (D), Raccoon Branch (E), Penders Mill Run (F), Town Creek (G), Cheeks Mill Creek (H), Fishing Creek (I). Display/hide their locations on the map
1,587 married couples with children.
1,822 single-parent households (342 men, 1,480 women).
88.6% of residents of 27886 zip code speak English at home.
10.7% of residents speak Spanish at home (59% very well, 24% well, 5% not well, 11% not at all).
0.6% of residents speak other Indo-European language at home (89% very well, 5% well, 5% not well).
0.3% of residents speak Asian or Pacific Island language at home (100% very well).
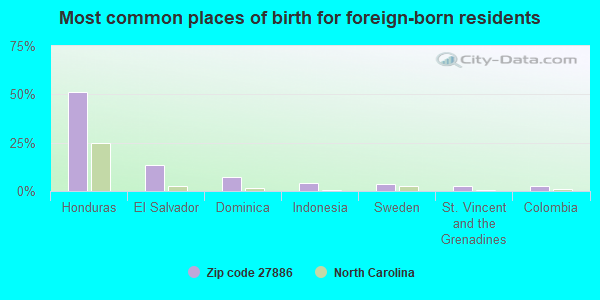
Foreign born population: 1,148 (6.1%) (27.2% of them are naturalized citizens)
This zip code:
6.1%
Whole state:
8.6%
51%Honduras
14%El Salvador
7%Dominica
4%Indonesia
4%Sweden
3%St. Vincent and the Grenadines
2%Colombia
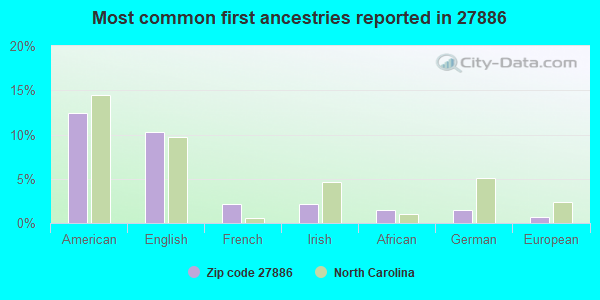
12%American
10%English
2%French
2%Irish
1%African
1%German
1%European
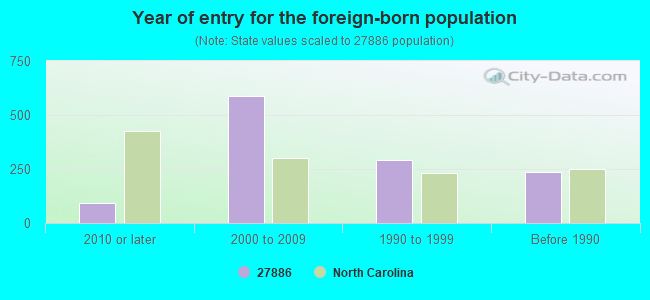
Year of entry for the foreign-born population
932010 or later
5872000 to 2009
2931990 to 1999
237Before 1990
Major facilities with environmental interests located in this zip code:
ANSELL EDMONT INDUSTRIAL INCORPORATED (2906 ANCONDA ROAD in TARBORO, NC)
STATE MASTER (North Carolina facility info) - UNDERGROUND STORAGE TANK PROGRAM STATE MASTER (North Carolina facility info) - -115DA4YG00M29W84AX3YR3RSXU, WASTEWATER FACILITY National Pollutant Discharge Elimination System NON-MAJOR (Tracking pollutant discharge elimination systems) - permit Conditionally Exempt Small Quantity Generators, less than 100 kg/month of hazardous waste (Resource Conservation and Recovery Act (tracking hazardous waste)) - notification TRI REPORTER (Tracking of toxic chemicals releasing facilities) Business SIC classification: FABRICATED RUBBER PRODUCTS; NONCLASSIFIABLE ESTABLISHMENTS Organizations: ANSELL-EDMONT INDUSTRIAL INC. (CONTACT/OWNER)
Alternative names: Ansell Edmont Division, ANSELL PRODUCTIVE PRODS., ANSELL PROTECTIVE PRODS.
AIR SYSTEMS COMPONENTS (3301 MAIN STREET in TARBORO, NC)
AIR MINOR (AIRS/AFS) STATE MASTER (North Carolina facility info) - UNDERGROUND STORAGE TANK PROGRAM CRITERIA AND HAZARDOUS AIR POLLUTANT INVENTORY (Inventory of air pollution sources) National Pollutant Discharge Elimination System NON-MAJOR (Tracking pollutant discharge elimination systems) - permit Conditionally Exempt Small Quantity Generators, less than 100 kg/month of hazardous waste (Resource Conservation and Recovery Act (tracking hazardous waste)) - notification TRI REPORTER (Tracking of toxic chemicals releasing facilities) Business SIC classification: HEATING EQUIPMENT, EXCEPT ELECTRIC AND WARM AIR FURNACES; SHEET METALWORK; NONCLASSIFIABLE ESTABLISHMENTS Business NAICS classification: HEATING EQUIPMENT (EXCEPT WARM AIR FURNACES) MANUFACTURING. Alternative names: ASC INC (BLACK & DECKER), BLACK AND DECKER (US) INCORPORATED
BARNHILL CONTRACTING CO (2311 N MAIN ST in TARBORO, NC)
STATE MASTER (North Carolina facility info) - UNDERGROUND STORAGE TANK PROGRAM National Pollutant Discharge Elimination System NON-MAJOR (Tracking pollutant discharge elimination systems) - permit National Pollutant Discharge Elimination System NON-MAJOR (Tracking pollutant discharge elimination systems) - permit Small Quantity Generators, between 100 kg and 1000 kg of hazardous waste/month (Resource Conservation and Recovery Act (tracking hazardous waste)) - notification Business SIC classification: CLAY, CERAMIC, AND REFRACTORY MINERALS; NONCLASSIFIABLE ESTABLISHMENTS Organizations: BARNHILL CONTRACTING CO. (CONTACT/OWNER)
Alternative names: BARNHILL CONTRACTING CO JENKIN, BARNHILL CONTRACTING CO WINSLO, JENKINS PIT, WINSLOW PIT
CAROLINA ENTERPRISES PLANT 2 (710 POPLAR STREET in TARBORO, NC)
AIR MINOR (AIRS/AFS) STATE MASTER (North Carolina facility info) - AIR PROGRAM (Resource Conservation and Recovery Act (tracking hazardous waste)) TRI REPORTER (Tracking of toxic chemicals releasing facilities) Business SIC classification: FASTENERS, BUTTONS, NEEDLES, AND PINS Business NAICS classification: FASTENER, BUTTON, NEEDLE, AND PIN MANUFACTURING. Organizations: CAROLINA ENTERPRISES INC (CONTACT/OWNER)
Alternative names: CAROLINA ENTERPRISES CALDWELL, EMPIRE IND. INC. BUTTON DIV.
ANDERSON SAND PIT (401 TRADE STREET in TARBORO, NC)
STATE MASTER (North Carolina facility info) - UNDERGROUND STORAGE TANK PROGRAM, -115DA4YG00M29W84AX3YRCSBXB, WASTEWATER FACILITY National Pollutant Discharge Elimination System NON-MAJOR (Tracking pollutant discharge elimination systems) - permit Business SIC classification: CONSTRUCTION SAND AND GRAVEL; NONCLASSIFIABLE ESTABLISHMENTS Alternative names: ANDERSON AND CO SAND PIT
BARRUS CONSTRUCTION COMPANY (TARBORO II (740 KINGSBORO ROAD in TARBORO, NC)
AIR MINOR (AIRS/AFS) STATE MASTER (North Carolina facility info) - AIR PROGRAM Business SIC classification: READY-MIXED CONCRETE Alternative names: BARRUS CONSTRUCTION COMPANY (TARBORO II PLANT)
DRY CLEANING BY WAYNE (107 NORTH CHURCH STREET in TARBORO, NC)
AIR MINOR (AIRS/AFS) STATE MASTER (North Carolina facility info) - AIR PROGRAM Business SIC classification: DRYCLEANING PLANTS, EXCEPT RUG CLEANING
DIXIE YARN > TI CARO INCORPORATED (101 FAIRLY STREET in TARBORO, NC)
STATE MASTER (North Carolina facility info) - AIR PROGRAM, -66AN2CF000NPSWA489NT031860, WASTEWATER FACILITY Conditionally Exempt Small Quantity Generators, less than 100 kg/month of hazardous waste (Resource Conservation and Recovery Act (tracking hazardous waste)) - notification Business SIC classification: YARN SPINNING MILLS; NONCLASSIFIABLE ESTABLISHMENTS Business NAICS classification: YARN SPINNING MILLS. Organizations: DIXIE YARNS INC (CONTACT/OWNER)
Alternative names: DIXIE YARNS INC, TI-CARO, INCORPORATED
C B MARTIN MIDDLE (400 E JOHNSTON ST in TARBORO, NC)
(National Center for Education Statistics) - STATE ID-324 Organizations: EDGECOMBE COUNTY SCHOOLS (SCHOOL DISTRICT)
CENTER FOR ED ACHIEVEMENT (400 EAST WALNUT STREET in TARBORO, NC)
(National Center for Education Statistics) - STATE ID-310 Organizations: EDGECOMBE COUNTY SCHOOLS (SCHOOL DISTRICT)
DPD TEAM CONCRETE - TARBORO (1600 ANACONDA RD in TARBORO, NC)
AIR MINOR (AIRS/AFS) CRITERIA AND HAZARDOUS AIR POLLUTANT INVENTORY (Inventory of air pollution sources) National Pollutant Discharge Elimination System NON-MAJOR (Tracking pollutant discharge elimination systems) - permit Business SIC classification: CONCRETE WORK; READY-MIXED CONCRETE; ASBESTOS PRODUCTS Alternative names: CONCRETE SERV OF ROCKY MOUNT, CONCRETE SERVICES OF ROCKY MOUNT INCORPORATED, GREENVILLE READY MIXED CNCRTE
ANDERSON TALBERT PEA (ROUTE 2 in TARBORO, NC)
AIR MINOR (AIRS/AFS) Business SIC classification: NONCLASSIFIABLE ESTABLISHMENTS
CAROLINA TELEPHONE & TELEGRAPH CO (107 CHESTERFIELD ST in TARBORO, NC)
Housing units lacking complete plumbing facilities: 3.9% Housing units lacking complete kitchen facilities: 3.8%
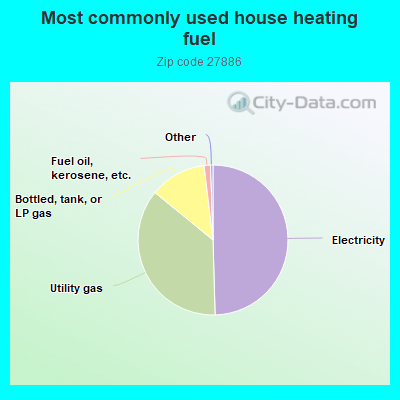
49.6%Electricity
36.4%Utility gas
12.2%Bottled, tank, or LP gas
1.4%Fuel oil, kerosene, etc.
Population in 1990: 16,144. Population change in the 1990s: +3,769 (+23.3%).
Place of birth for U.S.-born residents:
This state: 14,306
Northeast: 949
Midwest: 276
South: 1,288
West: 422
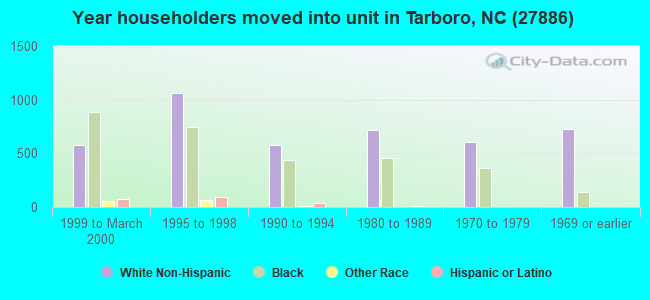
60% of the 27886 zip code residents lived in the same house 5 years ago. Out of people who lived in different houses, 68% lived in this county. Out of people who lived in different counties, 50% lived in North Carolina.
96% of the 27886 zip code residents lived in the same house 1 year ago. Out of people who lived in different houses, 55% moved from this county. Out of people who lived in different houses, 41% moved from different county within same state. Out of people who lived in different houses, 13% moved from different state. Out of people who lived in different houses, 4% moved from abroad.
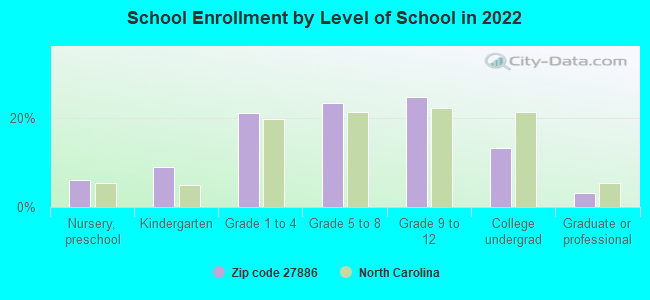
Private vs. public school enrollment:
Students in private schools in grades 1 to 8 (elementary and middle school): 199
Here:
11.4%
North Carolina:
13.8%
Students in private schools in grades 9 to 12 (high school): 54
Here:
5.7%
North Carolina:
11.9%
Students in private undergraduate colleges: 99
Here:
19.0%
North Carolina:
19.3%
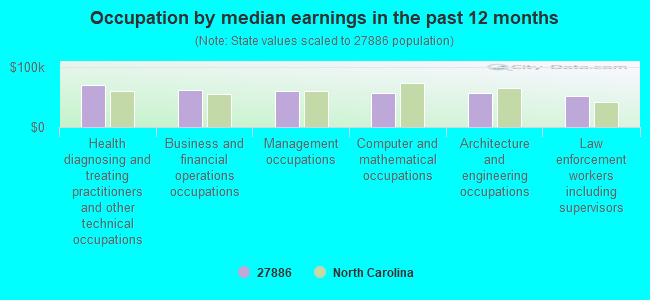
Occupation by median earnings in the past 12 months ($)
69,405Health diagnosing and treating practitioners and other technical occupations
61,232Business and financial operations occupations
58,994Management occupations
56,101Computer and mathematical occupations
55,625Architecture and engineering occupations
52,044Law enforcement workers including supervisors
Companies with federal contracts located in this zip code:
SANDYLAND PRODUCE, LLC (5006 NC HWY, 33 E in TARBORO, NC; small business) : $20,155 in 3 contractsfrom 2004 to 2005
$6,885 with Defense Logistics Agency for Fruits and Vegetables. Signed on 2004-12-16. Completion date: 2004-12-16.
$6,750, same as above.Signed on 2004-12-21. Completion date: 2004-12-21.
$6,520, same as above.Signed on 2005-01-05. Completion date: 2005-01-05.
HOLDEN TEMPORARIES INC (201 EAST PITT STREET, SUIT in TARBORO, NC; small business) : $3,465 in 2 contractsin 2004
$10,396 with Air Force for Radiology Services. Signed on 2004-03-26. Completion date: 2004-09-30.
-$6,931, same as above.Signed on 2004-05-26. Completion date: 2004-09-30.
INNOVATIVE DESIGN & TOOLING IN (2225 NORTH MAIN STREET in TARBORO, NC; small business) : $0 in 2 contractsfrom 2002 to 2003
$2,865 with Navy for Maintenance, Repair or Alteration of Real Property -- Other Non-Building Facilities. Signed on 2002-12-11. Completion date: 2003-03-12.
-$2,865, same as above.Signed on 2003-06-13. Completion date: 2003-03-12.
Top industries in this zip code by the number of employees in 2005:
Construction: Highway, Street, and Bridge Construction (500-999 employees: 1 establishment, 1-4 employees: 1 establishment)
2002 - 2018 National Fire Incident Reporting System (NFIRS) incidents
According to the data from the years 2002 - 2018 the average number of fires per year is 127. The highest number of reported fire incidents - 178 took place in 2006, and the least - 53 in 2018. The data has a dropping trend.
When looking into fire subcategories, the most reports belonged to: Structure Fires (48.2%), and Outside Fires (31.7%).
Fire incident types reported to NFIRS in Zip Code 27886


+$4,659
-$3,231
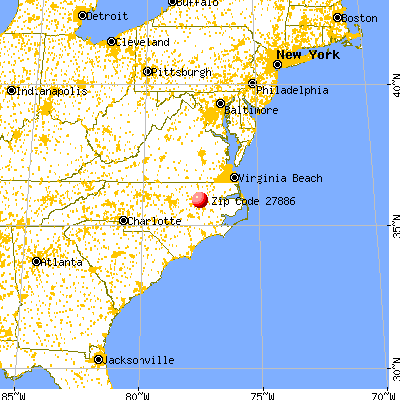
 Nearest zip codes: 27819, 27881, 27843, 27812, 27864, 27852.


 According to the data from the years 2002 - 2018 the average number of fires per year is 127. The highest number of reported fire incidents - 178 took place in 2006, and the least - 53 in 2018. The data has a dropping trend.
 When looking into fire subcategories, the most reports belonged to: Structure Fires (48.2%), and Outside Fires (31.7%).