Estimated zip code population in 2022: 13,523
Zip code population in 2010: 13,463
Zip code population in 2000: 14,363
Houses and condos: 6,155
Renter-occupied apartments: 1,942
% of renters here:
35%State:
33%
March 2022 cost of living index in zip code 28016: 80.6
(low, U.S. average is 100)
Land area: 42.9
sq. mi.
Water area: 0.4
sq. mi.
Population density: 315 people per square mile (very low).
OSM Map
General Map
Google Map
MSN Map
OSM Map
General Map
Google Map
MSN Map
OSM Map
General Map
Google Map
MSN Map
OSM Map
General Map
Google Map
MSN Map
Please wait while loading the map...
Real estate property taxes paid for housing units in 2022:
This zip code:
0.8% ($1,472)North Carolina:
0.6% ($1,769)
Median real estate property taxes paid for housing units with mortgages in 2022: $1,512 (0.7%)
Median real estate property taxes paid for housing units with no mortgage in 2022: $1,435 (0.8%)
Profiles of local businesses
Business Search - 14 Million verified businesses
Males: 6,958 Females: 6,562
For population 25 years and over in 28016:
High school or higher: 78.9%Bachelor's degree or higher: 12.4%Graduate or professional degree: 3.6%Unemployed: 3.7%Mean travel time to work (commute): 24.4 minutes
For population 15 years and over in 28016:
Never married: 28.0%Now married: 52.4%Separated: 3.0%Widowed: 6.0%Divorced: 10.7%
Zip code 28016 compared to state average:
Black race population percentage significantly below state average. Median age above state average. Foreign-born population percentage significantly below state average. Length of stay since moving in significantly above state average. Percentage of population with a bachelor's degree or higher significantly below state average. 11,219 83.0% White 873 6.5% Black 823 6.1% Hispanic or Latino 547 4.0% Two or more races 27 0.2% Native Hawaiian and Other 23 0.2% Some other race 7 0.05% Asian
Data:
Median household income ($)
Median household income (% change since 2000)
Household income diversity
Ratio of average income to average house value (%)
Ratio of average income to average rent
Median household income ($) - White
Median household income ($) - Black or African American
Median household income ($) - Asian
Median household income ($) - Hispanic or Latino
Median household income ($) - American Indian and Alaska Native
Median household income ($) - Multirace
Median household income ($) - Other Race
Median household income for houses/condos with a mortgage ($)
Median household income for apartments without a mortgage ($)
Races - White alone (%)
Races - White alone (% change since 2000)
Races - Black alone (%)
Races - Black alone (% change since 2000)
Races - American Indian alone (%)
Races - American Indian alone (% change since 2000)
Races - Asian alone (%)
Races - Asian alone (% change since 2000)
Races - Hispanic (%)
Races - Hispanic (% change since 2000)
Races - Native Hawaiian and Other Pacific Islander alone (%)
Races - Native Hawaiian and Other Pacific Islander alone (% change since 2000)
Races - Two or more races (%)
Races - Two or more races (% change since 2000)
Races - Other race alone (%)
Races - Other race alone (% change since 2000)
Racial diversity
Unemployment (%)
Unemployment (% change since 2000)
Unemployment (%) - White
Unemployment (%) - Black or African American
Unemployment (%) - Asian
Unemployment (%) - Hispanic or Latino
Unemployment (%) - American Indian and Alaska Native
Unemployment (%) - Multirace
Unemployment (%) - Other Race
Population density (people per square mile)
Population - Males (%)
Population - Females (%)
Population - Males (%) - White
Population - Males (%) - Black or African American
Population - Males (%) - Asian
Population - Males (%) - Hispanic or Latino
Population - Males (%) - American Indian and Alaska Native
Population - Males (%) - Multirace
Population - Males (%) - Other Race
Population - Females (%) - White
Population - Females (%) - Black or African American
Population - Females (%) - Asian
Population - Females (%) - Hispanic or Latino
Population - Females (%) - American Indian and Alaska Native
Population - Females (%) - Multirace
Population - Females (%) - Other Race
Coronavirus confirmed cases (May 04, 2024)
Deaths caused by coronavirus (May 04, 2024)
Coronavirus confirmed cases (per 100k population) (May 04, 2024)
Deaths caused by coronavirus (per 100k population) (May 04, 2024)
Daily increase in number of cases (May 04, 2024)
Weekly increase in number of cases (May 04, 2024)
Cases doubled (in days) (May 04, 2024)
Hospitalized patients (Apr 18, 2022)
Negative test results (Apr 18, 2022)
Total test results (Apr 18, 2022)
COVID Vaccine doses distributed (per 100k population) (Sep 19, 2023)
COVID Vaccine doses administered (per 100k population) (Sep 19, 2023)
COVID Vaccine doses distributed (Sep 19, 2023)
COVID Vaccine doses administered (Sep 19, 2023)
Likely homosexual households (%)
Likely homosexual households (% change since 2000)
Likely homosexual households - Lesbian couples (%)
Likely homosexual households - Lesbian couples (% change since 2000)
Likely homosexual households - Gay men (%)
Likely homosexual households - Gay men (% change since 2000)
Cost of living index
Median gross rent ($)
Median contract rent ($)
Median monthly housing costs ($)
Median house or condo value ($)
Median house or condo value ($ change since 2000)
Mean house or condo value by units in structure - 1, detached ($)
Mean house or condo value by units in structure - 1, attached ($)
Mean house or condo value by units in structure - 2 ($)
Mean house or condo value by units in structure by units in structure - 3 or 4 ($)
Mean house or condo value by units in structure - 5 or more ($)
Mean house or condo value by units in structure - Boat, RV, van, etc. ($)
Mean house or condo value by units in structure - Mobile home ($)
Median house or condo value ($) - White
Median house or condo value ($) - Black or African American
Median house or condo value ($) - Asian
Median house or condo value ($) - Hispanic or Latino
Median house or condo value ($) - American Indian and Alaska Native
Median house or condo value ($) - Multirace
Median house or condo value ($) - Other Race
Median resident age
Resident age diversity
Median resident age - Males
Median resident age - Females
Median resident age - White
Median resident age - Black or African American
Median resident age - Asian
Median resident age - Hispanic or Latino
Median resident age - American Indian and Alaska Native
Median resident age - Multirace
Median resident age - Other Race
Median resident age - Males - White
Median resident age - Males - Black or African American
Median resident age - Males - Asian
Median resident age - Males - Hispanic or Latino
Median resident age - Males - American Indian and Alaska Native
Median resident age - Males - Multirace
Median resident age - Males - Other Race
Median resident age - Females - White
Median resident age - Females - Black or African American
Median resident age - Females - Asian
Median resident age - Females - Hispanic or Latino
Median resident age - Females - American Indian and Alaska Native
Median resident age - Females - Multirace
Median resident age - Females - Other Race
Commute - mean travel time to work (minutes)
Travel time to work - Less than 5 minutes (%)
Travel time to work - Less than 5 minutes (% change since 2000)
Travel time to work - 5 to 9 minutes (%)
Travel time to work - 5 to 9 minutes (% change since 2000)
Travel time to work - 10 to 19 minutes (%)
Travel time to work - 10 to 19 minutes (% change since 2000)
Travel time to work - 20 to 29 minutes (%)
Travel time to work - 20 to 29 minutes (% change since 2000)
Travel time to work - 30 to 39 minutes (%)
Travel time to work - 30 to 39 minutes (% change since 2000)
Travel time to work - 40 to 59 minutes (%)
Travel time to work - 40 to 59 minutes (% change since 2000)
Travel time to work - 60 to 89 minutes (%)
Travel time to work - 60 to 89 minutes (% change since 2000)
Travel time to work - 90 or more minutes (%)
Travel time to work - 90 or more minutes (% change since 2000)
Marital status - Never married (%)
Marital status - Now married (%)
Marital status - Separated (%)
Marital status - Widowed (%)
Marital status - Divorced (%)
Median family income ($)
Median family income (% change since 2000)
Median non-family income ($)
Median non-family income (% change since 2000)
Median per capita income ($)
Median per capita income (% change since 2000)
Median family income ($) - White
Median family income ($) - Black or African American
Median family income ($) - Asian
Median family income ($) - Hispanic or Latino
Median family income ($) - American Indian and Alaska Native
Median family income ($) - Multirace
Median family income ($) - Other Race
Median year house/condo built
Median year apartment built
Year house built - Built 2005 or later (%)
Year house built - Built 2000 to 2004 (%)
Year house built - Built 1990 to 1999 (%)
Year house built - Built 1980 to 1989 (%)
Year house built - Built 1970 to 1979 (%)
Year house built - Built 1960 to 1969 (%)
Year house built - Built 1950 to 1959 (%)
Year house built - Built 1940 to 1949 (%)
Year house built - Built 1939 or earlier (%)
Average household size
Household density (households per square mile)
Average household size - White
Average household size - Black or African American
Average household size - Asian
Average household size - Hispanic or Latino
Average household size - American Indian and Alaska Native
Average household size - Multirace
Average household size - Other Race
Occupied housing units (%)
Vacant housing units (%)
Owner occupied housing units (%)
Renter occupied housing units (%)
Vacancy status - For rent (%)
Vacancy status - For sale only (%)
Vacancy status - Rented or sold, not occupied (%)
Vacancy status - For seasonal, recreational, or occasional use (%)
Vacancy status - For migrant workers (%)
Vacancy status - Other vacant (%)
Residents with income below the poverty level (%)
Residents with income below 50% of the poverty level (%)
Children below poverty level (%)
Poor families by family type - Married-couple family (%)
Poor families by family type - Male, no wife present (%)
Poor families by family type - Female, no husband present (%)
Poverty status for native-born residents (%)
Poverty status for foreign-born residents (%)
Poverty among high school graduates not in families (%)
Poverty among people who did not graduate high school not in families (%)
Residents with income below the poverty level (%) - White
Residents with income below the poverty level (%) - Black or African American
Residents with income below the poverty level (%) - Asian
Residents with income below the poverty level (%) - Hispanic or Latino
Residents with income below the poverty level (%) - American Indian and Alaska Native
Residents with income below the poverty level (%) - Multirace
Residents with income below the poverty level (%) - Other Race
Air pollution - Air Quality Index (AQI)
Air pollution - CO
Air pollution - NO2
Air pollution - SO2
Air pollution - Ozone
Air pollution - PM10
Air pollution - PM25
Air pollution - Pb
Crime - Murders per 100,000 population
Crime - Rapes per 100,000 population
Crime - Robberies per 100,000 population
Crime - Assaults per 100,000 population
Crime - Burglaries per 100,000 population
Crime - Thefts per 100,000 population
Crime - Auto thefts per 100,000 population
Crime - Arson per 100,000 population
Crime - City-data.com crime index
Crime - Violent crime index
Crime - Property crime index
Crime - Murders per 100,000 population (5 year average)
Crime - Rapes per 100,000 population (5 year average)
Crime - Robberies per 100,000 population (5 year average)
Crime - Assaults per 100,000 population (5 year average)
Crime - Burglaries per 100,000 population (5 year average)
Crime - Thefts per 100,000 population (5 year average)
Crime - Auto thefts per 100,000 population (5 year average)
Crime - Arson per 100,000 population (5 year average)
Crime - City-data.com crime index (5 year average)
Crime - Violent crime index (5 year average)
Crime - Property crime index (5 year average)
1996 Presidential Elections Results (%) - Democratic Party (Clinton)
1996 Presidential Elections Results (%) - Republican Party (Dole)
1996 Presidential Elections Results (%) - Other
2000 Presidential Elections Results (%) - Democratic Party (Gore)
2000 Presidential Elections Results (%) - Republican Party (Bush)
2000 Presidential Elections Results (%) - Other
2004 Presidential Elections Results (%) - Democratic Party (Kerry)
2004 Presidential Elections Results (%) - Republican Party (Bush)
2004 Presidential Elections Results (%) - Other
2008 Presidential Elections Results (%) - Democratic Party (Obama)
2008 Presidential Elections Results (%) - Republican Party (McCain)
2008 Presidential Elections Results (%) - Other
2012 Presidential Elections Results (%) - Democratic Party (Obama)
2012 Presidential Elections Results (%) - Republican Party (Romney)
2012 Presidential Elections Results (%) - Other
2016 Presidential Elections Results (%) - Democratic Party (Clinton)
2016 Presidential Elections Results (%) - Republican Party (Trump)
2016 Presidential Elections Results (%) - Other
2020 Presidential Elections Results (%) - Democratic Party (Biden)
2020 Presidential Elections Results (%) - Republican Party (Trump)
2020 Presidential Elections Results (%) - Other
Ancestries Reported - Arab (%)
Ancestries Reported - Czech (%)
Ancestries Reported - Danish (%)
Ancestries Reported - Dutch (%)
Ancestries Reported - English (%)
Ancestries Reported - French (%)
Ancestries Reported - French Canadian (%)
Ancestries Reported - German (%)
Ancestries Reported - Greek (%)
Ancestries Reported - Hungarian (%)
Ancestries Reported - Irish (%)
Ancestries Reported - Italian (%)
Ancestries Reported - Lithuanian (%)
Ancestries Reported - Norwegian (%)
Ancestries Reported - Polish (%)
Ancestries Reported - Portuguese (%)
Ancestries Reported - Russian (%)
Ancestries Reported - Scotch-Irish (%)
Ancestries Reported - Scottish (%)
Ancestries Reported - Slovak (%)
Ancestries Reported - Subsaharan African (%)
Ancestries Reported - Swedish (%)
Ancestries Reported - Swiss (%)
Ancestries Reported - Ukrainian (%)
Ancestries Reported - United States (%)
Ancestries Reported - Welsh (%)
Ancestries Reported - West Indian (%)
Ancestries Reported - Other (%)
Educational Attainment - No schooling completed (%)
Educational Attainment - Less than high school (%)
Educational Attainment - High school or equivalent (%)
Educational Attainment - Less than 1 year of college (%)
Educational Attainment - 1 or more years of college (%)
Educational Attainment - Associate degree (%)
Educational Attainment - Bachelor's degree (%)
Educational Attainment - Master's degree (%)
Educational Attainment - Professional school degree (%)
Educational Attainment - Doctorate degree (%)
School Enrollment - Nursery, preschool (%)
School Enrollment - Kindergarten (%)
School Enrollment - Grade 1 to 4 (%)
School Enrollment - Grade 5 to 8 (%)
School Enrollment - Grade 9 to 12 (%)
School Enrollment - College undergrad (%)
School Enrollment - Graduate or professional (%)
School Enrollment - Not enrolled in school (%)
School enrollment - Public schools (%)
School enrollment - Private schools (%)
School enrollment - Not enrolled (%)
Median number of rooms in houses and condos
Median number of rooms in apartments
Housing units lacking complete plumbing facilities (%)
Housing units lacking complete kitchen facilities (%)
Density of houses
Urban houses (%)
Rural houses (%)
Households with people 60 years and over (%)
Households with people 65 years and over (%)
Households with people 75 years and over (%)
Households with one or more nonrelatives (%)
Households with no nonrelatives (%)
Population in households (%)
Family households (%)
Nonfamily households (%)
Population in families (%)
Family households with own children (%)
Median number of bedrooms in owner occupied houses
Mean number of bedrooms in owner occupied houses
Median number of bedrooms in renter occupied houses
Mean number of bedrooms in renter occupied houses
Median number of vehichles in owner occupied houses
Mean number of vehichles in owner occupied houses
Median number of vehichles in renter occupied houses
Mean number of vehichles in renter occupied houses
Mortgage status - with mortgage (%)
Mortgage status - with second mortgage (%)
Mortgage status - with home equity loan (%)
Mortgage status - with both second mortgage and home equity loan (%)
Mortgage status - without a mortgage (%)
Average family size
Average family size - White
Average family size - Black or African American
Average family size - Asian
Average family size - Hispanic or Latino
Average family size - American Indian and Alaska Native
Average family size - Multirace
Average family size - Other Race
Geographical mobility - Same house 1 year ago (%)
Geographical mobility - Moved within same county (%)
Geographical mobility - Moved from different county within same state (%)
Geographical mobility - Moved from different state (%)
Geographical mobility - Moved from abroad (%)
Place of birth - Born in state of residence (%)
Place of birth - Born in other state (%)
Place of birth - Native, outside of US (%)
Place of birth - Foreign born (%)
Housing units in structures - 1, detached (%)
Housing units in structures - 1, attached (%)
Housing units in structures - 2 (%)
Housing units in structures - 3 or 4 (%)
Housing units in structures - 5 to 9 (%)
Housing units in structures - 10 to 19 (%)
Housing units in structures - 20 to 49 (%)
Housing units in structures - 50 or more (%)
Housing units in structures - Mobile home (%)
Housing units in structures - Boat, RV, van, etc. (%)
House/condo owner moved in on average (years ago)
Renter moved in on average (years ago)
Year householder moved into unit - Moved in 1999 to March 2000 (%)
Year householder moved into unit - Moved in 1995 to 1998 (%)
Year householder moved into unit - Moved in 1990 to 1994 (%)
Year householder moved into unit - Moved in 1980 to 1989 (%)
Year householder moved into unit - Moved in 1970 to 1979 (%)
Year householder moved into unit - Moved in 1969 or earlier (%)
Means of transportation to work - Drove car alone (%)
Means of transportation to work - Carpooled (%)
Means of transportation to work - Public transportation (%)
Means of transportation to work - Bus or trolley bus (%)
Means of transportation to work - Streetcar or trolley car (%)
Means of transportation to work - Subway or elevated (%)
Means of transportation to work - Railroad (%)
Means of transportation to work - Ferryboat (%)
Means of transportation to work - Taxicab (%)
Means of transportation to work - Motorcycle (%)
Means of transportation to work - Bicycle (%)
Means of transportation to work - Walked (%)
Means of transportation to work - Other means (%)
Working at home (%)
Industry diversity
Most Common Industries - Agriculture, forestry, fishing and hunting, and mining (%)
Most Common Industries - Agriculture, forestry, fishing and hunting (%)
Most Common Industries - Mining, quarrying, and oil and gas extraction (%)
Most Common Industries - Construction (%)
Most Common Industries - Manufacturing (%)
Most Common Industries - Wholesale trade (%)
Most Common Industries - Retail trade (%)
Most Common Industries - Transportation and warehousing, and utilities (%)
Most Common Industries - Transportation and warehousing (%)
Most Common Industries - Utilities (%)
Most Common Industries - Information (%)
Most Common Industries - Finance and insurance, and real estate and rental and leasing (%)
Most Common Industries - Finance and insurance (%)
Most Common Industries - Real estate and rental and leasing (%)
Most Common Industries - Professional, scientific, and management, and administrative and waste management services (%)
Most Common Industries - Professional, scientific, and technical services (%)
Most Common Industries - Management of companies and enterprises (%)
Most Common Industries - Administrative and support and waste management services (%)
Most Common Industries - Educational services, and health care and social assistance (%)
Most Common Industries - Educational services (%)
Most Common Industries - Health care and social assistance (%)
Most Common Industries - Arts, entertainment, and recreation, and accommodation and food services (%)
Most Common Industries - Arts, entertainment, and recreation (%)
Most Common Industries - Accommodation and food services (%)
Most Common Industries - Other services, except public administration (%)
Most Common Industries - Public administration (%)
Occupation diversity
Most Common Occupations - Management, business, science, and arts occupations (%)
Most Common Occupations - Management, business, and financial occupations (%)
Most Common Occupations - Management occupations (%)
Most Common Occupations - Business and financial operations occupations (%)
Most Common Occupations - Computer, engineering, and science occupations (%)
Most Common Occupations - Computer and mathematical occupations (%)
Most Common Occupations - Architecture and engineering occupations (%)
Most Common Occupations - Life, physical, and social science occupations (%)
Most Common Occupations - Education, legal, community service, arts, and media occupations (%)
Most Common Occupations - Community and social service occupations (%)
Most Common Occupations - Legal occupations (%)
Most Common Occupations - Education, training, and library occupations (%)
Most Common Occupations - Arts, design, entertainment, sports, and media occupations (%)
Most Common Occupations - Healthcare practitioners and technical occupations (%)
Most Common Occupations - Health diagnosing and treating practitioners and other technical occupations (%)
Most Common Occupations - Health technologists and technicians (%)
Most Common Occupations - Service occupations (%)
Most Common Occupations - Healthcare support occupations (%)
Most Common Occupations - Protective service occupations (%)
Most Common Occupations - Fire fighting and prevention, and other protective service workers including supervisors (%)
Most Common Occupations - Law enforcement workers including supervisors (%)
Most Common Occupations - Food preparation and serving related occupations (%)
Most Common Occupations - Building and grounds cleaning and maintenance occupations (%)
Most Common Occupations - Personal care and service occupations (%)
Most Common Occupations - Sales and office occupations (%)
Most Common Occupations - Sales and related occupations (%)
Most Common Occupations - Office and administrative support occupations (%)
Most Common Occupations - Natural resources, construction, and maintenance occupations (%)
Most Common Occupations - Farming, fishing, and forestry occupations (%)
Most Common Occupations - Construction and extraction occupations (%)
Most Common Occupations - Installation, maintenance, and repair occupations (%)
Most Common Occupations - Production, transportation, and material moving occupations (%)
Most Common Occupations - Production occupations (%)
Most Common Occupations - Transportation occupations (%)
Most Common Occupations - Material moving occupations (%)
People in Group quarters - Institutionalized population (%)
People in Group quarters - Correctional institutions (%)
People in Group quarters - Federal prisons and detention centers (%)
People in Group quarters - Halfway houses (%)
People in Group quarters - Local jails and other confinement facilities (including police lockups) (%)
People in Group quarters - Military disciplinary barracks (%)
People in Group quarters - State prisons (%)
People in Group quarters - Other types of correctional institutions (%)
People in Group quarters - Nursing homes (%)
People in Group quarters - Hospitals/wards, hospices, and schools for the handicapped (%)
People in Group quarters - Hospitals/wards and hospices for chronically ill (%)
People in Group quarters - Hospices or homes for chronically ill (%)
People in Group quarters - Military hospitals or wards for chronically ill (%)
People in Group quarters - Other hospitals or wards for chronically ill (%)
People in Group quarters - Hospitals or wards for drug/alcohol abuse (%)
People in Group quarters - Mental (Psychiatric) hospitals or wards (%)
People in Group quarters - Schools, hospitals, or wards for the mentally retarded (%)
People in Group quarters - Schools, hospitals, or wards for the physically handicapped (%)
People in Group quarters - Institutions for the deaf (%)
People in Group quarters - Institutions for the blind (%)
People in Group quarters - Orthopedic wards and institutions for the physically handicapped (%)
People in Group quarters - Wards in general hospitals for patients who have no usual home elsewhere (%)
People in Group quarters - Wards in military hospitals for patients who have no usual home elsewhere (%)
People in Group quarters - Juvenile institutions (%)
People in Group quarters - Long-term care (%)
People in Group quarters - Homes for abused, dependent, and neglected children (%)
People in Group quarters - Residential treatment centers for emotionally disturbed children (%)
People in Group quarters - Training schools for juvenile delinquents (%)
People in Group quarters - Short-term care, detention or diagnostic centers for delinquent children (%)
People in Group quarters - Type of juvenile institution unknown (%)
People in Group quarters - Noninstitutionalized population (%)
People in Group quarters - College dormitories (includes college quarters off campus) (%)
People in Group quarters - Military quarters (%)
People in Group quarters - On base (%)
People in Group quarters - Barracks, unaccompanied personnel housing (UPH), (Enlisted/Officer), ;and similar group living quarters for military personnel (%)
People in Group quarters - Transient quarters for temporary residents (%)
People in Group quarters - Military ships (%)
People in Group quarters - Group homes (%)
People in Group quarters - Homes or halfway houses for drug/alcohol abuse (%)
People in Group quarters - Homes for the mentally ill (%)
People in Group quarters - Homes for the mentally retarded (%)
People in Group quarters - Homes for the physically handicapped (%)
People in Group quarters - Other group homes (%)
People in Group quarters - Religious group quarters (%)
People in Group quarters - Dormitories (%)
People in Group quarters - Agriculture workers' dormitories on farms (%)
People in Group quarters - Job Corps and vocational training facilities (%)
People in Group quarters - Other workers' dormitories (%)
People in Group quarters - Crews of maritime vessels (%)
People in Group quarters - Other nonhousehold living situations (%)
People in Group quarters - Other noninstitutional group quarters (%)
Residents speaking English at home (%)
Residents speaking English at home - Born in the United States (%)
Residents speaking English at home - Native, born elsewhere (%)
Residents speaking English at home - Foreign born (%)
Residents speaking Spanish at home (%)
Residents speaking Spanish at home - Born in the United States (%)
Residents speaking Spanish at home - Native, born elsewhere (%)
Residents speaking Spanish at home - Foreign born (%)
Residents speaking other language at home (%)
Residents speaking other language at home - Born in the United States (%)
Residents speaking other language at home - Native, born elsewhere (%)
Residents speaking other language at home - Foreign born (%)
Class of Workers - Employee of private company (%)
Class of Workers - Self-employed in own incorporated business (%)
Class of Workers - Private not-for-profit wage and salary workers (%)
Class of Workers - Local government workers (%)
Class of Workers - State government workers (%)
Class of Workers - Federal government workers (%)
Class of Workers - Self-employed workers in own not incorporated business and Unpaid family workers (%)
House heating fuel used in houses and condos - Utility gas (%)
House heating fuel used in houses and condos - Bottled, tank, or LP gas (%)
House heating fuel used in houses and condos - Electricity (%)
House heating fuel used in houses and condos - Fuel oil, kerosene, etc. (%)
House heating fuel used in houses and condos - Coal or coke (%)
House heating fuel used in houses and condos - Wood (%)
House heating fuel used in houses and condos - Solar energy (%)
House heating fuel used in houses and condos - Other fuel (%)
House heating fuel used in houses and condos - No fuel used (%)
House heating fuel used in apartments - Utility gas (%)
House heating fuel used in apartments - Bottled, tank, or LP gas (%)
House heating fuel used in apartments - Electricity (%)
House heating fuel used in apartments - Fuel oil, kerosene, etc. (%)
House heating fuel used in apartments - Coal or coke (%)
House heating fuel used in apartments - Wood (%)
House heating fuel used in apartments - Solar energy (%)
House heating fuel used in apartments - Other fuel (%)
House heating fuel used in apartments - No fuel used (%)
Armed forces status - In Armed Forces (%)
Armed forces status - Civilian (%)
Armed forces status - Civilian - Veteran (%)
Armed forces status - Civilian - Nonveteran (%)
Fatal accidents locations in years 2005-2021
Fatal accidents locations in 2005
Fatal accidents locations in 2006
Fatal accidents locations in 2007
Fatal accidents locations in 2008
Fatal accidents locations in 2009
Fatal accidents locations in 2010
Fatal accidents locations in 2011
Fatal accidents locations in 2012
Fatal accidents locations in 2013
Fatal accidents locations in 2014
Fatal accidents locations in 2015
Fatal accidents locations in 2016
Fatal accidents locations in 2017
Fatal accidents locations in 2018
Fatal accidents locations in 2019
Fatal accidents locations in 2020
Fatal accidents locations in 2021
Alcohol use - People drinking some alcohol every month (%)
Alcohol use - People not drinking at all (%)
Alcohol use - Average days/month drinking alcohol
Alcohol use - Average drinks/week
Alcohol use - Average days/year people drink much
Audiometry - Average condition of hearing (%)
Audiometry - People that can hear a whisper from across a quiet room (%)
Audiometry - People that can hear normal voice from across a quiet room (%)
Audiometry - Ears ringing, roaring, buzzing (%)
Audiometry - Had a job exposure to loud noise (%)
Audiometry - Had off-work exposure to loud noise (%)
Blood Pressure & Cholesterol - Has high blood pressure (%)
Blood Pressure & Cholesterol - Checking blood pressure at home (%)
Blood Pressure & Cholesterol - Frequently checking blood cholesterol (%)
Blood Pressure & Cholesterol - Has high cholesterol level (%)
Consumer Behavior - Money monthly spent on food at supermarket/grocery store
Consumer Behavior - Money monthly spent on food at other stores
Consumer Behavior - Money monthly spent on eating out
Consumer Behavior - Money monthly spent on carryout/delivered foods
Consumer Behavior - Income spent on food at supermarket/grocery store (%)
Consumer Behavior - Income spent on food at other stores (%)
Consumer Behavior - Income spent on eating out (%)
Consumer Behavior - Income spent on carryout/delivered foods (%)
Current Health Status - General health condition (%)
Current Health Status - Blood donors (%)
Current Health Status - Has blood ever tested for HIV virus (%)
Current Health Status - Left-handed people (%)
Dermatology - People using sunscreen (%)
Diabetes - Diabetics (%)
Diabetes - Had a blood test for high blood sugar (%)
Diabetes - People taking insulin (%)
Diet Behavior & Nutrition - Diet health (%)
Diet Behavior & Nutrition - Milk product consumption (# of products/month)
Diet Behavior & Nutrition - Meals not home prepared (#/week)
Diet Behavior & Nutrition - Meals from fast food or pizza place (#/week)
Diet Behavior & Nutrition - Ready-to-eat foods (#/month)
Diet Behavior & Nutrition - Frozen meals/pizza (#/month)
Drug Use - People that ever used marijuana or hashish (%)
Drug Use - Ever used hard drugs (%)
Drug Use - Ever used any form of cocaine (%)
Drug Use - Ever used heroin (%)
Drug Use - Ever used methamphetamine (%)
Health Insurance - People covered by health insurance (%)
Kidney Conditions-Urology - Avg. # of times urinating at night
Medical Conditions - People with asthma (%)
Medical Conditions - People with anemia (%)
Medical Conditions - People with psoriasis (%)
Medical Conditions - People with overweight (%)
Medical Conditions - Elderly people having difficulties in thinking or remembering (%)
Medical Conditions - People who ever received blood transfusion (%)
Medical Conditions - People having trouble seeing even with glass/contacts (%)
Medical Conditions - People with arthritis (%)
Medical Conditions - People with gout (%)
Medical Conditions - People with congestive heart failure (%)
Medical Conditions - People with coronary heart disease (%)
Medical Conditions - People with angina pectoris (%)
Medical Conditions - People who ever had heart attack (%)
Medical Conditions - People who ever had stroke (%)
Medical Conditions - People with emphysema (%)
Medical Conditions - People with thyroid problem (%)
Medical Conditions - People with chronic bronchitis (%)
Medical Conditions - People with any liver condition (%)
Medical Conditions - People who ever had cancer or malignancy (%)
Mental Health - People who have little interest in doing things (%)
Mental Health - People feeling down, depressed, or hopeless (%)
Mental Health - People who have trouble sleeping or sleeping too much (%)
Mental Health - People feeling tired or having little energy (%)
Mental Health - People with poor appetite or overeating (%)
Mental Health - People feeling bad about themself (%)
Mental Health - People who have trouble concentrating on things (%)
Mental Health - People moving or speaking slowly or too fast (%)
Mental Health - People having thoughts they would be better off dead (%)
Oral Health - Average years since last visit a dentist
Oral Health - People embarrassed because of mouth (%)
Oral Health - People with gum disease (%)
Oral Health - General health of teeth and gums (%)
Oral Health - Average days a week using dental floss/device
Oral Health - Average days a week using mouthwash for dental problem
Oral Health - Average number of teeth
Pesticide Use - Households using pesticides to control insects (%)
Pesticide Use - Households using pesticides to kill weeds (%)
Physical Activity - People doing vigorous-intensity work activities (%)
Physical Activity - People doing moderate-intensity work activities (%)
Physical Activity - People walking or bicycling (%)
Physical Activity - People doing vigorous-intensity recreational activities (%)
Physical Activity - People doing moderate-intensity recreational activities (%)
Physical Activity - Average hours a day doing sedentary activities
Physical Activity - Average hours a day watching TV or videos
Physical Activity - Average hours a day using computer
Physical Functioning - People having limitations keeping them from working (%)
Physical Functioning - People limited in amount of work they can do (%)
Physical Functioning - People that need special equipment to walk (%)
Physical Functioning - People experiencing confusion/memory problems (%)
Physical Functioning - People requiring special healthcare equipment (%)
Prescription Medications - Average number of prescription medicines taking
Preventive Aspirin Use - Adults 40+ taking low-dose aspirin (%)
Reproductive Health - Vaginal deliveries (%)
Reproductive Health - Cesarean deliveries (%)
Reproductive Health - Deliveries resulted in a live birth (%)
Reproductive Health - Pregnancies resulted in a delivery (%)
Reproductive Health - Women breastfeeding newborns (%)
Reproductive Health - Women that had a hysterectomy (%)
Reproductive Health - Women that had both ovaries removed (%)
Reproductive Health - Women that have ever taken birth control pills (%)
Reproductive Health - Women taking birth control pills (%)
Reproductive Health - Women that have ever used Depo-Provera or injectables (%)
Reproductive Health - Women that have ever used female hormones (%)
Sexual Behavior - People 18+ that ever had sex (vaginal, anal, or oral) (%)
Sexual Behavior - Males 18+ that ever had vaginal sex with a woman (%)
Sexual Behavior - Males 18+ that ever performed oral sex on a woman (%)
Sexual Behavior - Males 18+ that ever had anal sex with a woman (%)
Sexual Behavior - Males 18+ that ever had any sex with a man (%)
Sexual Behavior - Females 18+ that ever had vaginal sex with a man (%)
Sexual Behavior - Females 18+ that ever performed oral sex on a man (%)
Sexual Behavior - Females 18+ that ever had anal sex with a man (%)
Sexual Behavior - Females 18+ that ever had any kind of sex with a woman (%)
Sexual Behavior - Average age people first had sex
Sexual Behavior - Average number of female sex partners in lifetime (males 18+)
Sexual Behavior - Average number of female vaginal sex partners in lifetime (males 18+)
Sexual Behavior - Average age people first performed oral sex on a woman (18+)
Sexual Behavior - Average number of woman performed oral sex on in lifetime (18+)
Sexual Behavior - Average number of male sex partners in lifetime (males 18+)
Sexual Behavior - Average number of male anal sex partners in lifetime (males 18+)
Sexual Behavior - Average age people first performed oral sex on a man (18+)
Sexual Behavior - Average number of male oral sex partners in lifetime (18+)
Sexual Behavior - People using protection when performing oral sex (%)
Sexual Behavior - Average number of times people have vaginal or anal sex a year
Sexual Behavior - People having sex without condom (%)
Sexual Behavior - Average number of male sex partners in lifetime (females 18+)
Sexual Behavior - Average number of male vaginal sex partners in lifetime (females 18+)
Sexual Behavior - Average number of female sex partners in lifetime (females 18+)
Sexual Behavior - Circumcised males 18+ (%)
Sleep Disorders - Average hours sleeping at night
Sleep Disorders - People that has trouble sleeping (%)
Smoking-Cigarette Use - People smoking cigarettes (%)
Taste & Smell - People 40+ having problems with smell (%)
Taste & Smell - People 40+ having problems with taste (%)
Taste & Smell - People 40+ that ever had wisdom teeth removed (%)
Taste & Smell - People 40+ that ever had tonsils teeth removed (%)
Taste & Smell - People 40+ that ever had a loss of consciousness because of a head injury (%)
Taste & Smell - People 40+ that ever had a broken nose or other serious injury to face or skull (%)
Taste & Smell - People 40+ that ever had two or more sinus infections (%)
Weight - Average height (inches)
Weight - Average weight (pounds)
Weight - Average BMI
Weight - People that are obese (%)
Weight - People that ever were obese (%)
Weight - People trying to lose weight (%)
Urban population: 5,770
Rural population: 7,752
Estimated median house/condo value in 2022: $195,070
28016:
$195,070North Carolina:
$280,600
Median resident age: This zip code:
45.5 yearsNorth Carolina median age:
39.2 years
Average household size: This zip code:
2.4 peopleNorth Carolina:
2.4 people
Averages for the 2020 tax year for zip code 28016, filed in 2021:
Average Adjusted Gross Income (AGI) in 2020: $48,411 (Individual Income Tax Returns) Here:
$48,411State:
$70,020
Salary/wage: $40,395 (reported on 86.0% of returns )Here:
$40,395State:
$58,387
(% of AGI for various income ranges: 1222.5% for AGIs below $25k , 3791.0% for AGIs $25k-50k , 6749.6% for AGIs $50k-75k , 10020.6% for AGIs $75k-100k , 16808.1% for AGIs $100k-200k ) Taxable interest for individuals: $729 (reported on 16.4% of returns )This zip code:
$729North Carolina:
$1,479
(% of AGI for various income ranges: 5.6% for AGIs below $25k , 10.7% for AGIs $25k-50k , 14.3% for AGIs $50k-75k , 13.1% for AGIs $75k-100k , 65.0% for AGIs $100k-200k ) Ordinary dividends: $3,285 (reported on 6.6% of returns )(% of AGI for various income ranges: 9.7% for AGIs below $25k , 9.7% for AGIs $25k-50k , 29.4% for AGIs $50k-75k , 30.3% for AGIs $75k-100k , 107.3% for AGIs $100k-200k ) Net capital gain/loss in AGI: +$7,577 (reported on 5.8% of returns )Here:
+$7,577State:
+$23,652
(% of AGI for various income ranges: 7.3% for AGIs below $25k , 9.1% for AGIs $25k-50k , 32.5% for AGIs $50k-75k , 24.4% for AGIs $75k-100k , 295.4% for AGIs $100k-200k ) Profit/loss from business: +$6,295 (reported on 12.6% of returns )Here:
+$6,295State:
+$11,710
(% of AGI for various income ranges: 110.1% for AGIs below $25k , 63.2% for AGIs $25k-50k , 134.6% for AGIs $50k-75k , 145.0% for AGIs $75k-100k , 193.1% for AGIs $100k-200k ) Taxable individual retirement arrangement distribution: $13,334 (reported on 6.8% of returns )28016:
$13,334North Carolina:
$20,247
(% of AGI for various income ranges: 61.0% for AGIs below $25k , 57.0% for AGIs $25k-50k , 123.3% for AGIs $50k-75k , 205.3% for AGIs $75k-100k , 782.7% for AGIs $100k-200k ) Total itemized deductions: $28,962 (reported on 2.7% of returns )Here:
$28,962State:
$34,549
(% of AGI for various income ranges: 20.1% for AGIs below $25k , 51.4% for AGIs $25k-50k , 138.6% for AGIs $50k-75k , 170.9% for AGIs $75k-100k , 416.2% for AGIs $100k-200k ) Charity contributions: $10,669 (reported on 2.2% of returns )Here:
$10,669State:
$13,360
(% of AGI for various income ranges: 9.6% for AGIs $25k-50k , 53.8% for AGIs $50k-75k , 151.9% for AGIs $100k-200k ) Taxes paid: $6,231 (reported on 2.7% of returns )(% of AGI for various income ranges: 10.3% for AGIs $25k-50k , 28.0% for AGIs $50k-75k , 46.6% for AGIs $75k-100k , 107.3% for AGIs $100k-200k ) Earned income credit: $2,303 (reported on 24.6% of returns )(% of AGI for various income ranges: 118.1% for AGIs below $25k , 88.8% for AGIs $25k-50k ) Percentage of individuals using paid preparers for their 2020 taxes: 94.5%(% for various income ranges: 94.0% for AGIs below $25k , 95.1% for AGIs $25k-50k , 95.7% for AGIs $50k-75k , 93.3% for AGIs $75k-100k , 93.3% for AGIs $100k-200k , 100.0% for AGIs over 200k )
Averages for the 2012 tax year for zip code 28016, filed in 2013:
Average Adjusted Gross Income (AGI) in 2012: $36,689 (Individual Income Tax Returns) Here:
$36,689State:
$54,937
Salary/wage: $34,071 (reported on 86.4% of returns )Here:
$34,071State:
$46,336
(% of AGI for various income ranges: 75.5% for AGIs below $25k , 84.0% for AGIs $25k-50k , 83.2% for AGIs $50k-75k , 82.0% for AGIs $75k-100k , 73.6% for AGIs $100k-200k ) Taxable interest for individuals: $884 (reported on 20.4% of returns )This zip code:
$884North Carolina:
$1,298
(% of AGI for various income ranges: 0.7% for AGIs below $25k , 0.3% for AGIs $25k-50k , 0.4% for AGIs $50k-75k , 0.2% for AGIs $75k-100k , 0.9% for AGIs $100k-200k ) Ordinary dividends: $2,328 (reported on 8.8% of returns )(% of AGI for various income ranges: 0.9% for AGIs below $25k , 0.4% for AGIs $25k-50k , 0.5% for AGIs $50k-75k , 0.3% for AGIs $75k-100k , 0.8% for AGIs $100k-200k ) Net capital gain/loss in AGI: +$1,328 (reported on 5.4% of returns )Here:
+$1,328State:
+$12,740
(% of AGI for various income ranges: 0.1% for AGIs $25k-50k , 0.9% for AGIs $100k-200k ) Profit/loss from business: +$5,937 (reported on 13.1% of returns )Here:
+$5,937State:
+$10,311
(% of AGI for various income ranges: 7.1% for AGIs below $25k , 1.8% for AGIs $25k-50k , 1.5% for AGIs $50k-75k , 0.3% for AGIs $75k-100k , 0.4% for AGIs $100k-200k ) Taxable individual retirement arrangement distribution: $11,532 (reported on 7.1% of returns )28016:
$11,532North Carolina:
$15,575
(% of AGI for various income ranges: 2.8% for AGIs below $25k , 1.7% for AGIs $25k-50k , 2.1% for AGIs $50k-75k , 2.8% for AGIs $75k-100k , 2.4% for AGIs $100k-200k ) Total itemized deductions: $17,309 (25% of AGI, reported on 23.4% of returns )Here:
$17,309State:
$23,438
Here:
25.1% of AGIState:
21.5% of AGI
(% of AGI for various income ranges: 7.2% for AGIs below $25k , 8.1% for AGIs $25k-50k , 11.9% for AGIs $50k-75k , 14.3% for AGIs $75k-100k , 15.2% for AGIs $100k-200k ) Charity contributions: $3,916 (reported on 18.9% of returns )(% of AGI for various income ranges: 0.9% for AGIs below $25k , 1.4% for AGIs $25k-50k , 2.0% for AGIs $50k-75k , 2.8% for AGIs $75k-100k , 3.3% for AGIs $100k-200k ) Taxes paid: $5,547 (reported on 23.4% of returns )(% of AGI for various income ranges: 1.1% for AGIs below $25k , 1.9% for AGIs $25k-50k , 3.5% for AGIs $50k-75k , 5.1% for AGIs $75k-100k , 6.9% for AGIs $100k-200k ) Earned income credit: $2,373 (reported on 29.5% of returns )(% of AGI for various income ranges: 9.0% for AGIs below $25k , 1.6% for AGIs $25k-50k ) Percentage of individuals using paid preparers for their 2012 taxes: 61.7%(% for various income ranges: 60.2% for AGIs below $25k , 61.8% for AGIs $25k-50k , 64.3% for AGIs $50k-75k , 62.5% for AGIs $75k-100k , 66.7% for AGIs $100k-200k )
Averages for the 2004 tax year for zip code 28016, filed in 2005:
Average Adjusted Gross Income (AGI) in 2004: $33,308 (Individual Income Tax Returns) Here:
$33,308State:
$45,376
Salary/wage: $31,697 (reported on 89.4% of returns )Here:
$31,697State:
$39,442
(% of AGI for various income ranges: 80.2% for AGIs below $10k , 83.9% for AGIs $10k-25k , 88.4% for AGIs $25k-50k , 86.2% for AGIs $50k-75k , 86.8% for AGIs $75k-100k , 73.3% for AGIs over 100k ) Taxable interest for individuals: $961 (reported on 25.4% of returns )This zip code:
$961North Carolina:
$1,515
(% of AGI for various income ranges: 2.1% for AGIs below $10k , 1.1% for AGIs $10k-25k , 0.6% for AGIs $25k-50k , 0.5% for AGIs $50k-75k , 0.3% for AGIs $75k-100k , 1.4% for AGIs over 100k ) Taxable dividends: $1,330 (reported on 11.4% of returns )(% of AGI for various income ranges: 0.7% for AGIs below $10k , 0.3% for AGIs $10k-25k , 0.3% for AGIs $25k-50k , 0.4% for AGIs $50k-75k , 0.4% for AGIs $75k-100k , 1.2% for AGIs over 100k ) Net capital gain/loss: +$3,431 (reported on 7.3% of returns )Here:
+$3,431State:
+$11,152
(% of AGI for various income ranges: -0.6% for AGIs below $10k , -0.1% for AGIs $10k-25k , 0.2% for AGIs $25k-50k , 0.7% for AGIs $50k-75k , 0.7% for AGIs $75k-100k , 4.0% for AGIs over 100k ) Profit/loss from business: +$6,149 (reported on 12.7% of returns )Here:
+$6,149State:
+$9,490
(% of AGI for various income ranges: 10.8% for AGIs below $10k , 4.6% for AGIs $10k-25k , 1.1% for AGIs $25k-50k , 1.7% for AGIs $50k-75k , 0.7% for AGIs $75k-100k , 4.5% for AGIs over 100k ) IRA payment deduction: $2,838 (reported on 1.5% of returns )28016:
$2,838North Carolina:
$2,967
(% of AGI for various income ranges: 0.1% for AGIs $10k-25k , 0.1% for AGIs $25k-50k , 0.1% for AGIs $50k-75k , 0.2% for AGIs $75k-100k ) Total itemized deductions: $14,948 (26% of AGI, reported on 30.6% of returns )Here:
$14,948State:
$19,464
Here:
25.8% of AGIState:
22.7% of AGI
(% of AGI for various income ranges: 9.5% for AGIs below $10k , 8.0% for AGIs $10k-25k , 12.8% for AGIs $25k-50k , 15.8% for AGIs $50k-75k , 16.9% for AGIs $75k-100k , 16.6% for AGIs over 100k ) Charity contributions deductions: $3,061 (5% of AGI, reported on 25.6% of returns )Here:
5.1% of AGIState:
4.5% of AGI
(% of AGI for various income ranges: 0.8% for AGIs below $10k , 1.2% for AGIs $10k-25k , 1.9% for AGIs $25k-50k , 2.8% for AGIs $50k-75k , 3.3% for AGIs $75k-100k , 3.6% for AGIs over 100k ) Total tax: $3,712 (reported on 68.0% of returns )(% of AGI for various income ranges: 2.6% for AGIs below $10k , 3.2% for AGIs $10k-25k , 5.9% for AGIs $25k-50k , 8.0% for AGIs $50k-75k , 9.7% for AGIs $75k-100k , 16.2% for AGIs over 100k ) Earned income credit: $1,872 (reported on 25.8% of returns )Percentage of individuals using paid preparers for their 2004 taxes: 72.3%(% for various income ranges: 66.5% for AGIs below $10k , 76.0% for AGIs $10k-25k , 73.7% for AGIs $25k-50k , 69.7% for AGIs $50k-75k , 70.6% for AGIs $75k-100k , 75.6% for AGIs over 100k )
Estimated median household income in 2022: This zip code:
$52,346North Carolina:
$67,481
Nearest zip codes: 28034 ,
28052 ,
28033 ,
28086 ,
28077 ,
28054 .
Kings Mountain Zip Code Map
Percentage of family households: This zip code:
47.2%North Carolina:
46.1%
Percentage of households with unmarried partners: This zip code:
7.7%North Carolina:
47.9%
Likely homosexual households (counted as self-reported same-sex unmarried-partner households)
Lesbian couples: 0.0% of all households Gay men: 0.0% of all households
Household received Food Stamps/SNAP in the past 12 months: 847Household did not receive Food Stamps/SNAP in the past 12 months: 4,688
Women who had a birth in the past 12 months: 69 (26 now married , 41 unmarried) Women who did not have a birth in the past 12 months: 3,161 (1,600 now married , 1,565 unmarried)
Housing units in zip code 28016 with a mortgage: 1,747 (140
second mortgage , 129
both second mortgage and home equity loan )
Houses without a mortgage: 31
Median monthly owner costs for units with a mortgage: $1,113
Median monthly owner costs for units without a mortgage: $361
Residents with income below the poverty level in 2022:
This zip code:
10.1%Whole state:
12.8%
Residents with income below 50% of the poverty level in 2022:
This zip code:
3.8%Whole state:
6.8%
Median number of rooms in houses and condos: Median number of rooms in apartments: Notable locations in this zip code not listed on our city pages
Click to draw/clear zip code borders Churches in zip code 28016 include: (A) , Holland Memorial Church (B) , Long Creek Church (C) , Bingham Memorial Church (D) , Mount Pisgah Church (E) , Concord Church (F) , Faith Church (G) , Gamble Hill Church (H) , Sunnyside Church (I) . Display/hide their locations on the map
Cemetery: (1) . Display/hide its location on the map
Reservoirs: (A) , Martin Marietta Holding Lake (B) , Lagoon D (C) , Storage Area Number Two (D) , Bessemer City Reservoir (E) . Display/hide their locations on the map
Creek: (A) . Display/hide its location on the map
Parks in zip code 28016 include: (1) , Washington Park (2) . Display/hide their locations on the map
Year house built (houses)
10 2020 or later90 2010 to 2019681 2000 to 20091,038 1990 to 19991,163 1980 to 19891,130 1970 to 1979600 1960 to 1969367 1950 to 1959274 1940 to 1949415 1939 or earlier
Zip code 28016 household income distribution in 2022 296 Less than $10,000264 $10,000 to $14,999342 $15,000 to $19,999121 $20,000 to $24,999373 $25,000 to $29,999445 $30,000 to $34,999187 $35,000 to $39,999429 $40,000 to $44,999149 $45,000 to $49,999361 $50,000 to $59,999700 $60,000 to $74,999748 $75,000 to $99,999363 $100,000 to $124,999358 $125,000 to $149,999193 $150,000 to $199,999159 $200,000 or moreEstimate of home value of owner-occupied houses/condos in 2022 in zip code 28016 98 Less than $10,00026 $10,000 to $14,9998 $15,000 to $19,99932 $20,000 to $24,99915 $25,000 to $29,9997 $40,000 to $49,99976 $50,000 to $59,99947 $60,000 to $69,999169 $70,000 to $79,999173 $80,000 to $89,99952 $90,000 to $99,999366 $100,000 to $124,999202 $125,000 to $149,999305 $150,000 to $174,999201 $175,000 to $199,999394 $200,000 to $249,999334 $250,000 to $299,999243 $300,000 to $399,999361 $400,000 to $499,99966 $500,000 to $749,99934 $2,000,000 or moreRent paid by renters in 2022 in zip code 28016 8 $250 to $29951 $300 to $34961 $350 to $399205 $400 to $449164 $450 to $49996 $500 to $549170 $550 to $599143 $600 to $649140 $650 to $699141 $700 to $749139 $750 to $799145 $800 to $89971 $900 to $999127 $1,000 to $1,24916 $1,250 to $1,49986 No cash rent
Median gross rent in 2022: $866.
Median price asked for vacant for-sale houses and condos in 2022: $165,967.
Estimated median house (or condo) value in 2022 for: White Non-Hispanic householders: $201,771Black or African American householders: $181,668American Indian or Alaska Native householders: $81,899Some other race householders: $186,135Two or more races householders: $283,670Hispanic or Latino householders: $279,203Estimated median house or condo value in 2022: $195,070
28016:
$195,070North Carolina:
$280,600
Lower value quartile - upper value quartile: $121,640 - $293,287
Mean price in 2022: Detached houses: $317,064Here:
$317,064State:
$375,326
Townhouses or other attached units: $290,701Here:
$290,701State:
$317,935
In 3-to-4-unit structures: $226,982Here:
$226,982State:
$254,939
In 5-or-more-unit structures: $192,553Here:
$192,553State:
$329,290
Mobile homes: $120,670Here:
$120,670State:
$124,933
Housing units in structures:
One, detached: 4,446One, attached: 38Two: 1203 or 4: 2655 to 9: 12010 to 19: 1320 to 49: 87Mobile homes: 1,004Unemployment : 3.7%
Means of transportation to work in zip code 28016 76.7% 4,729 Drove a car alone12.3% 756 Carpooled0.2% 13 Bus or trolley bus0.6% 35 Motorcycle0.4% 26 Bicycle0.4% 26 Walked0.3% 19 Other means6.1% 376 Worked at homeTravel time to work (commute) in zip code 28016 78 Less than 5 minutes443 5 to 9 minutes668 10 to 14 minutes921 15 to 19 minutes1,267 20 to 24 minutes390 25 to 29 minutes642 30 to 34 minutes147 35 to 39 minutes267 40 to 44 minutes530 45 to 59 minutes166 60 to 89 minutes66 90 or more minutes
Percentage of zip code residents living and working in this county: 66.7%
Household type by relationship:
Households: 13,523
Male householders: 2,640 (770 living alone ), Female householders: 2,885 (733 living alone )2,790 spouses (2,747 opposite-sex spouses ), 250 unmarried partners , (250 opposite-sex unmarried partners ), 3,170 children (2,985 natural , 83 adopted , 100 stepchildren ), 529 grandchildren , 237 brothers or sisters , 86 parents , 14 foster children , 317 other relatives , 546 non-relatives In group quarters: 26 (-1 institutionalized population )
Size of family households: 1,743 2-persons , 988 3-persons , 690 4-persons , 254 5-persons , 61 6-persons , 13 7-or-more-persons
Size of nonfamily households: 1,504 1-person , 198 2-persons , 62 3-persons
1,369 married couples with children. single-parent households (125 men , 281 women ).
93.6% of residents of 28016 zip code speak English at home. of residents speak Spanish at home (81% very well, 7% well, 7% not well, 4% not at all ).of residents speak other Indo-European language at home (91% very well, 9% well ).of residents speak Asian or Pacific Island language at home (100% very well ).
Foreign born population: 311 (2.3%)
(61.6%
of them are naturalized citizens )
This zip code:
2.3%Whole state:
8.6%
40% Honduras 21% Barbados 17% France 9% Sweden 7% United Kingdom, excluding England and Scotland 4% Bolivia 2% Malaysia 36% American 12% English 7% German 4% Irish 2% Scotch-Irish 1% Polish 1% Scottish
Year of entry for the foreign-born population
20 2010 or later 83 2000 to 2009 92 1990 to 1999 222 Before 1990
Facilities with environmental interests located in this zip code:
BESSEMER WASTE COMPANY INC ** INACTIVE * (321 EAST MARYLAND STREET in BESSEMER CITY, NC)
AIR MINOR (AIRS/AFS) STATE MASTER (North Carolina facility info) - AIR PROGRAM Business SIC classification: TEXTILE GOODSBusiness NAICS classification: ALL OTHER MISCELLANEOUS TEXTILE PRODUCT MILLS.Alternative names: BESSEMER WASTE COMPANY INCORPORATED
BESSEMER CITY CENTRAL ELEMENTARY SCHOOL (1400 PUETT`S CHAPEL ROAD in BESSEMER CITY, NC)
(Geographic Names Information System) (National Center for Education Statistics) - STATE ID-332 Organizations: GASTON COUNTY SCHOOLS (SCHOOL DISTRICT)
Alternative names: BESSEMBER CITY CENTRAL ELEMENTARY SCHOOL
BESSEMER CITY HIGH SCHOOL (119 YELLOW JACKET LANE in BESSEMER CITY, NC)
(Geographic Names Information System) (National Center for Education Statistics) - STATE ID-336 Organizations: GASTON COUNTY SCHOOLS (SCHOOL DISTRICT)
BESSEMER CITY PRIMARY SCHOOL (1302 NORTH 12TH STREET in BESSEMER CITY, NC)
(Geographic Names Information System) (National Center for Education Statistics) - STATE ID-338 Organizations: GASTON COUNTY SCHOOLS (SCHOOL DISTRICT)
BESSEMER CITY WWTP (SOUTH 11TH STREET in BESSEMER CITY, NC)
STATE MASTER (North Carolina facility info) - UNDERGROUND STORAGE TANK PROGRAM (Resource Conservation and Recovery Act (tracking hazardous waste)) Business SIC classification: NONCLASSIFIABLE ESTABLISHMENTSOrganizations: OPERNAME (CONTACT/OPERATOR)
Alternative names: BESSEMER CITY WASTE WATER TREATMENT FACILITY, BESSEMER CITY Waste water treatment plant TOWN OF, CITY OF BESSEMER CITY WWTP
BESSEMER CITY MIDDLE (525 ED WILSON ROAD in BESSEMER CITY, NC)
(National Center for Education Statistics) - STATE ID-436 Organizations: GASTON COUNTY SCHOOLS (SCHOOL DISTRICT)
BESSEMER CITY CITY - SMALL MS4 (132 W VIRGINIA AVE in BESSEMER CITY, NC)
AIR MONITORING SITE (Airborne pollution emission tracking) National Pollutant Discharge Elimination System NON-MAJOR (Tracking pollutant discharge elimination systems) - permit Alternative names: BESSEMER CITY CITY HALL
CLEVELAND AGGREGATES (HIGHWAY 274 in BESSEMER CITY, NC)
AIR MINOR (AIRS/AFS) Business SIC classification: CRUSHED AND BROKEN GRANITE
Housing units lacking complete plumbing facilities: 2.5%
Housing units lacking complete kitchen facilities: 2.0%
70.6% Electricity 22.5% Utility gas 4.7% Bottled, tank, or LP gas 1.5% Fuel oil, kerosene, etc. 0.6% Wood
Population in 1990: 8,858. Population change in the 1990s: +5,505 (+62.1%).
Place of birth for U.S.-born residents:
This state: 10,124Northeast: 405Midwest: 501South: 1,674West: 221
59% of the 28016 zip code residents lived in the same house 5 years ago.
Out of people who lived in different houses, 68% lived in this county.
Out of people who lived in different counties, 50% lived in North Carolina.
95% of the 28016 zip code residents lived in the same house 1 year ago.
Out of people who lived in different houses, 60% moved from this county.
Out of people who lived in different houses, 39% moved from different county within same state.
Out of people who lived in different houses, 7% moved from different state.
Out of people who lived in different houses, 1% moved from abroad.
Private vs. public school enrollment:
Students in private schools in grades 1 to 8 (elementary and middle school): 161
Here:
20.5%North Carolina:
13.8%
Students in private schools in grades 9 to 12 (high school): 95
Here:
12.0%North Carolina:
11.9%
Students in private undergraduate colleges: 52
Here:
11.8%North Carolina:
19.3%
Occupation by median earnings in the past 12 months ($)
105,617 Computer and mathematical occupations 78,389 Architecture and engineering occupations 62,721 Health diagnosing and treating practitioners and other technical occupations 54,987 Management occupations 49,115 Construction and extraction occupations 49,112 Installation, maintenance, and repair occupations
Top industries in this zip code by the number of employees in 2005:
Construction: Site Preparation Contractors (20-49 employees: 1 establishment, 5-9 employees: 3 establishments)Health Care and Social Assistance: Child Day Care Services (10-19: 3, 1-4: 2)Other Services (except Public Administration): Religious Organizations (5-9: 4, 1-4: 7)Administrative and Support and Waste Management and Remediation Services: Janitorial Services (20-49: 1, 1-4: 1)
People in group quarters in 2010:
7 people in group homes intended for adults
2 people in other noninstitutional facilities
People in group quarters in 2000:
3 people in other noninstitutional group quarters
Fatal accident statistics in 2014:
Fatal accident count: 2Vehicles involved in fatal accidents: 3Fatal accidents caused by drunken drivers: 1Fatalities: 2Persons involved in fatal accidents: 3Pedestrians involved in fatal accidents: 0
Fatal accident statistics in 2013:
Fatal accident count: 2Vehicles involved in fatal accidents: 3Fatal accidents caused by drunken drivers: 0Fatalities: 2Persons involved in fatal accidents: 4Pedestrians involved in fatal accidents: 0
Home Mortgage Disclosure Act Aggregated Statistics For Year 2009(Based on 8 partial tracts) A) FHA, FSA/RHS & VA B) Conventional C) Refinancings D) Home Improvement Loans F) Non-occupant Loans on G) Loans On Manufactured Number Average Value Number Average Value Number Average Value Number Average Value Number Average Value Number Average Value
LOANS ORIGINATED 110 $104,061 63 $85,439 292 $112,722 15 $41,977 40 $53,814 34 $78,739 APPLICATIONS APPROVED, NOT ACCEPTED 7 $110,001 6 $52,715 32 $88,895 7 $41,566 5 $36,892 4 $51,002 APPLICATIONS DENIED 25 $88,656 25 $91,839 191 $108,010 15 $34,675 13 $77,203 24 $55,714 APPLICATIONS WITHDRAWN 18 $79,853 9 $108,024 111 $125,440 5 $15,936 6 $74,380 12 $59,949 FILES CLOSED FOR INCOMPLETENESS 2 $48,565 3 $100,347 26 $112,901 2 $61,050 2 $32,925 4 $52,468
Aggregated Statistics For Year 2008(Based on 8 partial tracts) A) FHA, FSA/RHS & VA B) Conventional C) Refinancings D) Home Improvement Loans F) Non-occupant Loans on G) Loans On Manufactured Number Average Value Number Average Value Number Average Value Number Average Value Number Average Value Number Average Value
LOANS ORIGINATED 132 $101,517 123 $112,693 311 $107,815 27 $37,705 59 $67,386 53 $86,795 APPLICATIONS APPROVED, NOT ACCEPTED 6 $86,505 5 $141,016 54 $107,059 5 $37,568 3 $90,140 2 $114,685 APPLICATIONS DENIED 45 $98,255 35 $91,365 337 $117,084 77 $34,845 23 $59,241 42 $79,652 APPLICATIONS WITHDRAWN 8 $82,796 19 $105,219 125 $129,623 6 $110,962 11 $74,647 11 $77,394 FILES CLOSED FOR INCOMPLETENESS 4 $105,250 0 $0 29 $102,271 2 $41,730 0 $0 3 $101,027
Aggregated Statistics For Year 2007(Based on 8 partial tracts) A) FHA, FSA/RHS & VA B) Conventional C) Refinancings D) Home Improvement Loans F) Non-occupant Loans on G) Loans On Manufactured Number Average Value Number Average Value Number Average Value Number Average Value Number Average Value Number Average Value
LOANS ORIGINATED 50 $112,315 293 $98,815 340 $96,470 66 $30,222 103 $71,448 74 $78,685 APPLICATIONS APPROVED, NOT ACCEPTED 2 $70,285 41 $112,342 94 $84,078 15 $32,499 19 $83,949 15 $64,953 APPLICATIONS DENIED 14 $102,659 91 $92,314 360 $98,050 63 $49,830 30 $84,916 47 $76,681 APPLICATIONS WITHDRAWN 9 $94,280 31 $101,362 132 $103,090 15 $90,421 13 $80,411 4 $109,270 FILES CLOSED FOR INCOMPLETENESS 4 $76,442 5 $173,452 40 $123,343 1 $51,460 2 $205,775 3 $92,240
Aggregated Statistics For Year 2006(Based on 8 partial tracts) A) FHA, FSA/RHS & VA B) Conventional C) Refinancings D) Home Improvement Loans F) Non-occupant Loans on G) Loans On Manufactured Number Average Value Number Average Value Number Average Value Number Average Value Number Average Value Number Average Value
LOANS ORIGINATED 47 $103,900 382 $92,654 457 $80,207 58 $68,676 114 $62,385 78 $80,712 APPLICATIONS APPROVED, NOT ACCEPTED 6 $125,395 77 $77,868 71 $91,911 14 $29,917 13 $79,609 28 $58,640 APPLICATIONS DENIED 6 $79,412 123 $85,792 453 $100,679 67 $41,509 43 $132,635 85 $63,561 APPLICATIONS WITHDRAWN 4 $96,112 28 $106,089 186 $101,219 9 $37,892 12 $72,212 21 $77,092 FILES CLOSED FOR INCOMPLETENESS 0 $0 15 $108,608 55 $108,975 1 $12,400 2 $100,910 1 $108,050
Aggregated Statistics For Year 2005(Based on 8 partial tracts) A) FHA, FSA/RHS & VA B) Conventional C) Refinancings D) Home Improvement Loans E) Loans on Dwellings For 5+ Families F) Non-occupant Loans on G) Loans On Manufactured Number Average Value Number Average Value Number Average Value Number Average Value Number Average Value Number Average Value Number Average Value
LOANS ORIGINATED 24 $85,711 305 $84,210 492 $96,247 70 $33,622 2 $584,400 92 $85,660 97 $67,926 APPLICATIONS APPROVED, NOT ACCEPTED 2 $61,555 33 $80,048 123 $86,081 17 $15,709 0 $0 4 $108,170 24 $60,865 APPLICATIONS DENIED 9 $93,961 106 $76,365 502 $102,752 67 $33,323 0 $0 26 $56,906 136 $74,489 APPLICATIONS WITHDRAWN 4 $94,382 119 $82,650 213 $99,601 23 $171,782 0 $0 19 $68,708 37 $78,047 FILES CLOSED FOR INCOMPLETENESS 0 $0 7 $101,269 53 $106,532 0 $0 0 $0 2 $151,205 7 $90,633
Aggregated Statistics For Year 2004(Based on 8 partial tracts) A) FHA, FSA/RHS & VA B) Conventional C) Refinancings D) Home Improvement Loans E) Loans on Dwellings For 5+ Families F) Non-occupant Loans on G) Loans On Manufactured Number Average Value Number Average Value Number Average Value Number Average Value Number Average Value Number Average Value Number Average Value
LOANS ORIGINATED 58 $92,827 287 $89,940 550 $85,810 53 $45,859 2 $376,765 83 $80,175 92 $65,976 APPLICATIONS APPROVED, NOT ACCEPTED 5 $97,322 40 $76,136 113 $84,449 5 $8,288 0 $0 7 $90,219 27 $77,057 APPLICATIONS DENIED 10 $98,464 141 $68,016 437 $90,050 79 $38,272 0 $0 13 $94,594 127 $65,069 APPLICATIONS WITHDRAWN 5 $93,334 76 $84,645 207 $89,506 16 $44,877 0 $0 4 $68,235 29 $82,229 FILES CLOSED FOR INCOMPLETENESS 4 $92,490 4 $185,455 57 $103,906 2 $48,905 0 $0 3 $123,470 7 $86,289
Aggregated Statistics For Year 2003(Based on 8 partial tracts) A) FHA, FSA/RHS & VA B) Conventional C) Refinancings D) Home Improvement Loans F) Non-occupant Loans on Number Average Value Number Average Value Number Average Value Number Average Value Number Average Value
LOANS ORIGINATED 53 $101,026 273 $86,675 897 $92,042 52 $16,857 98 $60,360 APPLICATIONS APPROVED, NOT ACCEPTED 5 $54,334 42 $64,981 130 $80,025 10 $16,996 8 $60,094 APPLICATIONS DENIED 13 $90,855 176 $60,970 459 $87,501 46 $17,794 22 $65,941 APPLICATIONS WITHDRAWN 4 $100,205 52 $99,964 184 $91,451 3 $34,043 12 $52,088 FILES CLOSED FOR INCOMPLETENESS 1 $81,220 8 $109,822 18 $95,893 1 $54,620 2 $42,800
Aggregated Statistics For Year 2002(Based on 6 partial tracts) A) FHA, FSA/RHS & VA B) Conventional C) Refinancings D) Home Improvement Loans F) Non-occupant Loans on Number Average Value Number Average Value Number Average Value Number Average Value Number Average Value
LOANS ORIGINATED 66 $92,935 183 $82,301 409 $81,158 22 $22,521 72 $62,632 APPLICATIONS APPROVED, NOT ACCEPTED 2 $76,960 57 $48,199 93 $77,766 16 $12,321 4 $33,118 APPLICATIONS DENIED 3 $85,537 149 $55,618 315 $79,683 27 $14,632 17 $48,495 APPLICATIONS WITHDRAWN 3 $85,550 31 $93,837 112 $88,422 12 $44,538 5 $96,698 FILES CLOSED FOR INCOMPLETENESS 0 $0 9 $110,248 38 $81,246 1 $27,900 3 $38,360
Aggregated Statistics For Year 2001(Based on 6 partial tracts) A) FHA, FSA/RHS & VA B) Conventional C) Refinancings D) Home Improvement Loans E) Loans on Dwellings For 5+ Families F) Non-occupant Loans on Number Average Value Number Average Value Number Average Value Number Average Value Number Average Value Number Average Value
LOANS ORIGINATED 58 $96,166 158 $83,133 437 $78,790 23 $12,529 3 $378,077 60 $53,943 APPLICATIONS APPROVED, NOT ACCEPTED 5 $79,708 55 $54,902 90 $78,855 13 $26,941 0 $0 10 $41,066 APPLICATIONS DENIED 4 $78,990 195 $46,387 307 $70,721 51 $15,313 0 $0 34 $35,932 APPLICATIONS WITHDRAWN 6 $93,370 25 $92,108 104 $74,565 12 $26,729 0 $0 3 $35,983 FILES CLOSED FOR INCOMPLETENESS 2 $29,650 6 $47,323 16 $82,792 0 $0 0 $0 2 $17,285
Aggregated Statistics For Year 2000(Based on 6 partial tracts) A) FHA, FSA/RHS & VA B) Conventional C) Refinancings D) Home Improvement Loans F) Non-occupant Loans on Number Average Value Number Average Value Number Average Value Number Average Value Number Average Value
LOANS ORIGINATED 45 $86,089 201 $71,677 222 $59,644 66 $15,663 43 $49,367 APPLICATIONS APPROVED, NOT ACCEPTED 12 $52,392 64 $44,867 60 $67,977 24 $13,930 14 $40,111 APPLICATIONS DENIED 12 $51,729 267 $54,704 250 $68,549 54 $14,623 16 $40,704 APPLICATIONS WITHDRAWN 4 $107,768 26 $85,056 69 $69,901 1 $13,020 2 $55,385 FILES CLOSED FOR INCOMPLETENESS 1 $97,960 2 $96,100 18 $51,504 1 $3,720 0 $0
Aggregated Statistics For Year 1999(Based on 4 partial tracts) A) FHA, FSA/RHS & VA B) Conventional C) Refinancings D) Home Improvement Loans E) Loans on Dwellings For 5+ Families F) Non-occupant Loans on Number Average Value Number Average Value Number Average Value Number Average Value Number Average Value Number Average Value
LOANS ORIGINATED 45 $85,124 150 $66,454 207 $66,076 32 $22,881 1 $41,170 27 $56,201 APPLICATIONS APPROVED, NOT ACCEPTED 1 $83,680 84 $51,879 96 $65,615 10 $13,248 0 $0 12 $58,541 APPLICATIONS DENIED 1 $40,450 214 $53,819 161 $62,192 34 $28,398 0 $0 16 $67,704 APPLICATIONS WITHDRAWN 2 $78,835 19 $58,210 98 $62,724 5 $36,752 0 $0 2 $44,720 FILES CLOSED FOR INCOMPLETENESS 0 $0 3 $76,747 25 $54,812 0 $0 0 $0 0 $0
Detailed HMDA statistics for the following Tracts:
0304.00
,
0305.00 ,
0308.00 ,
0316.00
Private Mortgage Insurance Companies Aggregated Statistics For Year 2009(Based on 8 partial tracts) A) Conventional B) Refinancings Number Average Value Number Average Value
LOANS ORIGINATED 0 $0 13 $128,990 APPLICATIONS APPROVED, NOT ACCEPTED 3 $164,317 7 $117,517 APPLICATIONS DENIED 0 $0 2 $74,500 APPLICATIONS WITHDRAWN 0 $0 1 $226,790 FILES CLOSED FOR INCOMPLETENESS 0 $0 0 $0
Aggregated Statistics For Year 2008(Based on 8 partial tracts) A) Conventional B) Refinancings C) Non-occupant Loans on Number Average Value Number Average Value Number Average Value
LOANS ORIGINATED 45 $123,596 29 $159,262 2 $100,335 APPLICATIONS APPROVED, NOT ACCEPTED 3 $167,560 16 $149,451 0 $0 APPLICATIONS DENIED 4 $103,480 0 $0 3 $64,750 APPLICATIONS WITHDRAWN 0 $0 3 $115,590 2 $106,295 FILES CLOSED FOR INCOMPLETENESS 0 $0 2 $121,015 1 $79,360
Aggregated Statistics For Year 2007(Based on 8 partial tracts) A) Conventional B) Refinancings C) Non-occupant Loans on D) Loans On Manufactured Number Average Value Number Average Value Number Average Value Number Average Value
LOANS ORIGINATED 112 $103,530 53 $127,604 10 $96,781 3 $75,383 APPLICATIONS APPROVED, NOT ACCEPTED 13 $107,068 7 $139,966 0 $0 0 $0 APPLICATIONS DENIED 3 $75,303 0 $0 0 $0 0 $0 APPLICATIONS WITHDRAWN 5 $135,204 0 $0 0 $0 0 $0 FILES CLOSED FOR INCOMPLETENESS 1 $212,540 2 $55,970 2 $55,970 0 $0
Aggregated Statistics For Year 2006(Based on 8 partial tracts) A) Conventional B) Refinancings C) Non-occupant Loans on D) Loans On Manufactured Number Average Value Number Average Value Number Average Value Number Average Value
LOANS ORIGINATED 56 $103,620 25 $108,295 7 $76,087 1 $60,560 APPLICATIONS APPROVED, NOT ACCEPTED 3 $77,920 3 $144,157 2 $63,095 3 $77,920 APPLICATIONS DENIED 3 $93,313 2 $52,680 2 $52,680 0 $0 APPLICATIONS WITHDRAWN 2 $67,740 2 $57,775 0 $0 2 $34,570 FILES CLOSED FOR INCOMPLETENESS 0 $0 1 $205,840 0 $0 0 $0
Aggregated Statistics For Year 2005(Based on 8 partial tracts) A) Conventional B) Refinancings C) Non-occupant Loans on D) Loans On Manufactured Number Average Value Number Average Value Number Average Value Number Average Value
LOANS ORIGINATED 49 $99,721 49 $111,642 4 $80,860 4 $102,900 APPLICATIONS APPROVED, NOT ACCEPTED 5 $114,042 10 $82,411 2 $96,775 1 $97,370 APPLICATIONS DENIED 0 $0 3 $81,330 0 $0 0 $0 APPLICATIONS WITHDRAWN 5 $144,110 5 $109,730 0 $0 1 $50,840 FILES CLOSED FOR INCOMPLETENESS 0 $0 1 $102,120 0 $0 1 $102,120
Aggregated Statistics For Year 2004(Based on 8 partial tracts) A) Conventional B) Refinancings C) Non-occupant Loans on D) Loans On Manufactured Number Average Value Number Average Value Number Average Value Number Average Value
LOANS ORIGINATED 54 $96,037 48 $111,331 2 $68,965 7 $66,254 APPLICATIONS APPROVED, NOT ACCEPTED 21 $115,510 25 $133,099 0 $0 4 $97,512 APPLICATIONS DENIED 1 $55,800 1 $172,360 1 $65,100 0 $0 APPLICATIONS WITHDRAWN 1 $86,800 2 $118,290 0 $0 0 $0 FILES CLOSED FOR INCOMPLETENESS 4 $102,775 1 $187,610 0 $0 0 $0
Aggregated Statistics For Year 2003(Based on 8 partial tracts) A) Conventional B) Refinancings C) Non-occupant Loans on Number Average Value Number Average Value Number Average Value
LOANS ORIGINATED 96 $102,622 154 $106,074 7 $63,599 APPLICATIONS APPROVED, NOT ACCEPTED 17 $88,862 76 $108,730 4 $71,455 APPLICATIONS DENIED 1 $111,600 13 $94,222 0 $0 APPLICATIONS WITHDRAWN 6 $92,033 22 $99,473 3 $119,083 FILES CLOSED FOR INCOMPLETENESS 2 $72,435 2 $103,040 0 $0
Aggregated Statistics For Year 2002(Based on 6 partial tracts) A) Conventional B) Refinancings C) Non-occupant Loans on Number Average Value Number Average Value Number Average Value
LOANS ORIGINATED 60 $102,504 103 $97,374 5 $71,446 APPLICATIONS APPROVED, NOT ACCEPTED 11 $83,340 31 $109,588 0 $0 APPLICATIONS DENIED 2 $65,055 8 $108,038 2 $33,745 APPLICATIONS WITHDRAWN 5 $75,698 14 $103,695 0 $0 FILES CLOSED FOR INCOMPLETENESS 0 $0 3 $131,553 0 $0
Aggregated Statistics For Year 2001(Based on 6 partial tracts) A) Conventional B) Refinancings C) Non-occupant Loans on Number Average Value Number Average Value Number Average Value
LOANS ORIGINATED 78 $98,227 80 $105,070 7 $52,726 APPLICATIONS APPROVED, NOT ACCEPTED 15 $91,965 11 $117,669 5 $38,360 APPLICATIONS DENIED 2 $168,195 13 $88,144 3 $82,450 APPLICATIONS WITHDRAWN 2 $37,250 3 $115,873 2 $37,250 FILES CLOSED FOR INCOMPLETENESS 1 $52,700 1 $48,980 0 $0
Aggregated Statistics For Year 2000(Based on 6 partial tracts) A) Conventional B) Refinancings C) Non-occupant Loans on Number Average Value Number Average Value Number Average Value
LOANS ORIGINATED 69 $102,991 24 $78,541 2 $66,500 APPLICATIONS APPROVED, NOT ACCEPTED 2 $117,300 4 $58,008 0 $0 APPLICATIONS DENIED 1 $86,800 3 $119,953 0 $0 APPLICATIONS WITHDRAWN 0 $0 0 $0 0 $0 FILES CLOSED FOR INCOMPLETENESS 2 $90,205 0 $0 0 $0
Aggregated Statistics For Year 1999(Based on 4 partial tracts) A) Conventional B) Refinancings Number Average Value Number Average Value
LOANS ORIGINATED 22 $93,138 10 $73,656 APPLICATIONS APPROVED, NOT ACCEPTED 2 $54,125 4 $93,648 APPLICATIONS DENIED 0 $0 2 $100,225 APPLICATIONS WITHDRAWN 1 $54,010 1 $142,440 FILES CLOSED FOR INCOMPLETENESS 0 $0 0 $0
Detailed PMIC statistics for the following Tracts:
0304.00
,
0305.00 ,
0308.00 ,
0316.00
2002 - 2018 National Fire Incident Reporting System (NFIRS) incidents See full 2006 National Fire Incident Reporting System statistics for zip code 28016, North Carolina
Most common first names in zip code 28016 among deceased individuals Name Count Lived (average)
William 106 69.8 years James 106 67.9 years John 83 73.8 years Mary 80 74.6 years Robert 63 70.5 years Charles 36 67.3 years George 34 68.7 years David 32 67.8 years Thomas 31 69.6 years Helen 26 71.6 years
Most common last names in zip code 28016 among deceased individuals Last name Count Lived (average)
Smith 39 64.6 years Davis 37 70.4 years Carpenter 35 74.2 years Harmon 27 77.8 years Adams 27 70.2 years Jenkins 27 74.7 years Johnson 25 68.8 years Robinson 24 70.7 years Mauney 23 77.9 years Kiser 23 81.8 years
Businesses in zip code 28016
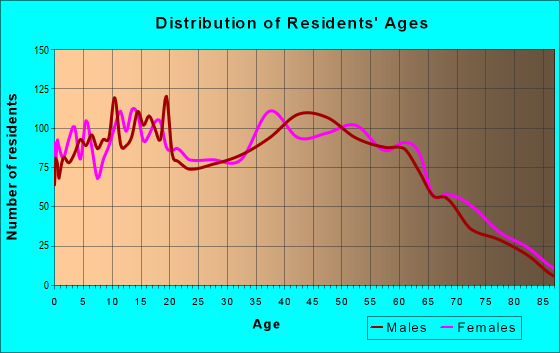
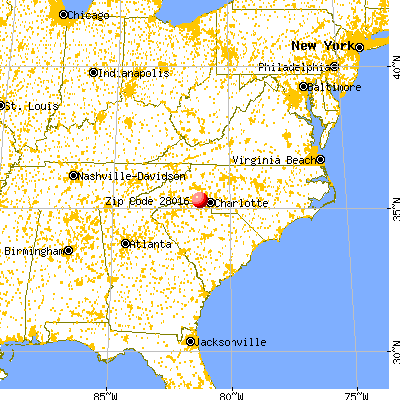


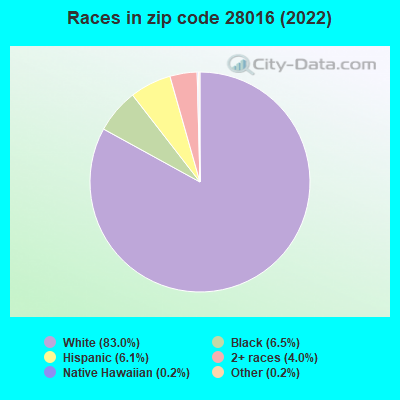


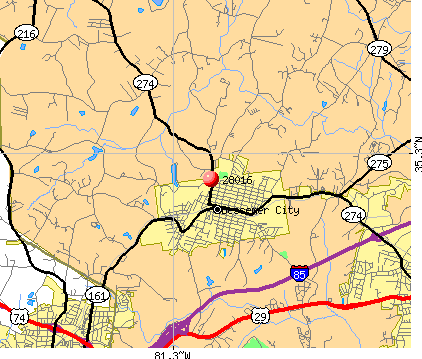 Nearest zip codes: 28034, 28052, 28033, 28086, 28077, 28054.
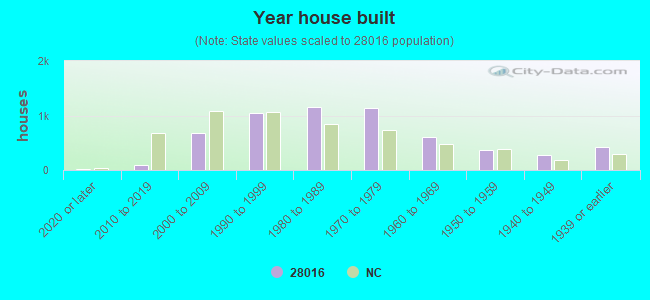
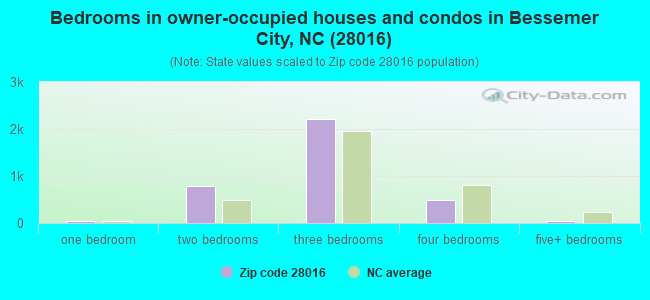
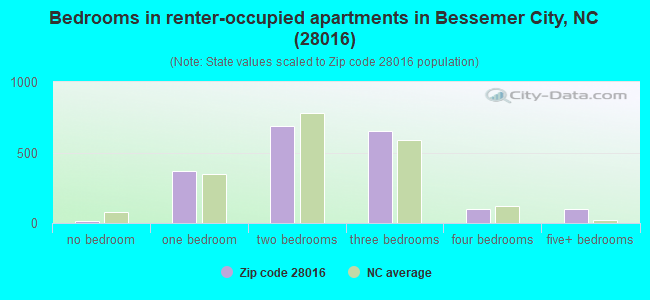
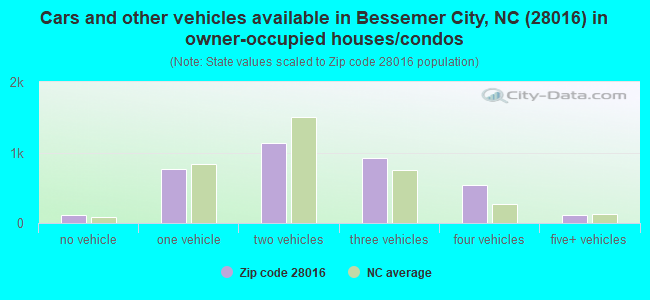
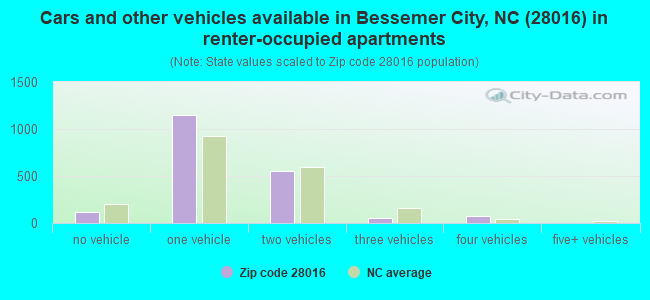


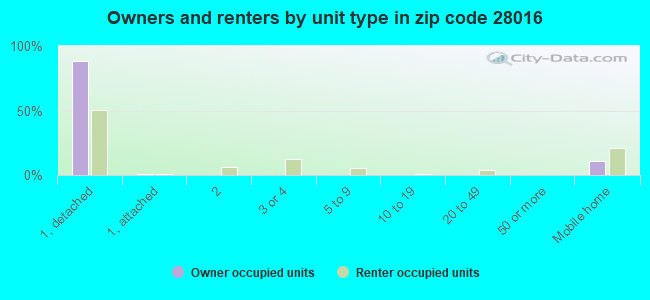
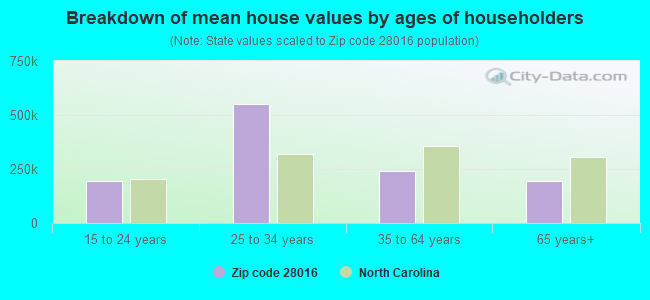


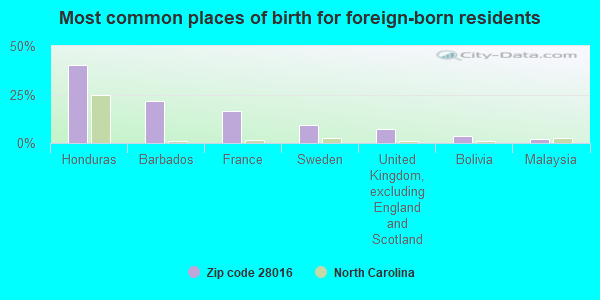
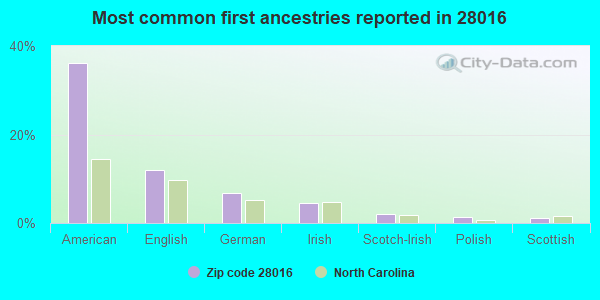
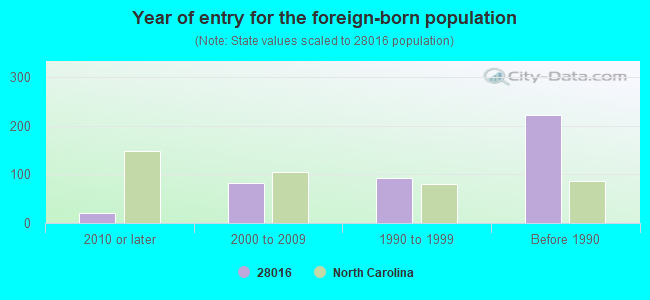
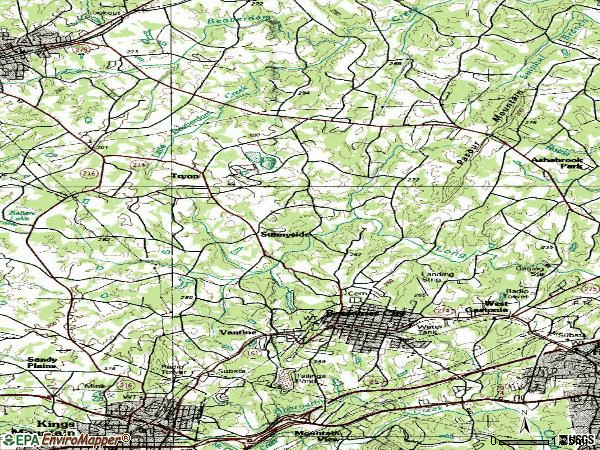

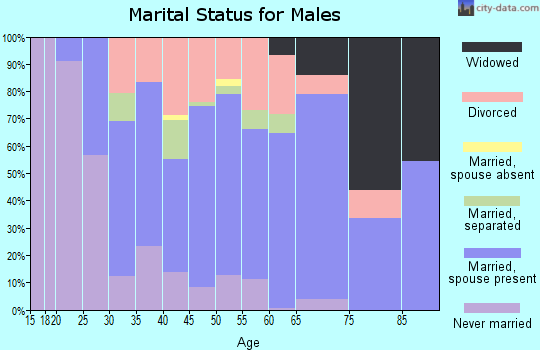
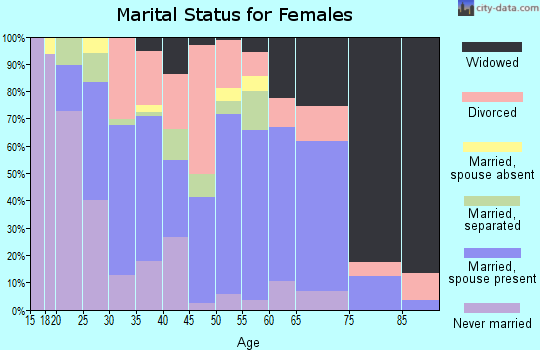
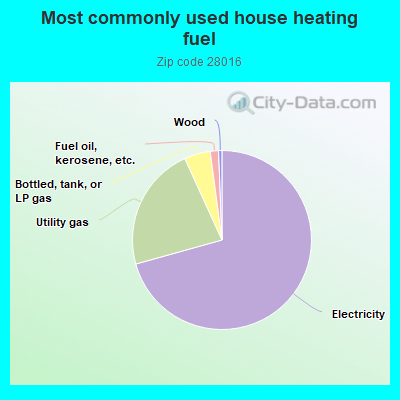
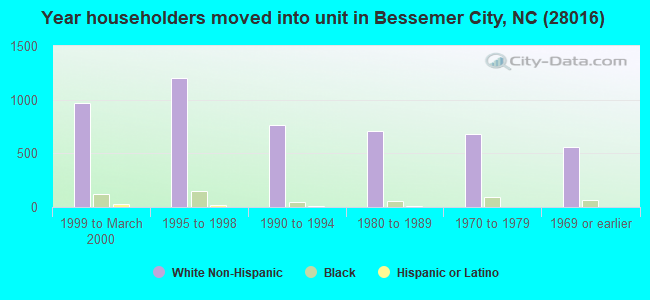
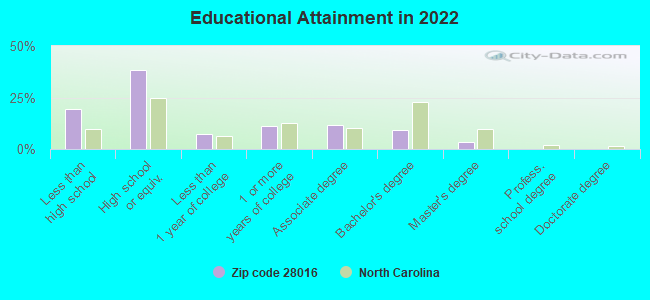
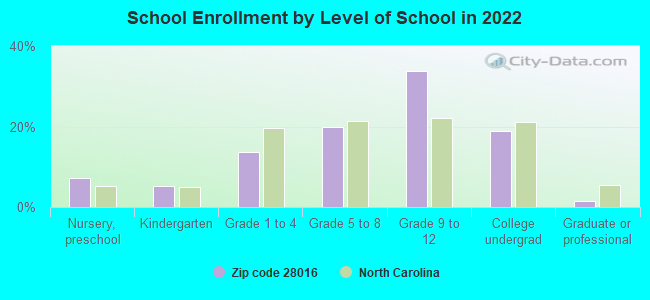
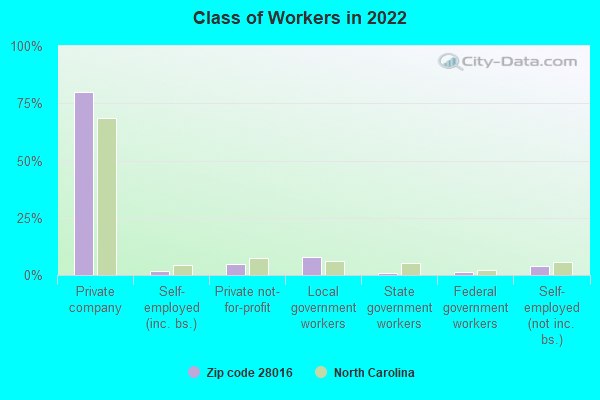
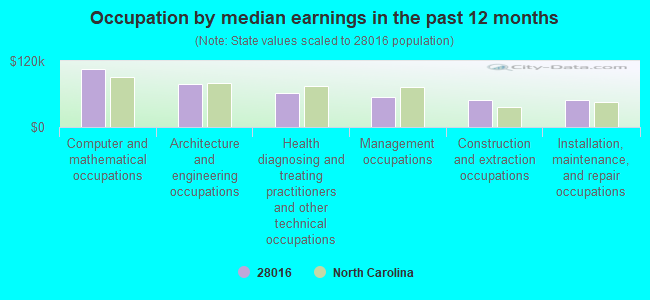
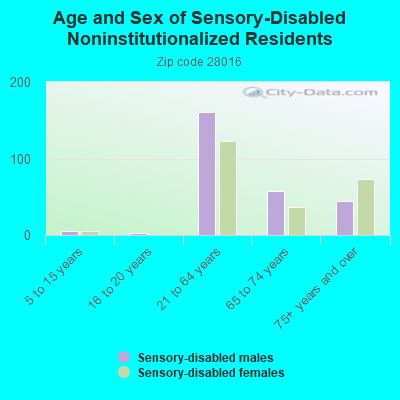
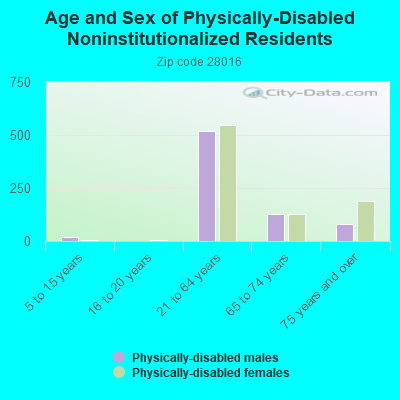
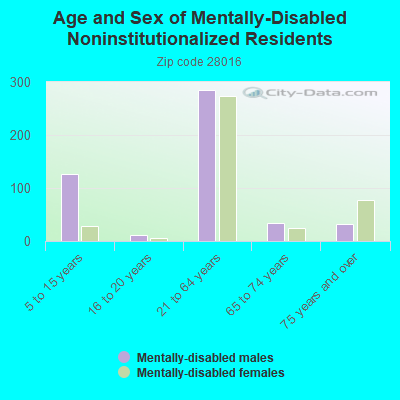
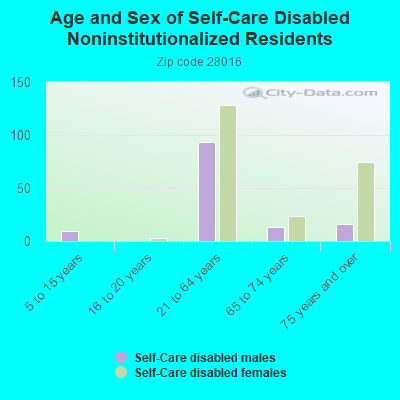
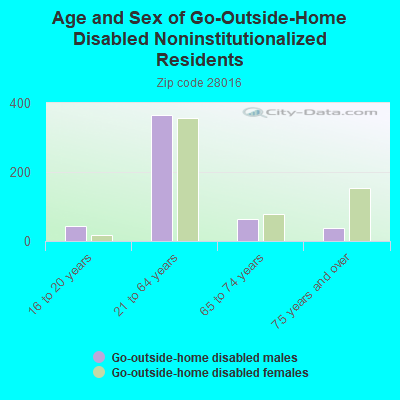
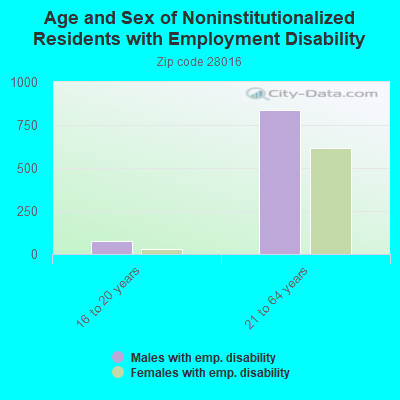
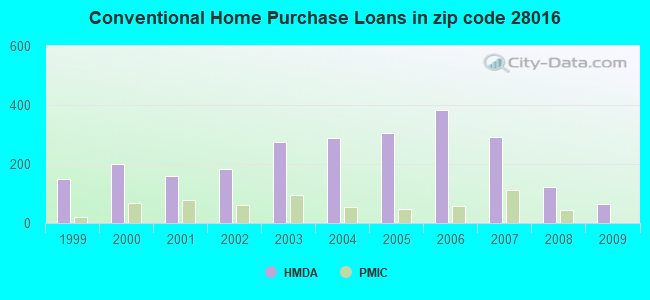
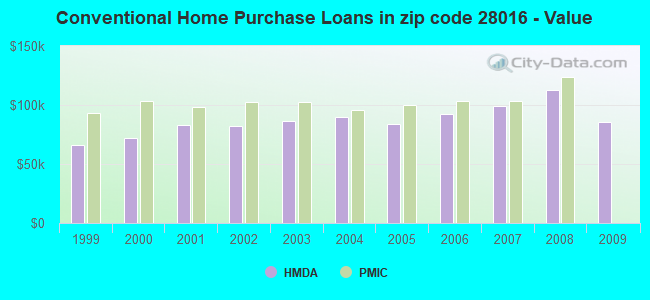
 According to the data from the years 2002 - 2018 the average number of fire incidents per year is 23. The highest number of fires - 43 took place in 2007, and the least - 0 in 2003. The data has a declining trend.
 When looking into fire subcategories, the most reports belonged to: Outside Fires (43.0%), and Structure Fires (40.7%).